
Abstract
Malnutrition is prevalent among patients with nasopharyngeal carcinoma undergoing radiotherapy. This study examined the nutritional status and incidence of radiation-induced oral mucositis (RIOM) in patients with nasopharyngeal carcinoma. A retrospective analysis was conducted to compare the incidence of RIOM, Nutritional Risk Screening (NRS) 2002 score, weight, body mass index (BMI), and hemoglobin levels in 338 patients treated with induction chemotherapy (IC) plus concurrent chemoradiotherapy (CCRT) or treated with CCRT alone. The IC + CCRT group exhibited an increase in weight and BMI but a decrease in hemoglobin levels after IC compared with baseline (p < 0.001). Both groups showed differences in weight at Week 0 and BMI at Weeks 0–2 of radiotherapy (p < 0.05). The IC + CCRT group experienced an increase in NRS 2002 scores from Week 2 to Week 6 (p < 0.05). The hemoglobin levels of the IC + CCRT group were consistently lower throughout radiotherapy (p < 0.001). However, no significant difference was observed in the incidence of RIOM between the two groups (p = 0.246). Patients treated with IC + CCRT exhibited a higher nutritional risk during radiotherapy. Although the incidence of Grade III RIOM was high, no significant difference was found between the groups.
Introduction
Nasopharyngeal carcinoma (NPC) is a common malignant neoplasm of the head and neck. It is endemic in East and Southeast Asia including China, but it rarely occurs in Europe (Citation1–3). Its anatomical location, being the target area of radiotherapy (RT), is intricately linked with eating and swallowing functions, making it susceptible to dysphagia and pain during chemoradiotherapy (Citation4–7). The pathological alterations at the tumor site coupled with acute toxic oral reactions to RT, such as diminished taste sensitivity and damage to oral mucosal membranes, can lead to mucositis, xerostomia, pain, and swallowing difficulties. These issues, in turn, contribute to a reduction in dietary intake, hastening weight loss and BMI reduction (Citation8–11). Despite advancements in RT techniques, such as intensity-modulated RT (IMRT), which has mitigated radiation-induced toxicity, previous studies indicated a high incidence of malnutrition in patients with head and neck tumors undergoing radical RT (Citation1, Citation12–18). Reduced oral intake and compromised nutritional status pose a potential threat to the treatment plan, ultimately impacting patient outcomes and quality of life (Citation19–22). The early detection of patients at nutritional risk is crucial for timely interventions to prevent malnutrition. The Nutritional Risk Screening (NRS) 2002 is a straightforward, validated tool designed to identify patients at nutritional risk (Citation23–27). In 2018, China’s inaugural Expert Consensus on Nutritional Therapy for Patients with Malignant Tumor Radiotherapy recommended the use of NRS 2002 to assess the nutritional risk of patients undergoing RT (Citation28). Since 2019, nutritional risk screenings have been routinely performed for patients with NPC in Jiangxi Cancer Hospital.
Most previous studies have focused on nutritional status and/or radiation-induced oral mucositis (RIOM), nutritional intervention, or survival outcomes of NPC patients. However, a comparison of the nutritional status and RIOM between patients treated with induction chemotherapy (IC) plus concurrent chemoradiotherapy (CCRT) and CCRT alone was not conducted (Citation8, Citation29–31). The nutritional status of patients treated with IMRT was assessed, including weight, BMI, serum albumin, and pre-albumin at the end of chemoradiotherapy and after chemoradiotherapy. However, specific details regarding the cycles of concurrent chemotherapy were not provided (Citation32). One study evaluated the effect of oral nutritional intervention on the nutritional status of NPC patients receiving CCRT using the NRS 2002 (Citation33). In another study, a comparison was made between the IC + CCRT group and the CCRT group, but the comparison focused on evaluating the long-term, disease-free, and distant metastasis-free survival (Citation34). NRS 2002 can be used to identify patients at nutritional risk and those that are likely to benefit from nutritional support (Citation25). It has been applied among non-cancer patients and patients with other types of cancers (Citation35–38). The European Society for Parenteral and Enteral Nutrition (ESPEN) released evidence-based guidelines, which included updated nutritional care for patients with any type of cancer. Of the three steps highlighted by ESPEN, the first step was to ensure all cancer patients undergo early screening for nutritional risk regardless of their BMI status and weight history (Citation24, Citation26). A previous study found that 32% of 1,453 cancer outpatients were at nutritional risk (Citation39). Although no studies have compared the hemoglobin levels as a nutritional indicator between IC + CCRT and CCRT in NPC patients, one study used hemoglobin level as one of four peripheral blood indicators to construct the peripheral blood signature (Citation40). This signature score was employed to differentiate NPC patients based on outcomes (Citation40). Using hemoglobin as one of the factors reflecting patients’ baseline nutrition could assist in predicting high-risk patients for nasopharyngeal necrosis (Citation41). To address this literature gap, this study analyzed and compared the nutritional status and incidence of RIOM during RT in NPC patients treated with either IC + CCRT or CCRT alone.
Methods
Study Design and Participants
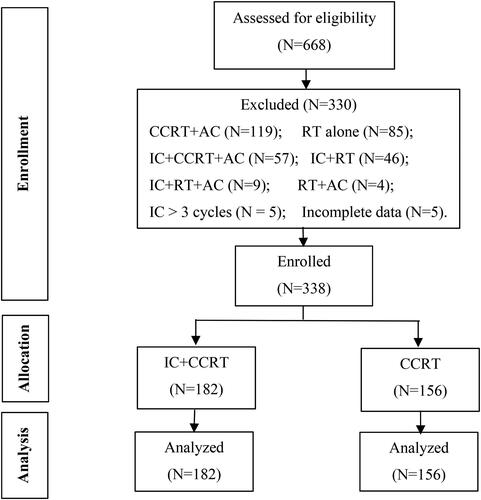
This single-center, retrospective study enrolled 338 patients newly diagnosed with NPC and receiving IC + CCRT or CCRT alone between January 2019 and December 2020. Data from 668 patients who had radical chemoradiotherapy for NPC from 2019 and 2020 were extracted from the hospital records. After reviewing the clinical charts, 330 patients who were treated with more than three cycles of IC or other modalities such as RT alone or radiotherapy followed by adjuvant chemotherapy were not considered eligible for the study. The study did not include any patients with pretreatment trismus.
Patients who were pathologically diagnosed with differentiated or undifferentiated non-keratinizing NPC and treated with IC + CCRT or CCRT alone in Jiangxi Cancer Hospital between 2019 and 2020; aged ≥18 years; and with a Karnofsky Performance Status (KPS) score of ≥ 70 were included. By contrast, patients who received initial cancer treatment at a location other than Jiangxi Cancer Hospital and received other treatment regimens such as CCRT followed by adjuvant chemotherapy (AC) or IC followed by RT or RT alone, with distant metastasis, and with incomplete clinical data were excluded. Hence, only 338 patients were analyzed to determine the nutritional status and incidence of RIOM during RT. These patients were classified into two subgroups according to the treatment modality used: 182 patients in the IC + CCRT group and 156 patients in the CCRT-only group ().
Figure 1. Flow chart of the patient selection process.
NRS 2002 was routinely utilized for nutritional risk screening at our hospital. An NRS 2002 score of ≥3 points indicated a nutritional risk, necessitating the implementation of a nutritional care plan. An NRS 2002 score of <3 points indicated the need to repeat the screening weekly (Citation23). Patients’ NRS 2002 scores were classified into three categories: 0–2 points for low risk, 3–4 points for at risk, and ≥5 points for high risk.
The Radiation Therapy Oncology Group scoring criteria were employed for grading RIOM: (a) none for Grade 0, (b) erythema of the oral mucosa for Grade I, (c) patchy reaction of <1.5 cm and noncontiguous for Grade II, (d) confluent mucositis >1.5 cm and contiguous for Grade III, and (e) necrosis or deep ulceration ± bleeding for Grade IV (Citation31). This study examined the highest grading observed during RT.
Nutrition-related data were retrieved from clinical records to evaluate the nutritional status and the incidence of RIOM between the two groups during RT. The different parameters used to assess nutritional risk included weight, BMI, hemoglobin level, and NRS 2002 scores at ten time points in the IC + CCRT group and at seven time points in the CCRT alone group. T0 denotes the time point before any cancer treatment or at baseline. RT-W0 to RT-W6 represent the time points before concurrent chemoradiotherapy and at Weeks 1–6 of radiotherapy. In the CCRT alone group, variables from RT-Week 0 were considered baseline data for comparison.
Data Collection
Patient characteristics, including age, gender, KPS score, tumor stage (based on the Union for International Cancer Control and American Joint Committee on Cancer staging systems), level of education, employment status, number of chemotherapy cycles, and targeted therapy, were obtained from the medical records of 338 patients. The baseline nutritional parameters comprising weight, BMI, hemoglobin level, and NRS 2002 score before cancer treatment were also collected. The baseline data included the cycles of IC and concurrent chemotherapy administered among patients in the two groups. Weekly weight, BMI, NRS 2002 score, and hemoglobin levels were obtained at seven time points during concurrent chemoradiotherapy.
Endpoints of the Study
The primary endpoint of the study was the nutritional status and the incidence of RIOM during RT in NPC patients treated with IC + CCRT or CCRT alone. The secondary endpoint of this study was the changing trend in the nutritional status and associated parameters, including weight, BMI, NRS 2002 score, and hemoglobin levels throughout the chemoradiotherapy course in NPC patients treated with IC + CCRT or CCRT alone.
Statistical Analysis
Statistical analyses were performed using IBM SPPS Statistics 26.0 to assess the differences between the two groups. These analyses included a comparison of patient characteristics, baseline nutritional parameters, and an examination of the changing trends in weekly weight, BMI, NRS 2002, and hemoglobin levels during radiotherapy. Descriptive statistics such as frequency (%) were used to express categorical variables such as patient characteristics. Mean and standard deviations or median and ranges were used to express continuous variables. Independent T-tests were applied to compare variables with normal distribution. A chi-square test was performed to compare categorical variables between subgroups. The General Linear Model Repeated Measures were used to analyze the changing trends in weight, BMI, NRS 2002 scores, and hemoglobin levels at different time points between the IC + CCRT group and the CCRT alone group. All statistical tests were two sided, and a p value of <0.05 was considered significant.
Results
Baseline Characteristics of Participants
The study consisted of 182 patients in the IC + CCRT group and 156 in the CCRT-only group; all patients were treated with IMRT and received a total dose of 70 Gray (Gy), administered in 32–35 fractions. In the IC + CCRT group, 118 (64.8%) patients received two cycles of IC, while 50 (27.5%) patients received three cycles of IC. These 50 patients were also included in the tally of those who received “two cycles.” The IC + CCRT group exhibited a significant increase in mean weight and BMI, but a decrease in hemoglobin levels after induction chemotherapy (p < 0.001). No difference was found in the NRS 2002 score before and after IC (p = 0.374). The results are provided in the Supplementary Table 1. The comparison of baseline characteristics between the two groups is presented in . The IC + CCRT group had a higher proportion of male patients compared with the CCRT alone group (p = 0.038). The IC + CCRT group had a higher proportion of patients with T3–T4 stage than the CCRT alone group (p = 0.008). Both groups had high proportions of patients with N0–N2 stage, but the IC + CCRT group had a higher proportion of patients with N3 cancer (p = 0.021). Patients diagnosed with stage IV disease more frequently received IC + CCRT than CCRT alone (p < 0.001). Conversely, patients with stage III disease more commonly received CCRT alone (p < 0.001). These treatment plans were consistent with the national treatment guidelines (Citation42). No significant difference was observed in patients receiving targeted therapy during RT between the two groups (p = 0.233).
Table 1. Comparison of baseline characteristics.
All patients in the CCRT alone group received 1–3 cycles of chemotherapy, whereas 129 (70.9%) patients in the IC + CCRT group received 4–5 cycles of chemotherapy (p < 0.001). In the IC + CCRT group and CCRT alone group, 123 (67.6%) and 120 (76.9%) patients, respectively, received two cycles of concurrent chemotherapy during RT. No significant difference was found in the mean (SD) weight, BMI, NRS 2002 scores, and hemoglobin levels between the two groups at baseline (p = 0.373, 0.198, 0.089, and 0.358, respectively).
Incidence of RIOM during Radiotherapy
All patients in both groups developed a certain degree of RIOM during RT, but none of them progressed to Grade IV RIOM. The IC + CCRT group had a similar incidence of Grade I, Grade II, and Grad III RIOM compared with the CCRT alone group during RT(p = 0.246) (). During radiotherapy, Grade III RIOM occurred in 49% of patients in the IC + CCRT group and 57% of patients in the CCRT alone group.
Table 2. Comparison of radiation-induced oral mucositis incidence during radiotherapy between subgroups.
Weight and BMI during Radiotherapy and Changes in Trends during the Entire Treatment Period
Both subgroups showed a downward trend in weight and BMI values ( and ). The weight loss rates from baseline to the end of RT were 3.1 kg (5.1%) in total and 3.2 kg (5.3%) in patients treated with IC + CCRT and CCRT alone, respectively. Patients in the IC + CCRT group gained 1.3 kg (2.1%) after ICs but lost 4.4 kg (7%) during RT. Patients in the CCRT alone group lost 3.2 kg (5.3%) from Week 0 to Week 6 during RT. The IC + CCRT group had a higher weight at Week 0 before RT than the CCRT alone group (p = 0.05). However, no significant differences were observed between the two groups from Week 1 to Week 6 (Week 1 p = 0.1, Week 2 p = 0.149, Week 3 p = 0.254, Week 4 p = 0.418, Week 5 p = 0.431, and Week 6 p = 0.299). The mean BMI was higher in the IC + CCRT group compared with that in the CCRT alone group at Week 0, Week 1, and Week 2 during RT (Week 0 p = 0.006, Week 1 p = 0.021, and Week 2 p = 0.044). However, no significant differences were observed between the two groups from Week 3 to Week 6 (Week 3 p = 0.119, Week 4 p = 0.272, Week 5 p = 0.256, and Week 6 p = 0.133). The additional data are presented in Supplementary Table 2.
Figure 2. A: Weekly trends in weight at baseline and during radiotherapy between the two groups; B: Weight of patients who received three cycles of induction chemotherapy at 10 time points; T0: before treatment; RT-W0: Week 0 of radiotherapy; RT-W1: Week 1 of radiotherapy; RT-W2: Week 2 of radiotherapy; RT-W3: Week 3 of radiotherapy; RT-W4: Week 4 of radiotherapy; RT-W5: Week 5 of radiotherapy; RT-W6: Week 6 of radiotherapy; IC + CCRT: induction chemotherapy + concurrent chemoradiotherapy; CCRT: concurrent chemoradiotherapy; IC1: the 1st induction chemotherapy; IC2: the 2nd induction chemotherapy; IC3: the 3rd induction chemotherapy.
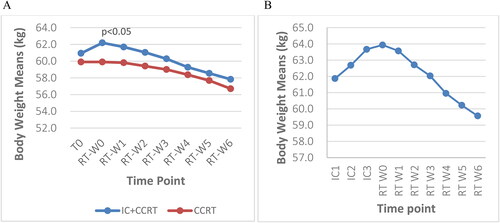
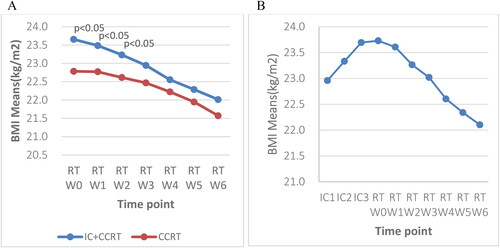
Figure 3. A: Weekly trends in BMI at baseline and during radiotherapy between the two groups; B: BMI of patients who received three cycles of IC at 10 time points; BMI: body mass index; T0: before treatment; RT-W0: Week 0 of radiotherapy; RT-W1: Week 1 of radiotherapy; RT-W2: Week 2 of radiotherapy; RT-W3: Week 3 of radiotherapy; RT-W4: Week 4 of radiotherapy; RT-W5: Week 5 of radiotherapy; RT-W6: Week 6 of radiotherapy; IC + CCRT: induction chemotherapy + concurrent chemoradiotherapy; CCRT: concurrent chemoradiotherapy; IC1: the 1st induction chemotherapy; IC2: the 2nd induction chemotherapy; IC3: the 3rd induction chemotherapy.
The IC + CCRT group had a higher mean weight than the CCRT alone group throughout the treatment course. A significant difference was found in the weight between the two groups at Week 0 before RT (p = 0.05). However, no significant differences were found in the following six weeks during RT (). The IC + CCRT group exhibited a mean weight increase after each IC treatment but experienced a decrease during RT ().
The BMI change of both groups demonstrated a downward trend during radiotherapy. The IC + CCRT group had a higher BMI compared with the CCRT alone group at all time points. The BMI of the IC + CCRT group increased at Week 0 of RT then progressively decreased from Week 1 to Week 6 with significant differences at Week 0, Week 1, and Week 2 during RT (p < 0.05) (). Patients who received three cycles of IC experienced an increase in BMI after IC1, IC2, and IC3 but a subsequent decline during RT (). The additional data are shown in Supplementary Table 2.
NRS 2002 Scores during Radiotherapy and Changes in the Trends during the Treatment Period
A chi-square test was performed to compare the weekly NRS 2002 scores between the two subgroups during RT (). Significant differences were observed between the NRS 2002 scores of the subgroups from Week 2 to Week 6 (p < 0.05). At risk patients in both subgroups demonstrated a notable upward trend, increasing from 15.9% and 21.8% at Week 0 to 78% and 68.6% at Week 6 during RT in the IC + CCRT group and the CCRT alone group, respectively. The CCRT only group had a higher proportion of at risk patients in Week 0 and Week 1 (21.8% vs. 15.9% and 21.2% vs. 20.9%). However, the IC + CCRT had a higher proportion of at risk patients from Week 2 (28% vs. 23.7%) until Week 6. This finding indicated that the IC + CCRT group had a higher proportion of at risk patients during RT. Although both groups had a lower proportion of high risk patients, the CCRT alone group had a higher proportion of high risk patients throughout the course of RT (1.3% vs. 0.6% at Week 0; 4.5% vs. 0.6% at Week 6).
Table 3. Comparison of weekly NRS 2002 scores during radiotherapy between subgroups.
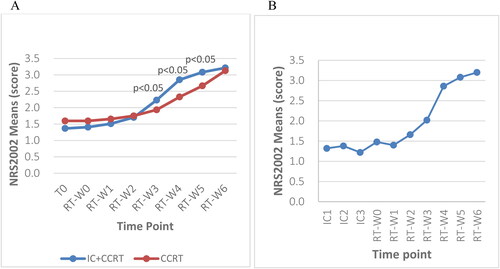
Based on the NRS 2002 scores, the nutritional risk of both groups showed an upward trend. The IC + CCRT group demonstrated a lower mean NRS 2002 score at baseline/T0 and Weeks 0–2 of RT than the CCRT alone group. However, this trend reversed after Week 2, with the IC + CCRT group exhibiting a significantly higher mean NRS 2002 score for three consecutive weeks (p < 0.05) (). The IC + CCRT NRS 2002 mean score slightly increased at the 2nd IC and Week 0 of RT. The increase accelerated between Week 2 and Week 4 ().
Figure 4. A: Weekly trends in the NRS 2002 score at baseline and during radiotherapy between the two groups; B: the NRS 2002 score of patients who received three cycles of IC at 10 time points; NRS 2002: Nutritional Risk Screening 2002; T0: before treatment; RT-W0: Week 0 of radiotherapy; RT-W1: Week 1 of radiotherapy; RT-W2: Week 2 of radiotherapy; RT-W3: Week 3 of radiotherapy; RT-W4: Week 4 of radiotherapy; RT-W5: Week 5 of radiotherapy; RT-W6: Week 6 of radiotherapy; IC + CCRT: induction chemotherapy + concurrent chemoradiotherapy; CCRT: concurrent chemoradiotherapy; IC1: the 1st induction chemotherapy; IC2: the 2nd induction chemotherapy; IC3: the 3rd induction chemotherapy.
Changes in Hemoglobin Levels during Radiotherapy and Trends during the Entire Treatment
The hemoglobin levels were compared between subgroups before and during RT from Week 0 to Week 6 using independent T-tests. Both subgroups exhibited progressively decreasing hemoglobin levels throughout the RT course. The hemoglobin level of the IC + CCRT group was significantly lower than that of the CCRT alone group at seven time points during RT (p < 0.001) (). The total reductions in hemoglobin levels from baseline/T0 to the end of RT were 29.8 g/L (21.4%) and 21.7 g/L (15.4%) in the IC + CCRT group and CCRT alone group, respectively.
Figure 5. A: Weekly trends in hemoglobin levels at baseline and during radiotherapy between the two groups; B: Hemoglobin level of patients who received three cycles of IC at 10 time points; T0: before treatment; RT-W0: Week 0 of radiotherapy; RT-W1: Week 1 of radiotherapy; RT-W2: Week 2 of radiotherapy; RT-W3: Week 3 of radiotherapy; RT-W4: Week 4 of radiotherapy; RT-W5: Week 5 of radiotherapy; RT-W6: Week 6 of radiotherapy; IC + CCRT: induction chemotherapy + concurrent chemoradiotherapy; CCRT: concurrent chemoradiotherapy; IC1: the 1st induction chemotherapy; IC2: the 2nd induction chemotherapy; IC3: the 3rd induction chemotherapy.
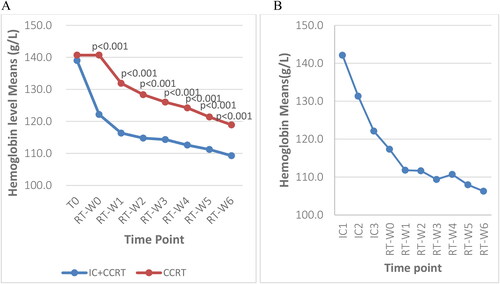
The two groups had downward-trending weekly hemoglobin levels throughout treatment. The IC + CCRT group had lower hemoglobin levels from the baseline to the end of radiotherapy. The differences in hemoglobin levels between subgroups were significant during RT (p < 0.001) except at baseline (p > 0.05) (). The IC + CCRT group had sharp declines in hemoglobin levels during ICs and a lessened decrease during RT whereas the CCRT only group had a considerable drop in Week 1 (). The additional data are given in the Supplementary Table 3.
Discussion
Malnutrition is one of the most common complications in cancer patients undergoing chemoradiotherapy. This study aimed to evaluate and compare the nutritional status and the incidence of RIOM during concurrent chemoradiotherapy in NPC patients treated with IC + CCRT or CCRT alone. This study is the first to compare the nutritional status and incidence of RIOM between patients treated with IC + CCRT and those treated with CCRT alone. Most previous studies addressed the nutritional status or RIOM during RT in NPC patients but did not include a comparison between IC + CCRT and CCRT alone (Citation29, Citation43). The weight, BMI, and hemoglobin levels decreased, while the NRS 2002 scores and incidence of RIOM increased during concurrent chemoradiotherapy in the IC + CCRT group and CCRT alone group.
Our findings indicated significant differences in gender, TN stage and overall stage, cycles of chemotherapy, and IC between the two groups. This study was conducted in accordance with the guidelines on evidence-based recommendations for chemotherapy in combination with RT for stage II to IVA NPC (Citation44). In this study, IC + CCRT was administered to NPC patients with higher TN and overall stages. Meanwhile, CCRT alone was administered to patients with lower TN and overall stages. A previous study found a significant difference in the TN and overall stage between IC + CCRT and CCRT + adjuvant chemotherapy (CCRT-AC) (Citation29). This study had a higher proportion of female patients treated with CCRT alone, likely due to the higher life expectancy of women (80.5 years) than men (74.7 years) in the Chinese population (Citation45). CCRT only is recommended for older patients according to the NPC treatment guidelines. No significant differences were found between subgroups in other demographic characteristics or nutritional parameters at baseline, including weight, BMI, NRS 2002 score, and hemoglobin levels.
Patients in both subgroups showed weight loss during RT. The IC + CCRT group lost 4.36 kg (7%), whereas the CCRT alone group lost 3.2 kg (5.3%). However, the IC + CCRT group had a significantly higher mean weight at RT-Week 0, as a result of a mean weight gain of 1.3 kg (2.1%) after ICs. Weight gain following ICs was consistent with the findings reported in previous studies related to nutritional interventions for NPC during chemoradiotherapy (Citation46, Citation47). No significant differences were observed in weight between the two groups from Week 1 to Week 6 during RT in this study. Moreover, patients in this study experienced a lower or similar total weight loss throughout RT compared with those in other studies. Patients in the IC + CCRT group exhibited a 5.1% weight loss, while those in the CCRT alone group demonstrated a 5.3% weight loss. Comparatively, two small studies reported a 7.4%–8.6% weight loss, while a nutritional intervention study reported a 4.5% weight loss (Citation33, Citation46, Citation48). This finding suggests that patients who received IC + CCRT and CCRT during IMRT experienced less weight loss, considering the absence of nutritional intervention in this study.
In this study, the mean BMI increased by 0.5 kg/m2 (1.9%) after induction chemotherapy in the IC + CCRT group but decreased in both subgroups during RT. BMI was significantly higher in the IC + CCRT group than in the CCRT alone group during the first three weeks of RT. However, no significant differences were observed in the BMI values from Week 3 to Week 6. During RT, the mean BMI reduced to 1.6 kg/m2 (6.9%) in the IC + CCRT group and 1.2 kg/m2 (5.3%) in the CCRT group. The BMI values reduced to less than the 2.4 kg/m2 (10.1%) in the CCRT alone group in this study and to 1.5–1.9 kg/m2 (6.2–8.2%) in the CCRT or IC + CCRT group and IMRT group in two studies (Citation33, Citation43, Citation49).
The proportion of patients at nutritional risk (NRS 2002 score: 3–4 points) in both subgroups demonstrated a notable increase throughout RT, whereas the proportion of patients in the IC + CCRT group demonstrated a notable increase from Week 2 to Week 6 during RT. A higher proportion of patients treated with CCRT alone were at nutritional risk in the first two weeks of RT. Conversely, a higher proportion of patients treated with IC + CCRT were at nutritional risk in the next five weeks (Week 2–6). This finding was likely associated with the induction chemotherapy received before RT. However, a higher proportion of patients in the CCRT only group were at high nutritional risk (NRS 2002 ≥5) at baseline (1.3% vs. 0%) and throughout RT (4.5% vs. 0.6%), likely due to the higher number of elderly patients treated with CCRT alone. Compared with an NRS 2002 score of ≥3 in a retrospective study focused on patients treated with IC + CCRT (Citation50), patients in the IC + CCRT group in our study showed a higher nutritional risk at baseline (15.4% vs. 6.9%), before RT (16.5% vs. 9.8%), and at the end of RT (78.6% vs. 62.8%).
This study showed that patients in both subgroups had progressively declining hemoglobin levels throughout the treatment course. Patients treated with IC + CCRT had persistently and significantly lower hemoglobin levels than those treated with CCRT alone throughout RT. The IC + CCRT group exhibited sharp declines in hemoglobin levels during induction chemotherapy followed by more gradual decreases during RT. Conversely, the CCRT alone group experienced a rapid decline in hemoglobin levels in Week 1 of RT and had a 21.7 g/L (15.4%) decrease in mean hemoglobin levels from baseline to the end of RT. This reduction was less than the 26.39 (18.7%) decrease observed in a study with older NPC patients (Citation49). The pronounced decline in hemoglobin levels in the IC + CCRT group was likely attributed to the effects of induction chemotherapy, which may have consumed most patients’ reserves with little compensation.
Our study demonstrated that all patients developed Grade I to III RIOM during RT. The incidence rates of Grade II and Grade III RIOM were 34% and 49% in the IC + CCRT group and 26% and 57% in the CCRT group during RT, respectively. No previous study compared the incidence of RIOM between NPC patients treated with IC + CCRT and those treated with CCRT alone. These findings were meticulously compared with those of previous studies having certain similarities. This study showed a greater incidence of Grade III RIOM in patients treated with either IC + CCRT (49%) or CCRT alone (57%) when compared with studies conducted in NPC patients treated with IC + CCRT (19%) or those with head and neck cancer treated with CCRT (28.6%) (Citation47, Citation51). However, the incidence of Grade III–IV RIOM in the current study was lower (57% vs. 57.9-67%) than that reported in other studies on head and neck cancer during CCRT (Citation33, Citation52).
Despite the above strengths, this study has two limitations. First, data on the weekly incidence of RIOM with the corresponding grading were not available. Further studies are needed to promptly identify patients at high risk. Second, other nutritional risk factors, including albumin, prealbumin, and C-reactive protein levels, were supposed to be included to compare the changing trends between subgroups; however, this plan failed due to incomplete weekly data.
The findings of this study show that NPC patients treated with IC + CCRT have a higher nutritional risk during RT. This indicates that early nutritional interventions are required before RT. The incidence of Grade III RIOM was high in patients treated with IC + CCRT or CCRT, but no significant difference was found between the subgroups. Future prospective studies should explore the association of long-term outcomes between subgroups with hemoglobin levels.
Author Contributions
CHG, TZL and JGL contributed to the study conception and design; CHG and ZHL performed the data collection; CHG and TZL conducted the statistical analysis and interpreted the data; JGL, XCG, QLL supervised and mentored; CHG wrote the first draft of the manuscript; TZL, ER, and JGL commented and revised the manuscript; all authors read and approved the final manuscript.
Ethics Approval
Ethics committee approval for the study protocol was obtained from the Institutional Review Board (IRB) of Jiangxi Cancer Hospital, the Second Affiliated Hospital of Nanchang Medical College, Nanchang, Jiangxi, China (IRB- 2023ky003). This study was conducted retrospectively from data obtained for clinical purposes. We received permission to use patient information from the IRB of Jiangxi Cancer Hospital. Informed consent for individual patients was waived by the IRB of Jiangxi Cancer Hospital, the Second Affiliated Hospital of Nanchang Medical College, Nanchang, Jiangxi, China.
Availability of Data and Material
The datasets utilized and analyzed during the present study are not publicly available to safeguard the privacy and consent of research participants. However, they can be obtained from the corresponding author upon reasonable request.
Supplemental Material
Download MS Word (16.8 KB)Supplemental Material
Download MS Word (17.4 KB)Supplemental Material
Download MS Word (17.3 KB)Acknowledgments
We would like to thank the medical staff for providing assistance with data collection and all patients who participated in the study. We would also like to thank all authors for providing additional content and feedback on the manuscript as well as reviewing and approving the final manuscript.
Disclosure Statement
No potential conflict of interest was reported by the authors.
Additional information
Funding
References
- Chen Y-P, Chan ATC, Le Q-T, Blanchard P, Sun Y, Ma J. Nasopharyngeal carcinoma. Lancet. 2019;394(10192):64–80. doi: 10.1016/s0140-6736(19)30956-0.
- Ferlay JE, Lam F, Colombet M, Mery L, Piñeros M, Znaor A, Soerjomataram I, Bray F. Global cancer observatory: cancer today. Lyon, France: international Agency for Research on Cancer; 2020.
- Gatta G, Botta L, Sánchez MJ, Anderson LA, Pierannunzio D, Licitra L, EUROCARE Working Group. Prognoses and improvement for head and neck cancers diagnosed in Europe in early 2000s: the EUROCARE-5 population-based study. Eur J Cancer. 2015;51(15):2130–43. doi: 10.1016/j.ejca.2015.07.043.
- Larsson M, Hedelin B, Johansson I, Athlin E. Eating problems and weight loss for patients with head and neck cancer: a chart review from diagnosis until one year after treatment. Cancer Nurs. 2005;28(6):425–35. doi: 10.1097/00002820-200511000-00004.
- Bressan V, Stevanin S, Bianchi M, Aleo G, Bagnasco A, Sasso L. The effects of swallowing disorders, dysgeusia, oral mucositis and xerostomia on nutritional status, oral intake and weight loss in head and neck cancer patients: a systematic review. Cancer Treat Rev. 2016;45:105–19. doi: 10.1016/j.ctrv.2016.03.006.
- Schindler A, Denaro N, Russi EG, Pizzorni N, Bossi P, Merlotti A, Spadola Bissetti M, Numico G, Gava A, Orlandi E, et al. Dysphagia in head and neck cancer patients treated with radiotherapy and systemic therapies: literature review and consensus. Crit Rev Oncol Hematol. 2015;96(2):372–84. doi: 10.1016/j.critrevonc.2015.06.005.
- De Sanctis V, Bossi P, Sanguineti G, Trippa F, Ferrari D, Bacigalupo A, Ripamonti CI, Buglione M, Pergolizzi S, Langendjik JA, et al. Mucositis in head and neck cancer patients treated with radiotherapy and systemic therapies: literature review and consensus statements. Crit Rev Oncol Hematol. 2016;100:147–66. doi: 10.1016/j.critrevonc.2016.01.010.
- De Ruysscher D, Niedermann G, Burnet NG, Siva S, Lee AWM, Hegi-Johnson F. Radiotherapy toxicity. Nat Rev Dis Primers. 2019;5(1):13. doi: 10.1038/s41572-019-0064-5.
- Kubrak C, Olson K, Jha N, Jensen L, McCargar L, Seikaly H, Harris J, Scrimger R, Parliament M, Baracos VE, et al. Nutrition impact symptoms: key determinants of reduced dietary intake, weight loss, and reduced functional capacity of patients with head and neck cancer before treatment. Head Neck. 2010;32(3):290–300. doi: 10.1002/hed.21174.
- Mallick I, Gupta SK, Ray R, Sinha T, Sinha S, Achari R, Chatterjee S. Predictors of weight loss during conformal radiotherapy for head and neck cancers - how important are planning target volumes? Clin Oncol (R Coll Radiol). 2013;25(9):557–63. doi: 10.1016/j.clon.2013.04.003.
- Qiu C, Yang N, Tian G, Liu H. Weight loss during radiotherapy for nasopharyngeal carcinoma: a prospective study from northern China. Nutr Cancer. 2011;63(6):873–9. doi: 10.1080/01635581.2011.582223.
- Langius JAE, Doornaert P, Spreeuwenberg MD, Langendijk JA, Leemans CR, van Bokhorst-de van der Schueren MAE. Radiotherapy on the neck nodes predicts severe weight loss in patients with early stage laryngeal cancer. Radiother Oncol. 2010;97(1):80–5. doi: 10.1016/j.radonc.2010.02.017.
- Jager-Wittenaar H, Dijkstra PU, Vissink A, Langendijk JA, van der Laan BFAM, Pruim J, Roodenburg JLN. Changes in nutritional status and dietary intake during and after head and neck cancer treatment. Head Neck. 2011;33(6):863–70. doi: 10.1002/hed.21546.
- Elting LS, Cooksley CD, Chambers MS, Garden AS. Risk, outcomes, and costs of radiation-induced oral mucositis among patients with head-and-neck malignancies. Int J Radiat Oncol Biol Phys. 2007;68(4):1110–20. doi: 10.1016/j.ijrobp.2007.01.053.
- Kang WX, Li W, Huang SG, Dang Y, Gao H. Effects of nutritional intervention in head and neck cancer patients undergoing radiotherapy: a prospective randomized clinical trial. Mol Clin Oncol. 2016;5(3):279–82. doi: 10.3892/mco.2016.943.
- Datema FR, Ferrier MB, Baatenburg de Jong RJ. Impact of severe malnutrition on short-term mortality and overall survival in head and neck cancer. Oral Oncol. 2011;47(9):910–4. doi: 10.1016/j.oraloncology.2011.06.510.
- Platek ME, Reid ME, Wilding GE, Jaggernauth W, Rigual NR, Hicks WL, Popat SR, Warren GW, Sullivan M, Thorstad WL, et al. Pretreatment nutritional status and locoregional failure of patients with head and neck cancer undergoing definitive concurrent chemoradiation therapy. Head Neck. 2011;33(11):1561–8. doi: 10.1002/hed.21640.
- Irungu CW, Oburra HO, Ochola B. Prevalence and predictors of malnutrition in nasopharyngeal carcinoma. Clin Med Insights Ear Nose Throat. 2015;8:19–22. doi: 10.4137/cment.S12119.
- van den Berg MGA, Rütten H, Rasmussen-Conrad EL, Knuijt S, Takes RP, van Herpen CML, Wanten GJA, Kaanders JHAM, Merkx MAW. Nutritional status, food intake, and dysphagia in long-term survivors with head and neck cancer treated with chemoradiotherapy: a cross-sectional study. Head Neck. 2014;36(1):60–5. doi: 10.1002/hed.23265.
- Kramer B, Wenzel A, Boerger M, Lippert B, Feist K, Petrasch R, Riemann R, Hoermann K, Aderhold C. Long-term quality of life and nutritional status of patients with head and neck cancer. Nutr Cancer. 2019;71(3):424–37. doi: 10.1080/01635581.2018.1506492.
- Löser A, Avanesov M, Thieme A, Gargioni E, Baehr A, Hintelmann K, Tribius S, Krüll A, Petersen C. Nutritional status impacts quality of life in head and neck cancer patients undergoing (chemo)radiotherapy: results from the prospective HEADNUT trial. Nutr Cancer. 2022;74(8):2887–95. doi: 10.1080/01635581.2022.2042571.
- Platek ME, Myrick E, McCloskey SA, Gupta V, Reid ME, Wilding GE, Cohan D, Arshad H, Rigual NR, Hicks WL, et al. Pretreatment weight status and weight loss among head and neck cancer patients receiving definitive concurrent chemoradiation therapy: implications for nutrition integrated treatment pathways. Support Care Cancer. 2013;21(10):2825–33. doi: 10.1007/s00520-013-1861-0.
- Reber E, Gomes F, Vasiloglou MF, Schuetz P, Stanga Z. Nutritional risk screening and assessment. J Clin Med. 2019;8(7):1065. doi: 10.3390/jcm8071065.
- Arends J, Baracos V, Bertz H, Bozzetti F, Calder PC, Deutz NEP, Erickson N, Laviano A, Lisanti MP, Lobo DN, et al. ESPEN expert group recommendations for action against cancer-related malnutrition. Clin Nutr. 2017;36(5):1187–96. doi: 10.1016/j.clnu.2017.06.017.
- Kondrup J, Rasmussen HH, Hamberg O, Stanga Z, Ad Hoc ESPEN Working Group. Nutritional risk screening (NRS 2002): a new method based on an analysis of controlled clinical trials. Clin Nutr. 2003;22(3):321–36. doi: 10.1016/s0261-5614(02)00214-5.
- Arends J, Bachmann P, Baracos V, Barthelemy N, Bertz H, Bozzetti F, Fearon K, Hütterer E, Isenring E, Kaasa S, et al. ESPEN guidelines on nutrition in cancer patients. Clin Nutr. 2017;36(1):11–48. doi: 10.1016/j.clnu.2016.07.015.
- Reber E, Schönenberger KA, Vasiloglou MF, Stanga Z. Nutritional risk screening in cancer patients: the first step toward better clinical outcome. Front Nutr. 2021;8:603936. doi: 10.3389/fnut.2021.603936.
- Association CNCoCA-C: expert Consensus on nutritional therapy for radiotherapy patients. Electron J Metab Nutri Cancer (Chinese). 2021;8:29–34.
- Setakornnukul J, Thephamongkhol K. Neoadjuvant chemotherapy followed by concurrent chemoradiotherapy versus concurrent chemoradiotherapy followed by adjuvant chemotherapy in locally advanced nasopharyngeal carcinoma. BMC Cancer. 2018;18(1):329. doi: 10.1186/s12885-018-4210-3.
- Mallick S, Benson R, Rath GK. Radiation toxicity. In: Practical radiation oncology. Singapore: Springer Singapore; 2020. p. 287–97.
- Maria O, Eliopoulos N, Muanza T. Radiation-induced oral mucositis. Front Oncol. 2017;7:89. doi: 10.3389/fonc.2017.00089.
- Meng L, Wei J, Ji R, Wang B, Xu X, Xin Y, Jiang X. Effect of early nutrition intervention on advanced nasopharyngeal carcinoma patients receiving chemoradiotherapy. J Cancer. 2019;10(16):3650–6. doi: 10.7150/jca.33475.
- Dou S, Ding H, Jiang W, Li R, Qian Y, Wu S, Ling Y, Zhu G. Effect of oral supplements on the nutritional status of nasopharyngeal carcinoma patients undergoing concurrent chemotherapy: a randomized controlled Phase II trial. J Cancer Res Ther. 2020;16(7):1678–85. doi: 10.4103/jcrt.JCRT_273_20.
- Yang Q, Cao S-M, Guo L, Hua Y-J, Huang P-Y, Zhang X-L, Lin M, You R, Zou X, Liu Y-P, et al. Induction chemotherapy followed by concurrent chemoradiotherapy versus concurrent chemoradiotherapy alone in locoregionally advanced nasopharyngeal carcinoma: long-term results of a phase III multicentre randomised controlled trial. Eur J Cancer. 2019;119:87–96. doi: 10.1016/j.ejca.2019.07.007.
- Hersberger L, Bargetzi L, Bargetzi A, Tribolet P, Fehr R, Baechli V, Geiser M, Deiss M, Gomes F, Kutz A, et al. Nutritional risk screening (NRS 2002) is a strong and modifiable predictor risk score for short-term and long-term clinical outcomes: secondary analysis of a prospective randomised trial. Clin Nutr. 2020;39(9):2720–9. doi: 10.1016/j.clnu.2019.11.041.
- Cao J, Xu H, Li W, Guo Z, Lin Y, Shi Y, Hu W, Ba Y, Li S, Li Z, et al. Nutritional assessment and risk factors associated to malnutrition in patients with esophageal cancer. Curr Probl Cancer 2021;45(1):100638. doi: 10.1016/j.currproblcancer.2020.100638
- Efthymiou A, Hersberger L, Reber E, Schönenberger KA, Kägi-Braun N, Tribolet P, Mueller B, Schuetz P, Stanga Z, EFFORT Study Group. Nutritional risk is a predictor for long-term mortality: 5-Year follow-up of the EFFORT trial. Clin Nutr. 2021;40(4):1546–54. doi: 10.1016/j.clnu.2021.02.032.
- Tian M, Fu H, Du J. Application value of NRS2002 and PG-SGA in nutritional assessment for patients with cervical cancer surgery. Am J Transl Res. 2021;13(6):7186–92.
- Bozzetti F, Mariani L, Lo Vullo S, Amerio ML, Biffi R, Caccialanza G, Capuano G, Correja I, Cozzaglio L, Di Leo A, et al. The nutritional risk in oncology: a study of 1,453 cancer outpatients. Support Care Cancer. 2012;20(8):1919–28. doi: 10.1007/s00520-012-1387-x.
- Mao J-R, Lan K-Q, Liu S-L, Liu C, Xie S-Y, Li S-C, Ye W-F, Sun X-S, Mai H-Q. Can the prognosis of individual patients with nasopharyngeal carcinoma be predicted using a routine blood test at admission? Radiother Oncol. 2022;179:109445. doi: 10.1016/j.radonc.2022.109445.
- Li X-Y, Sun X-S, Liu S-L, Chen Q-Y, Guo S-S, Liu L-T, Yan J-J, Xie H-J, Tang Q-N, Liang Y-J, et al. The development of a nomogram to predict post-radiation necrosis in nasopharyngeal carcinoma patients: a large-scale cohort study. Cancer Manag Res. 2019;11:6253–63. doi: 10.2147/cmar.S197841.
- Physicians CSoRO, Association ROTSoCM. Chinese guidelines for radiotherapy of nasopharyngeal carcinoma (2022 edition). Chin J Cancer Prev Treat. 2022;29:611–22. doi: 10.16073/j.cnki.cjcpt.2022.09.01
- Shu Z, Zeng Z, Yu B, Huang S, Hua Y, Jin T, Tao C, Wang L, Cao C, Xu Z, et al. Nutritional status and its association with radiation-induced oral mucositis in patients with nasopharyngeal carcinoma during radiotherapy: a prospective study. Front Oncol. 2020;10:594687. doi: 10.3389/fonc.2020.594687.
- Chen Y-P, Ismaila N, Chua MLK, Colevas AD, Haddad R, Huang SH, Wee JTS, Whitley AC, Yi J-L, Yom SS, et al. Chemotherapy in combination with radiotherapy for definitive-intent treatment of Stage II-IVA nasopharyngeal carcinoma: CSCO and ASCO guideline. J Clin Oncol. 2021;39(7):840–59. doi: 10.1200/jco.20.03237.
- Observatory TGH. Life expectancy for women. World Health Organization: GHO Home, 2020.
- Huang S, Piao Y, Cao C, Chen J, Sheng W, Shu Z, Hua Y, Jiang F, Hu Q, Chen X, et al. A prospective randomized controlled trial on the value of prophylactic oral nutritional supplementation in locally advanced nasopharyngeal carcinoma patients receiving chemo-radiotherapy. Oral Oncol. 2020;111:105025. doi: 10.1016/j.oraloncology.2020.105025.
- Jin T, Li K-X, Li P-J, Huang S, Chen X-Z, Chen M, Hu Q-Y, Shi L, Chen Y-Y. An evaluation of nutrition intervention during radiation therapy in patients with locoregionally advanced nasopharyngeal carcinoma. Oncotarget. 2017;8(48):83723–33. doi: 10.18632/oncotarget.19381.
- Abu Zaid Z, Kay Neoh M, Mat Daud ZA, Md Yusop NB, Ibrahim Z, et al. Weight loss in post-chemoradiotherapy head and neck cancer patients. Nutrients. 2022;14(3):548. doi: 10.3390/nu14030548.
- Duan Y-Y, Deng J, Su D-F, Li W-Q, Han Y, Li Z-X, Huan X-Z, Zhu S-H, Yang Q-L, Hu W, et al. Construction of a comprehensive nutritional index and comparison of its prognostic performance with the PNI and NRI for survival in older patients with nasopharyngeal carcinoma: a retrospective study. Support Care Cancer. 2021;29(9):5371–81. doi: 10.1007/s00520-021-06128-6.
- Pan X, Wang C, Li R, Su L, Zhang M, Cai C, Liu S, Zhang W, Song J, Hong J, et al. Applicability of the nutrition risk screening 2002 combined with a patient-generated subjective global assessment in patients with nasopharyngeal carcinoma. Cancer Manag Res. 2020;12:8221–7. doi: 10.2147/CMAR.S261945.
- Yokota T, Hamauchi S, Yoshida Y, Yurikusa T, Suzuki M, Yamashita A, Ogawa H, Onoe T, Mori K, Onitsuka T, et al. A phase II study of HMB/Arg/Gln against oral mucositis induced by chemoradiotherapy for patients with head and neck cancer. Support Care Cancer. 2018;26(9):3241–8. doi: 10.1007/s00520-018-4175-4.
- Dechaphunkul T, Arundon T, Raungkhajon P, Jiratrachu R, Geater SL, Dechaphunkul A. Benefits of immunonutrition in patients with head and neck cancer receiving chemoradiation: A phase II randomized, double-blind study. Clin Nutr. 2022;41(2):433–40. doi: 10.1016/j.clnu.2021.12.035.