
 ?Mathematical formulae have been encoded as MathML and are displayed in this HTML version using MathJax in order to improve their display. Uncheck the box to turn MathJax off. This feature requires Javascript. Click on a formula to zoom.
ABSTRACT
Research on cybercrime-as-service markets has increased substantially over the last decade, particularly the use of so-called booter and stresser services that enable individuals to engage in high volume denial of service attacks against websites and servers. There is far less research considering the revenues vendors may generate from running these services, calling to question whether the economic gains from this form of crime are greater than the potential risk of arrest or legal sanctions. This analysis attempted to estimate the revenues of 42 booter and stresser services in operation after a series of arrests and takedowns by law enforcement. The models presented were based on the visible characteristics of vendor services, attack volume and customer detail. Three pricing tiers were developed using different potential distributions for booter/stressor markets and find that their potential revenues are of such a magnitude that they may be viewed as an incentive for individuals to enter the market and persist despite the risk of formal sanctions.
Criminological inquiry utilizing the rational choice perspective argues that the rewards of offending must be sufficient to overwhelm the perceived risks of formal sanctions from police and courts, as well as informal harms from other offenders (Kennedy Citation1984; Paternoster, Jaynes, and Wilson Citation2017; Pratt Citation2008). As long as rewards from crime are high, individuals may continue to offend even in the face of increased risks of arrest (Guan and Lo Citation2021; Jacobs Citation1996; Jacobs and Cherbonneau Citation2014). There are various strategies in place to detect certain forms of property and violent crime that may increase the risk of arrest and serve as a potential deterrent (Guan and Lo Citation2021; Guerette and Bowers Citation2009; Ho, Ko, and Mazerolle Citation2022).
It is challenging to apply these same strategies to cybercrimes, or offenses occurring in online spaces, particularly those offenses that target computer systems or personal data (Brewer et al. Citation2019). The online environment complicates the process of detecting offending, identifying the responsible actors, and effectively messaging laws related to cybercrimes (Brewer et al. Citation2019; Grimes Citation2012; Newman and Clarke Citation2003). These issues limit the utility of prosecutions at the local, federal, or national level as a deterrent as well (Holt, Brewer, and Goldsmith Citation2019; Payne, Hawkins, and Xin Citation2019; Payne, May, and Hadzhidimova Citation2019). These issues are evident in cases of computer hacking, malicious software operations, and other so-called cybercrime-as-service tools, where individuals are paid for access to various services that enable attacks against computer systems and data (Brewer et al. Citation2019, Holt and Bossler Citation2015; Holt, Smirnova, and Chua Citation2016).
These factors likely create conditions where the perceived and real revenues and profits generated from cybercrime may be greater than any risks presented from formal sources of control (Holt and Dupont Citation2019; Holt, Smirnova, and Chua Citation2016; Konradt, Schilling, and Werners Citation2016; Leukfeldt, Kleemans, and Stol Citation2017). Economically motivated cybercrimes, such as hacking, phishing, and related forms of fraud allow offenders to generate substantive profits, and frequently use them to purchase clothes, luxury cars, drugs, and alcohol, similar to traditional street criminals (Kruisbergen et al. Citation2019; Leukfeldt and Holt Citation2022; Lusthaus Citation2018). They may also utilize these funds to expand or maintain their infrastructure in order to continue their operations (Collier et al. Citation2021; Hutchings and Clayton Citation2016)
Though research on the revenue and practices of cybercriminals have increased, there has been less focus placed on individuals operating various tools and attack resources on a fee-for-service model (see Holt Citation2023; Mirian Citation2019). One of the most prominent services in this space over the last decade are so-called “stresser” or “booter” services that offer distributed reflective denial of service (DRDoS) attacks for a fee (Hutchings and Clayton Citation2016; Karami and McCoy Citation2013, Rossow and Gortz Citation2014; Santanna et al. Citation2015). These services allow individuals to execute high-volume distributed denial of service attacks (DDoS), rendering websites, gaming servers, and other online services unusable to others (Hutchings and Clayton Citation2016; Hyslip and Holt Citation2019; Santanna et al. Citation2015). Booter and stresser-based attacks are very costly for targets based on lost revenue from site and service downtime, as well as reduced customer confidence in their capacity to defend against cyberattacks (Moneva and Leukfeldt Citation2023).
Booter and stresser operations gained attention from researchers and law enforcement due to the high volume of traffic that can be generated at a very low cost to users, with essentially no technical expertise required (Hutchings and Clayton Citation2016; Hyslip and Holt Citation2019; Moneva and Leukfeldt Citation2023). An attacker needs only identify a service provider, register with the site, pay their subscription fee, and know the target IP address they intend to harm (Collier et al. Citation2019, Holt et al. Citation2023; Hyslip and Holt Citation2019; Karami and McCoy Citation2013). The technical aspects of the attack are managed by the attack service provider, who directs malformed or malicious traffic in milliseconds to the targeted server or network, rendering the platform inoperative to all parties until the traffic ceases (see Hutchings and Clayton Citation2016; Hyslip and Holt Citation2019).
Several studies have examined the experiences of booter and stresser operations, noting that they appear to be driven by young males who may be less technically sophisticated relative to other hackers (Hutchings and Clayton Citation2016; Hyslip and Holt Citation2019). The cost of these services also appears relatively low, with prior studies noting prices from less than one dollar to the mid-teens in US currency (Hutchings and Clayton Citation2016; Hyslip and Holt Citation2019). Despite their simplicity and low cost, vendors note that they must spend time maintaining their infrastructure to ensure it is operational and secure it from law enforcement and cybersecurity interventions (Collier et al. Citation2021; Hutchings and Clayton Citation2016).
Booter and stresser operations have been subject to frequent disruption over the last few years, whether from financial service providers who reject payments from customers (Holt et al. Citation2023; Karami and McCoy Citation2013), or search engine operators who have begun to present warning banners to individuals searching for these services (Collier et al. Citation2019; Moneva and Leukfeldt Citation2023). Additionally, a series of arrests occurred across the US and Europe during 2018 and 2019 that targeted booter operators and hundreds of their clients (Collier et al. Citation2019; Krebs Citation2018). Researchers note that booter services persist despite these risks, engaging in restrictive deterrence strategies to minimize the likelihood of detection and harm. For instance, booters now accept cryptocurrencies and have changed their preferred communications platforms, as well as increased the range of attack protocols available to customers (Holt et al. Citation2023).
To date, no research has empirically examined the ways in which pricing models and revenues for booters and stressers have changed relative to the increased risks they face from formal and informal sources of control. To address this gap in the literature, this study utilized a sample of 42 booter and stresser sites collected after the law enforcement actions of 2019 in order to assess the estimated revenues made by operators based on the subscription types observed and customer bases reported by vendors (see for list of vendors). The implications of this analysis for our understanding of the revenue generated by cybercrime-as-service providers and our broader understanding of the risks and rewards of cybercrime are discussed in detail.
Table 1. Booter and stresser sample (N = 44).
Assessing the economics of booter and stresser services
Examinations of booter and stresser service providers note that they are primarily motivated by a desire to make money (Hutchings and Clayton Citation2016; Holt et al. Citation2023). The operators may not be as technically skilled as others within the broader landscape of criminal and non-deviant hackers (Collier et al. Citation2021). They are typically younger people building their skills, who may have been coopted into booter and stresser operations in support functions through consistent use of a service and communication with the operating team (Hutchings and Clayton Citation2016; Hyslip and Holt Citation2018). As a consequence, the experience of profiting from cybercrime may be novel, and attractive to those involved due to the perceived risks and thrills associated with criminality in general (Hutchings and Clayton Citation2016).
Running a booter service is not easy work, and requires a degree of time and effort to maintain its effectiveness as an attack tool. Some service providers feel the work is tedious and boring, which can make it less appealing to perform over time (Collier et al. Citation2021). Such effort is needed, however, as the quality of service directly impacts the operator’s potential profit margin. Any failed attacks will lead customers to move to competing services due to complaints (Hyslip and Holt Citation2018). Should there be an unexpected increase in customers or the number of attacks originating from the service infrastructure may also make it unstable, thereby affecting customer satisfaction. Operators must also take steps to secure their infrastructure from law enforcement intervention and ensure timely payment processing, which also affects the perceived legitimacy of the service (Collier et al. Citation2021; Hutchings and Clayton Citation2016).
While booter operations may be time consuming and present risks to the operators, it is unclear what sorts of profits may be made from their operations in order to justify continued involvement in this form of crime. Estimating the revenues and profits of booters and stressers is complicated by the nature of the operations themselves. First, the pricing models are somewhat inconsistent across vendors (Hutchings and Clayton Citation2016, Holt et al. Citation2023; Hyslip and Holt Citation2019; Karami and McCoy Citation2013). Booters typically offer their services on a subscription basis, wherein customers pay for access to attacks based on the number and types of attacks that can be performed using a specific amount of bandwidth over a certain length of time (Collier et al. Citation2019; Hyslip and Holt Citation2019; Karami and McCoy Citation2013). The price can vary widely based on the length with which users subscribe, and the attacks they choose to perform (see Hyslip and Holt Citation2019). Attack subscriptions can last days, weeks, or months based on operator preferences, though it is unknown as to which subscription lengths customers typically choose or the extent to which they utilize attacks during this time (Holt et al. Citation2023).
Booter and stresser services also differ in the number of clients they may have who use their services at any given time (Hutchings and Clayton Citation2016). The number of registered users relative to actual paying customers is inconsistently reported by vendors (Holt et al. Citation2023). Additionally, vendors may not provide the total number of attacks that originate from their services at any point in time. Without this information, it is difficult to understand the scope and activity of a given vendor. For instance, a relatively well-known service called “webstresser.org” had more than 151,000 registered users and was suspected to have launched over four million attacks during a three-year period (Krebs Citation2018). Such a large client base is uncommon, as studies have noted vendors having as few as 20 and over 28,000 clients over time (Hutchings and Clayton Citation2016).
An additional challenge to any booter revenues estimate lies in the fact that most research has used either attack traffic from stresser operations (e.g. Hyslip and Holt Citation2019; Karimi et al. Citation2015), interviews with booters (Hutchings and Clayton Citation2016), data from customers (Collier et al. Citation2021; Hyslip and Holt Citation2018), or website data in order to understand their practices (Holt et al. Citation2023). The lack of uniform data and overall small number of studies makes it difficult to properly measure the scope of the market. As an example, Karami and McCoy (Citation2013) estimated the income from a single booter operating in 2013 to be $7,727 a month based on publicly provided information on the total number of subscribers and the average monthly subscription cost.
To date, one study attempted to estimate the potential profits of booter services providers using a mixed methods approach (Hutchings and Clayton Citation2016). Utilizing interviews with booters as well as advertisements from 63 sites, Hutchings and Clayton (Citation2016) found two booters self-reported earning hundreds of dollars a day. Respondents were also asked to estimate the total number of attacks they performed on average in one month, which generated substantive variation in reported totals. Booters reported running 171,713 attacks on average, creating an average estimate of 1,590 hours of attack traffic. The average customer base across all seven respondents in their sample population was 5,018 total, suggesting a relatively small user base relative to public reporting.
These estimates were then coupled with the advertised cost per subscription from a total of 63 booter and stresser sites running at that time (Hutchings and Clayton Citation2016). They found a range of pricing, with costs from 19 cents to $14.99, with an average of $4.00 per subscription and a confidence interval of $3.71 to $5.43 per account. The authors then multiplied this estimate by the average number of accounts reported by six of their sample of booter operators, which was 1,000 customers. Using this model, Hutchings and Clayton (Citation2016) estimated that booters earned between $3,705.25 and $5,430.67 per month.
The estimate provided by Hutchings and Clayton (Citation2016) is instructive and suggests booter operations could generate a reasonable wage over a 12-month period. The funds generated from running such a service could be particularly attractive to the young men who become involved in booters and stressers (Hutchings and Clayton Citation2016). At the same time, Hutchings and Clayton (Citation2016) conducted their analysis using data from 2015, which may not be applicable to the current landscape of booter and stresser operations. Escalating efforts by law enforcement agencies and payment processors has increased the risk of both running and using booter services (Holt et al. Citation2023; Moneva and Leukfeldt Citation2023). Additionally, the methods required to affect certain targets have changed, requiring a greater range of attack protocols to be available to ensure effective disruption of targets (Holt et al. Citation2023).
Though financial gain is the primary motive for running these services, it is unclear how much money may be earned and if there is any change in revenues since prior estimates were developed. Additionally, vendors do not always successfully facilitate attacks against their targets calling to question whether booter services are accurate when advertising their services (see Hyslip and Holt Citation2019; Mirian Citation2019). This study attempts to address this question through a quantitative analysis of 42 booter and stresser service providers collected in the wake of direct formal and informal interventions to disrupt their operations. The findings can improve our understanding of the fundamental incentives for engaging in cybercrime-as-a-service market generally.
Data and methods
The current study analyzed a sample of 42 English-language vendors offering booter or stresser services on the Open Web (see for details). Data collection took place over 13-months from January 2019 to February 2020 to ensure the greatest number of service providers operating in the wake of law enforcement takedowns were captured (Collier et al. Citation2019; Krebs Citation2018). Sites were identified through search protocols on various web browsers using combination of the following keywords: booter, stresser, service, pay btc, paypal. These words were selected because prior research utilized similar keywords to develop their samples, as booter and stresser services utilize plain language in their websites to attract customers and use common payment platforms to facilitate customer payments (Hutchings and Clayton Citation2016; Hyslip and Holt Citation2019). Additionally, evidence suggests that the overwhelming majority of stressers operate on the Open Web, making them easy to identify through simplistic keyword searches (Holt et al. Citation2023; Hutchings and Clayton Citation2016). Thus, it is likely that none of the vendors in this sample were used for legitimate stress testing in keeping with prior research on booters and stresser services generally.
A total of 48 vendors were initially identified, though four of these services did not appear to be active or operational at the time of data collection. These four vendors were excluded from the final sample since they did not allow users to create an account or provide information on payment for services. The researchers also attempted to identify vendors advertising via Dark Web platforms, though no stand-alone service providers could be identified through various search terms. Additionally, none of the vendors included in the final sample operated login platforms or granted access to their services via Dark Web links. As a result, this study provides a purposive sample of Open Web service providers offering cybercrime-as-service attacks.
The data set was compiled by saving all pages from each vendor’s website as HTML files for analysis. The text and images present in each website were then read and coded by hand for analysis (see also Aldridge and Askew Citation2017; Copeland et al. Citation2019). A case study design was employed to consider the practices of both vendors and their customers based on the language provided in their advertisements, as well as any images posted for products (see also Aldridge and Askew Citation2017; Copeland et al. Citation2019; Holt et al. Citation2023; Hutchings and Holt Citation2015).
Prior research attempting to estimate the profits of cybercrime as service markets utilized both the advertised price for products and customer feedback as a proxy for vendor reliability (Holt et al. Citation2016; Hutchings and Clayton Citation2016). Such information is helpful given the potential that individuals may sell data of generally low quality that is unusable by a customer (Holt et al. Citation2016). However, such information is not necessary for stresser and booter services, given that customers must pay upfront for a subscription to use any service. As a result, the vendor is able to retain and use those funds regardless of the usability of their services (Hyslip and Holt Citation2019). Further, no feedback was provided by vendors in their ads or webpage content for use in this analysis.
Given the simplified nature of this model, the following equation was used to estimate the revenues for booter and stresser operators in keeping with prior research (Hutchings and Clayton Citation2016; Karimi et al. Citation2015):
In this equation, li represents the proportion of clients choosing a specific level of service (e.g. bronze, silver, or gold); pl represents the corresponding average price at a given subscription level; and ci stands for the average number of clients. Hence, the price level was linked to a specific price and a proportion of clients (ci) who will pay this price. The total seller revenues were summed to reflect overall price levels. Given that it is unknown how many customers may have actually paid rather than simply registered with the site, this number was decreased by 50% to provide a more conservative estimate of revenues.
Though a proportion of vendors provided information on their customer base, none gave information on the subscription level they purchased. Prior research notes that subscription models for booters and stressers vary, and are typically based on the length of subscription and volume of attacks (Hutchings and Clayton Citation2016; Hyslip and Holt Citation2019; Karami and McCoy Citation2013). In this data set, several vendors utilized the term “tier” to refer to the different subscription models available to potential customers, with unique verbiage to identify each subscription package. Thus, this analysis utilizes the term tier to refer to different subscription models offered by vendors, and the most common tiers used by vendors: bronze, silver, and gold.
It was necessary to estimate the proportion of clients choosing a specific level of service (li), identify the most common levels of service (gold, silver, and bronze) and corresponding average prices for them (pl), and the average number of clients (ci). There is generally little research identifying the extent to which booter and stresser customers purchase specific attack packages, though it is feasible that they may not initially pay for high tier subscriptions if they have never used the service before. Three different distribution tiers were created for three different price levels to split customers to reflect different subscription tiers (see ). The first assumes 80% of customers paid at the lowest subscription levels, 15% used the medium level, and 5% at the highest level of service. Distribution 2 is even more conservative and assumes 90% of clients paid for the lower price levels, while 7.5% used silver, and 2.5% at gold. Distribution 3 was split equally across all three levels to provide a comparison of equal distribution of price tiers without any assumptions.
Table 2. Distributions for three prices levels.
The price levels were coded across all vendors as the majority of service providers had a clearly tiered subscription model differing by attack protocols available for use, number of attacks, and length of subscription. In fact, 34 providers based their models around hourly (n = 2), weekly (n = 5), monthly (n = 30) and lifetime (n = 23) subscriptions; lifetime and monthly subscriptions were offered simultaneously in most instances (see Hyslip and Holt Citation2019). Two vendors provided customers with a sliding scale pricing scheme that could differ based on attack length, protocols used, and other factors. Since price levels were reported for different time frame, we transformed all hourly, weekly, and multiple months, and years prices into monthly prices using a 30-day time frame, essentially synodic month. Hourly prices were multiplied by 720 (24 × 30) hours to arrive at a one-month rate. Weekly prices used an average approximation of 4.29 (30/7) weeks per month. Multiple month and yearly pricing were divided by 3 or 12 to create a single month average rate. Since it was not possible to identify the true duration of a lifetime subscription, they were treated separately from monthly figures.
Assessing the characteristics of vendors
Examining the basic pricing and customer information provided by vendors illustrates their basic operating tiers and potential profitability. Among 44 vendors, two (n = 2) vendors did not have any pricing information posted publicly; hence our sample includes 42 vendors with pricing detail, 447 different price points were recorded. About 71% of vendors (n = 30) listed monthly prices, 55% (n = 23) used lifetime pricing, and 45% (n = 19) had both monthly and lifetime prices available (see ). Some vendors used sliding scales that were captured to the extent possible in this analysis. Complicated price schemes need further research as they may indicate either the sophistication of the vendor or the potential for poor service as it may be difficult to keep different pricing schemes and service levels consistent for multiple clients.
Figure 1. Box plots for monthly and lifetime price levels.
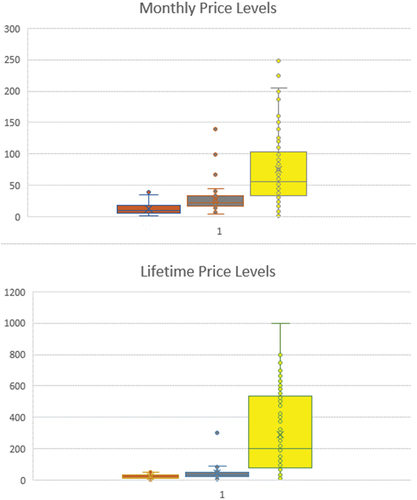
Trial and test services offered by vendors were free as means of attracting and verifying service quality (Hutchings and Clayton Citation2016; Hyslip and Holt Citation2019), and were excluded from these calculations. Maximum prices were also excluded so as to minimize any skew in the models due to one vendor ad. All time-bound prices (e.g. weekly, quarterly, bi-annual, etc.) were transformed into monthly prices as the most common prices among vendors.
In addition to pricing, many of the vendors in this sample (n = 26) noted the size of their client or subscriber base. This sample suggests the booter and stresser service community is still operational despite the heightened risk of arrest. At the same time, it was not always clear if the number reflected the total number of clients online at any time, or over the vendor’s lifetime. There was variation in the ways this information was reported, as 26 vendors indicated their total number of clients, while 21 indicated both their number of clients and the number of attacks they performed. Two vendors only indicated the number of attacks performed.
Within this sample, three of the 26 vendors (11.5%) reported having hundreds of customers; nine (34.6%) had thousands of customers; and six (23.1%) reported tens of thousands of total customers. Three vendors (11.5%) noted more than 100,000 total clients, with the maximum being 301,097. In addition, 19 vendors (73.1%) noted the total number of attacks performed, though it was sometimes unclear as to whether the figure reflected attacks running live at that time, or over the lifetime of the service provider. To that end, four vendors (15.4%) reported having run millions of attacks in their lifetime. As a result, this sample reflected a range of booter and stresser operations that remained active in the wake of law enforcement actions.
The number of attacks were inconsistently reported, as two indicated the total number of attacks occurring at that time, two reported the operator’s lifetime number of attacks, while 14 noted their all-time attack totals. One vendor reported the number of attacks running, while three indicated how many were running today, and only one indicated their number of attacks for the week. To be consistent with pricing, the number of attacks was transformed into a monthly figure.
To calculate the potential aggregate revenues, the average and median number of clients were used separately in conjunction with the lifetime and monthly price points. shows the key summary distribution for lifetime and monthly clients at a minimum, 1st quartile, median, 3rd quartile, average, and maximum levels. Seven vendors indicated that they serviced between 211 (minimum) and 1491 (1st quartile) clients. Six vendors indicated that they serviced between the 1st quartile and median, and another six between median and the 3rd quartile. There were three vendors indicating prices between 3rd quartile and average. The averages were highly skewed by the maximum number of 301,097.
Table 3. Number of clients for lifetime and monthly pricing schemes.
The number of individual clients could not be separated into monthly or lifetime subscriptions for those vendors who indicated that they provided both service tiers. To calculate revenues for vendors who indicated both lifetime and monthly calculations, it was assumed that 65% of clients were monthly subscribers and 35% were lifetime subscribers. This figure was based on the number of vendors reporting these subscription tiers in the sample.
Results
Using the equation described above and the information from vendors, it is possible to estimate the potential revenues of booter and stresser operations. summarizes this information using median prices and median number of clients. Part A utilized the lifetime median number of clients for revenue calculations, while Part B showed price calculations with the monthly median number of clients. This analysis focused on the median and average prices without the maximum prices included since the distributions were skewed.
Table 4. The estimated aggregate revenues for median levels, excluding maximum prices.
The results for pricing using the median for lifetime pricing demonstrated substantial revenues for vendors (see ). Using the most conservative estimate of customers at the bronze tier suggests that vendors earned $67,521, while the revenues grew substantially with a more liberal estimate of customers across all tiers. The comparative revenue models are lower when using monthly pricing (see ). In effect, vendors make slightly less at the most conservative tier, while they make half the revenue noted when using lifetime pricing.
reported similar calculations with the aggregate average revenues instead of the median values. These calculations highlight the massive revenues and potential profits vendors may earn even when using the most conservative estimate for customers at the bronze tier. In the case of lifetime prices, vendors may have generated $678,605, and as much as $2 million when using a more liberal customer distribution (see ). The revenues are lower when using monthly pricing, however vendors stood to earn hundreds of thousands of dollars depending on the distribution of customers across the operational tiers (see ).
Table 5. The estimated aggregate revenues for averages.
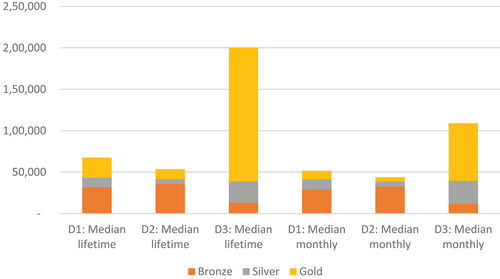
The revenues for each distribution with median and average fees were depicted in . The figure shows how distributions of clients affect the overall estimates for either lifetime or monthly prices. A third of clients selecting the highest paying level would bring the most revenue (Distribution 3 (D3)), while having the smallest percentage of highest paying customers (e.g. 2.5% as in Distribution 2 (D2)) brings down the revenue estimates. The difference in distributions shows that the revenues can be driven by either the number of clients or the prices.
Figure 2. The effect of distributions on lifetime and monthly revenues from each level.
Given the variations in potential subscription model adoption across booter users, estimates for revenues were developed based on different combinations of lifetime and monthly subscriptions using one full year of monthly subscriptions (see and see ). A range of combinations were developed starting at just 5% of lifetime subscribers and 95% monthly subscribers and going up to 45% of lifetime subscribers and 55% of monthly subscribers. Additionally, the median and average pricing models were used in each row of the table. The results demonstrated that a range of revenues were possible, with the most conservative estimate of lifetime to monthly subscribers could generate between $592,238 and more than $10 million. The highest range of revenues may be unreasonable given they vary between $6 million and $10 million, though even the lowest tiers suggested booter operations are extremely lucrative.
Table 6. Total revenues by distribution of price levels and different combinations of lifetime and monthly prices.
This finding is reinforced by the estimates for individual operator revenues across the 42 vendors in the sample (see ). Using the median, individual operators could earn as little as $8,841 or as much as $29,836 depending on the breakdown of customer subscription models. Profits were far higher when using the average pricing estimates, with earnings between $59,840 and over $238,000. Though it is difficult to identify the exact revenues made by each vendor, these estimates are far higher than prior estimates in academic research (Hutchings and Clayton Citation2016). As a result, booter and stresser operations may be sufficiently profitable to draw others into the business (Hutchings and Clayton Citation2016).
Table 7. Revenues per vendor (n = 42) by distribution of price levels and different combinations of lifetime and monthly prices.
Discussion and conclusions
Research on cybercrimes demonstrates that offenders are able to generate substantive revenues from their use of specific forms of computer hacking, phishing, and fraud (Holt, Smirnova, and Chua Citation2016; Leukfeldt and Holt Citation2022; Lusthaus Citation2018). Less research has considered the potential revenues generated by individuals operating cybercrime-as-service operations, particularly booter and stresser services that facilitate distributed denial of service attacks (DDoS) on demand (Hutchings and Clayton Citation2016. Evidence suggests that stresser services are profitable for the operators, though they require substantive investments of time to maintain (Collier et al. Citation2021). Additionally, booters and stressers have become a target for law enforcement due to their use in large-scale attacks against government and industry targets (Moneva and Leukfeldt Citation2023). It is unclear how much money booter operators may currently generate, and if it is substantial enough to offset the potential risk of legal sanctions.
To address this question, a quantitative exploration was performed using the publicly accessible information associated with 42 English-language booter and stresser services in operation during 2019 and 2020. This period followed a series of highly publicized legal crackdowns in the US and Europe, and provided a useful sample to understand the potential revenues generated by their operation (Krebs Citation2018; Moneva and Leukfeldt Citation2023). The findings demonstrate that individuals running booter and stressers may have generated substantial revenues and profits through their service platforms. Operators appeared to have earned tens of thousands of dollars or more, which is higher than prior estimates for these services (Hutchings and Clayton Citation2016). The findings of this analysis may be more reflective of the actual state of market operations, as prior estimates were based on pricing data from vendor websites operating in the early 2010s prior to major law enforcement takedowns (Hutchings and Clayton Citation2016). This analysis controls for both self-reported customer numbers and attack traffic, which was not observed in prior studies. Additionally, such estimates would also be in line with prior research suggesting that cybercrime service providers generate sufficient revenue so as to justify the time they must spend to maintain their infrastructure (Anderson et al. Citation2013; Collier et al. Citation2021).
The range of revenue estimates also reflected a change in the pricing models for services compared to prior studies on booter and stresser operations (see Hutchings and Clayton Citation2016; Hyslip and Holt Citation2019). Though prior studies noted differences in the price of attack subscriptions, the estimates here are far wider with fewer service providers offering free tests (Holt et al. Citation2023). It is unclear if this is a reflection of the need to increase revenue given a rise in law enforcement crackdowns. Additionally, it is unclear if the price variations are indicative of changes in the quality or reliability of services. Since vendors reap direct profit regardless of whether their services are functional, customers face major risks in these transactions as there is no recourse if they are cheated by a booter or stresser (Hyslip and Holt Citation2019). Thus, further study is needed to address this question, assessing both the perceptions of operators and their customers (Hyslip and Holt Citation2019).
Furthermore, this study demonstrates that cybercrime-as-service operations can be inherently profitable for the operators despite the challenges evident in maintaining its functionality (see also Holt, Smirnova, and Chua Citation2016). Booter and stresser services also generate far more in revenue in a single month than traditional street crimes, such as burglary and robbery (Stevenson, Forsythe, and Weatherburn Citation2001). This may account for the persistence of booter and stresser services despite the perceived risk of arrest or prosecution. The revenues and profits generated may substantially offset any formal sanctions, as prior research noted that vendors were more concerned by attempts to disrupt their ability to receive payments than of law enforcement interventions (Hutchings and Clayton Citation2016; Karami, Park, and McCoy Citation2015).
As such, law enforcement agencies may find greater value in targeting payment platforms and accounts used by booter and stresser operators rather than in attempts to arrest operators or their customers (Hutchings and Clayton Citation2016; Karami, Park, and McCoy Citation2015). Cutting off access to payment platforms would be destabilizing to a majority of vendors simultaneously, compared to legal actions against a handful of actors. Furthermore, limiting vendors’ access to funds will impact their ability to operate and cause downtime while they reorganized and seek alternative payment platforms (Holt et al. Citation2023; Karami, Park, and McCoy Citation2015). Thus, police agencies and financial service providers should place an emphasis on multi-pronged disruption techniques to affect booter and stresser operations in ways that may produce a longer term deterrent effect on their capabilities compared to traditional models of arrest actions only (Karami, Park, and McCoy Citation2015).
This study also demonstrates the challenge of estimating the revenue and profit models for booters and stressers. The range of subscription models, coupled with the lack of information regarding the number of customers within each tier makes it difficult to calculate the base pay rates they may receive. Similar challenges have been observed in prior attempts to estimate the profits of booter and stresser operations (Hutchings and Clayton Citation2016), as well as stolen data customers and vendors (Holt, Smirnova, and Chua Citation2016). The same issues are evident in analyses attempting to estimate the profits of traditional forms of economically-motivated crime, particularly burglary and shoplifting (Clare et al. Citation2024; Schneider Citation2005; Stevenson, Forsythe, and Weatherburn Citation2001; Wright and Decker Citation1994) which has depended largely on qualitative interviews with offenders to consider their income.
Additional research is needed to clarify the potential profits of vendors through survey or qualitative studies of operators (Collier et al. Citation2021). Specifically, revenue estimates can be improved by identifying the prices paid by customers relative to the services performed and the costs associated with operating a stresser service. This information can be obtained in close collaboration with law enforcement and/or major potential targets using either obtained data from closed services or experimental design studies. For example, Mirian and colleagues (Citation2019) noted that scammers frequently take money for illicit online services without actually delivering product. Such scamming activities can generate easy profits with minimal cost and very low probability of law enforcement sanctions. Thus, inquiry is needed to understand the scope of legitimate and illegitimate vendors operating within the market.
Though this exploratory study provides useful insights into the overall economy for booter and stresser services, there are clear limitations that must be addressed. First, this study was based on the advertised prices for services and may not reflect any discounts or rate changes offered to registered paying customers. Furthermore, we are unable to assess the quality of the services offered. Prior studies of booter services noted that price was not reflective of the efficacy of DDoS attacks (see Hyslip and Holt Citation2019) calling to question whether the extremes observed may actually be associated with low quality service providers.
In addition, these revenue estimates cannot account for the number of individuals who may be involved in the operation of a given booter or stresser service. It is unclear how many individuals may be necessary to maintain a booter service, thus it is possible that the revenues may have to be split across a team of individuals (Collier et al. Citation2021). The same is true for the challenge of understanding the costs associated with the maintenance and management of booter services (see Collier et al. Citation2021). Prior studies note the time required to maintain these services, though it is unclear how this information may be used to calculate a per-hour profit estimate or return on investment framework. Further study is needed to develop such insights, which would provide a more nuanced understanding of the reasons why individuals continue to engage in cybercrime for profit.
Disclosure statement
No potential conflict of interest was reported by the author(s).
Additional information
Funding
Notes on contributors
Olga Smirnova
Olga V. Smirnova is a Professor at the MPA program, the Department of Political Science, East Carolina University. Her research interests include social network analysis, green transportation innovations, contracting out, program evaluation, economic development, and performance measurement.
Thomas J. Holt
Thomas J. Holt is a Professor in the School of Criminal Justice at Michigan State University. His research focuses on computer hacking, malware, and the role of the Internet in facilitating all manner of crime and deviance. He received his PhD from the University of Missouri-St. Louis in 2005.
References
- Aldridge, J., and R. Askew. 2017. “Delivery dilemmas: How drug cryptomarket users identify and seek to reduce their risk of detection by law enforcement.” International Journal of Drug Policy 41: 101–109.
- Anderson, Ross, Chris Barton, Rainer Bohme, Richard Clayton, Michael J.G. van Eeten, Michael Levi, Tyler Moore, and Stefan Savage. 2013. “Measuring the Cost of Cybercrime.” In The Economics of Information Security and Privacy, edited by R. Böhme. Berlin, Heidelberg: Springer. doi:10.1007/978-3-642-39498-0_12.
- Brewer, R., M. de Vel-Palumbo, A. Hutchings, T. Holt, A. Goldsmith, and D. Maimon. 2019. Cybercrime Prevention: Theory and Applications. London: Palgrave MacMillian.
- Clare, J., L. Quinn, N. Gately, and S. Rock. 2024. “Offenders’ perspectives on acquisitive crime targets and sotlen goods disposal methods.” Journal of Criminology.
- Collier, B., R. Clayton, A. Hutchings, and D. Thomas. 2021.“Cybercrime is (often) boring: Infrastructure and alienation in a deviant subculture.“ British Journal of Criminology 61(5): 1407–1423.
- Collier, B., D. R. Thomas, R. Clayton, and A. Hutchings. 2019. “Booting the Booters: Evaluating the Effects of Police Interventions in the Market for Denial-Of-Service Attacks.” Proceedings of the Internet Measurement Conference, October (pp. 50–64).
- Copeland, C., M. Wallin, and T. J., Holt. 2019. “Assessing the practices and products of darkweb firearm vendors.“ Deviant Behavior 41(8): 949–968.
- Grimes, Roger. 2012. “Why Internet Crime Goes Unpunished.” CSO Online. (https://www.csoonline.com/article/548638/cyber-crime-why-internet-crime-goes-unpunished.html)
- Guan, X. and T. W. Lo. 2021. “Restrictive Deterrence in Drug Offenses: A Systematic Review and Meta-Synthesis of Mixed Studies.” Frontiers in Psychology 12: 727142. doi:10.3389/fpsyg.2021.727142.
- Guerette, R. T., and K. J. Bowers. 2009. “Assessing the Extent of Crime Displacement and Diffusion of Benefits: A Review of Situational Crime Prevention Evaluations.” Criminology 47(4): 1331–1368.
- Ho, H., R. Ko, and L. Mazerolle. 2022. “Situational Crime Prevention (SCP) Techniques to Prevent and Control Cybercrimes: A Focused Systematic Review.” Computers & Security 115: 102611. doi:10.1016/j.cose.2022.102611.
- Holt, T. J. 2023. “Understanding the state of criminological scholarship on cybercrimes.” Computers in Human Behavior 139: 107493.
- Holt, T. J., and A. M. Bossler. 2015. Cybercrime in progres: Theory and prevention of technology-enabled offenses. London: Routledge.
- Holt, T. J., R. Brewer, and A. Goldsmith. 2019. “Digital Drift and the ‘Sense of injustice’: Counter-Productive Policing of Youth Cybercrime.” Deviant Behavior 40(9): 1144–56. doi:10.1080/01639625.2018.1472927.
- Holt, T. J., and D. Dupont. 2019. “Exploring the factors associated with rejection from a closed cybercrime community.“ International Journal of Offender Therapy and Comparative Criminology 63(8): 1127–1147.
- Holt, T. J., J. R. Lee, and O. Smirnova. “Exploring risk avoidance practices among on-demand cybercrime-as-service operations.” Crime & Delinquency 69(2): 415–438.
- Holt, T. J., O. Smirnova, and Y. T. Chua. 2016. “Exploring and Estimating the Revenues and Profits of Participants in Stolen Data Markets.” Deviant Behavior 37(4): 353–67. doi:10.1080/01639625.2015.1026766.
- Hutchings, A., and T. J. Holt. 2015. ”A crime script analysis of the online stolen daa market.“ British Journal of Criminology 55(3): 596–614.
- Hutchings, Alice and Richard Clayton. 2016. “Exploring the Provision of Online Booter Services.” Deviant Behavior 37(10): 1163–78. doi:10.1080/01639625.2016.1169829.
- Hyslip, T. S. and T. J. Holt. 2018. “Defining the Profile of Potential Cybercriminals.” The Journal of the Homeland Defense & Security Information Analysis Center 5: 25–31.
- Hyslip, T. S. and T. J. Holt. 2019. “Assessing the Capacity of DrdoS-For-Hire Services in Cybercrime Markets.” Deviant Behavior 40(12): 1609–25. doi:10.1080/01639625.2019.1616489.
- Jacobs, B. A. 1996. “Crack Dealers and Restrictive Deterrence: Identifying Narcs.” Criminology 34(3): 409–31. doi:10.1111/j.1745-9125.1996.tb01213.x.
- Jacobs, B. A. and M. Cherbonneau. 2014. “Auto Theft and Restrictive Deterrence.” Justice Quarterly 31(2): 344–67. doi:10.1080/07418825.2012.660977.
- Karami, M., and D. McCoy. 2013. “Rent to Pwn: Analyzing Commodity Booter DdoS Services.ces.” Login 38: 20–23.
- Karami, M., Y. Park, and D. McCoy. 2015. “Stress Testing the Booters: Understanding and Undermining the Business of DdoS Services.” WWW 2016: 1033–44. April 11-14, 2016 Montreal, Quebec, Canada.
- Kennedy, Kevin 1984. “A Critical Appraisal of Criminal Deterrence Theory.” Dickinson Law Review 88(1): 1983–84.
- Konradt, C., A. Schilling, and B. Werners. 2016. “Phishing: An Economic Analysis of Cybercrime Perpetrators.” Computers & Security 58: 39–46. doi:10.1016/j.cose.2015.12.001.
- Krebs, B. December 20, 2018. “Feds charge three in massive seizure of attack-for-hire services.” Krebs on Security. (https://krebsonsecurity.com/2018/12/feds-charge-three-in-mass-seizure-of-attack-for-hire-services/).
- Kruisbergen, E. W., E. R. Leukfeldt, E. R. Kleemans, and R. A. Roks. 2019. “Money Talks Money Laundering Choices of Organized Crime Offenders in a Digital Age.” Journal of Crime and Justice 42(5): 569–81. doi:10.1080/0735648X.2019.1692420.
- Leukfeldt, E. R. and T. J. Holt. 2022. “Cybercrime on the Menu? Examining Cafeteria-Style Offending Among Financially Motivated Cybercriminals.” Computers in Human Behavior 126: 106979. doi:10.1016/j.chb.2021.106979.
- Leukfeldt, R., E. Kleemans, and W. Stol. 2017. “The Use of Online Crime Markets by Cybercriminal Networks: A View from within.” American Behavioral Scientist 61(11): 1387–402. doi:10.1177/0002764217734267.
- Lusthaus, J. 2018. Industry of Anonymity: Inside the Business of Cybercrime. Boston, MA: Harvard University Press.
- Mirian, A. 2019. “Hack for Hire: Investigating the Emerging Black Market of Retail Email Account Hacking Services.” Queue 17(4): 41–60. doi:10.1145/3358955.3365458.
- Mirian, A., J. DeBlasio, S. Savage, G. M. Voelker, and K. Thomas. 2019. “Hack for Hire: Exploring the Emerging Market for Account Hijacking.” The World Wide Web Conference, May (pp. 1279–89).
- Moneva, A. and R. Leukfeldt. 2023. “The Effect of Online Ad Campaigns on DdoS‐Attacks: A Cross‐National Difference‐In‐Differences Quasi‐Experiment.” Criminology & Public Policy 22(4): 869–94. doi:10.1111/1745-9133.12649.
- Newman, G. R. and R. V. Clarke. 2003. Superhighway Robbery. London: Routledge.
- Paternoster, R., C. M. Jaynes, and T. Wilson. 2017. “Rational Choice Theory and Interest in the “Fortune of others”.” Journal of Research in Crime and Delinquency 54(6): 847–68. doi:10.1177/0022427817707240.
- Payne, B. K., B. Hawkins, and C. Xin. 2019. “Using Labeling Theory As a Guide to Examine the Patterns, Characteristics, and Sanctions Given to Cybercrimes.” American Journal of Criminal Justice 44(2): 230–47. doi:10.1007/s12103-018-9457-3.
- Payne, B., D. C. May, and L. Hadzhidimova. 2019. “America’s Most Wanted Criminals: Comparing Cybercriminals and Traditional Criminals.” Criminal Justice Studies 32(1): 1–15. doi:10.1080/1478601X.2018.1532420.
- Pratt, T. C. 2008. “Rational Choice Theory, Crime Control Policy, and Criminological Relevance.” Criminology & Public Policy 7(1): 43. doi:10.1111/j.1745-9133.2008.00489.x.
- Rossow, C., and H. Gortz. 2014. “Amplification Hell: Revisiting network protocols for DDoS Abuse.” Proceedings of the 2014 Network and Distributed System Security (NDSS) Symposium, San Diego, CA.
- Santanna, Jose Jair, Roland van RiJswijk-Deij, Rick Hofstede, Anna Sperotto, M. Mark Wierbosch, Lisandro Z. Granville, and Aiko Pra. 2015. “Booters - an Analysis of DdoS-As-A-Service Attacks.” 2015 IFIP/IEEE International Symposium on Integrated Network Management, IEEE. 243–51.
- Schneider, F. 2005. “Shadow economies around the world: What do we really known?.” European Journal of Political Economy 21(3): 596–642.
- Stevenson, R. J., L. M. V. Forsythe, and D. Weatherburn. 2001. “The Stolen Goods Market in New South Wales, Australia: An Analysis of Disposal Avenues and Tactics.” British Journal of Criminology 41(1): 101–18. doi:10.1093/bjc/41.1.101.
- Wright, R. T., and S. H. Decker. 1994. Burglars on the job: Streetlife and residential break-ins. Boston, MA: Northeastern University Press.