
Abstract
Background: Paenibacillus larvae is the etiological agent of American foulbrood (AFB), a widespread and severe bacterial brood disease of honey bees. The genomic characterization of P. larvae strains by enterobacterial repetitive intergenic consensus–polymerase chain reaction (ERIC–PCR) is able to differentiate four genotypes (ERIC I, ERIC II, ERIC III, ERIC IV). The information on the presence of P. larvae ERIC genotypes worldwide is few.
Objectives: We have characterized P. larvae strains isolated in Italy from AFB outbreaks to obtain information on ERIC genotypes and phenotypes of the strains circulating in the country.
Methods: A total of 117 P. larvae isolates from 115 AFB outbreaks occurring in 2008–2012 were subjected to phenotypic and genetic characterization.
Results: The genomic characterization allowed the identification of ERIC I and ERIC II genotypes. Examining the data of Northern and Central Italy separately it was noted that in Northern Italy most outbreaks were caused by the ERIC I genotype (78.6%), followed by the ERIC II genotype (18.6%) and by co-infections (ERIC I + ERIC II) (2.6%). In Central Italy, only outbreaks caused by the ERIC I genotype were observed. With regard to phenotypic characteristics all examined strains of ERIC II genotype fermented fructose while no strains of ERIC I genotype possessed this ability.
Conclusion: Both P. larvae ERIC I and ERIC II genotypes were isolated from the AFB outbreaks, but ERIC II genotype was isolated only in Northern Italy. The fermentation of fructose seems to be a genotype-specific biochemical marker.
1. Introduction
American foulbrood (AFB) is a severe and widespread disease affecting the brood of Apis mellifera that causes considerable economic losses, both direct and indirect, to beekeepers worldwide. Paenibacillus larvae, a Gram-positive endospore-forming bacterium, is the causative agent of AFB (Genersch et al. Citation2006). P. larvae appears as an elongated rod which varies greatly in size (0.5 μm wide and 1.5–6 μm long) and it can also be found in chains and filaments. The spores of P. larvae are highly resistant in the environment and to disinfectants, allowing the pathogen to spread readily from one colony to another, especially through robbing and some beekeeping techniques, such as transferring bees and combs among the hives.
Clinically, the disease is characterized by darkened brood combs with a mottled appearance, a sour smell and greasy, sunken and perforated capping wax but the most typical symptom is the transformation of the dead larvae into a ropy mass that forms a characteristic viscous thread if a matchstick is inserted into the cell and then pulled out. If not removed, the infected brood later dries into a blackish scale tightly adhering to the walls of the cells. The larval remains and the scales contain millions of spores and are highly infectious.
P. larvae molecular typization by repetitive element polymerase chain reaction (rep-PCR) using enterobacterial repetitive intergenic consensus (ERIC) primers is able to differentiate four electrophoretic patterns, namely ERIC I–IV (Genersch et al. Citation2006). These genotypes have different phenotypic characteristics, they differ above all in virulence and colony morphology (Genersch et al. Citation2005; Genersch et al. Citation2006). The colonies of ERIC II and ERIC III genotypes are characterized in particular by a typical orange pigmentation that distinguishes them from the other two genotypes (Genersch et al. Citation2006).
With regards to the virulence, ERIC I genotype kills 100% of infected larvae within about 12 days while the other three genotypes are more virulent and kill all infected larvae in about 7 days (Genersch et al. Citation2006). For this reason, the number of larvae that die in capped cells is higher in ERIC I genotype infections than in infections with other genotypes. The adult honey bees can hardly detect and remove the dead larvae in capped cells, hence a large amount of P. larvae spores is produced inside the hive. However, when honey bee larvae die before cell capping, the larvae are easily removed by the bees and the number of P. larvae spores produced inside the hive is lower. In these cases, the disease appears less serious and its course is slower if compared to that from the ERIC I genotype strains (Genersch Citation2010).
An inverse proportion exists between virulence at the larval level and virulence at the colony level: the less virulent strains for the honey bee larvae appear to be the most virulent for the whole colony and vice versa (Rauch et al. Citation2009). The different virulence of P. larvae genotypes can influence some clinical aspects of the disease. In P. larvae ERIC II, ERIC III and ERIC IV genotype infections, the number of darkened, concave and perforated cappings is lower than that observed in ERIC I genotype infections. As a consequence, the clinical diagnosis of the disease is more difficult to make with the risk of overlooking it, especially in the early stages of the disease (Genersch Citation2008, Citation2009). For these reasons, information on the prevalence of P. larvae genotypes present in a specific area is of practical importance in the clinical inspection of the hives.
Epidemiological data on the presence and prevalence of P. larvae ERIC genotypes in various countries are few. The non-pigmented ERIC I genotype may be considered the ‘classic’ P. larvae genotype and causes most probably the majority of the AFB outbreaks worldwide (Genersch Citation2010).
The non-typical pigmented ERIC II genotype is present in Europe and, recently, its presence has been demonstrated also in others continents (Schäfer et al. Citation2014), while ERIC III and ERIC IV genotypes have been isolated only very rarely and therefore have little practical importance (Genersch Citation2010). In Europe, ERIC II genotype has been isolated in Germany and Sweden (Genersch et al. Citation2006), Finland (Pentikäinen et al. Citation2009) and Austria (Loncaric et al. Citation2009) but no more information is known for the other European countries. In this study, P. larvae strains isolated in recent years in Italy from AFB outbreaks were characterized in order to obtain more information on genotypes and phenotypes of the strains circulating in the country.
2. Materials and methods
2.1. P. larvae isolates
A total number of 117 isolates of P. larvae, cultured from 115 AFB different outbreaks [75 located in three regions of Northern Italy (Lombardy, Emilia-Romagna and Trentino Alto-Adige) and 40 in two regions of Central Italy (Tuscany and Lazio)] that occurred during 2008–2012 in Italy, were examined. The 117 isolates were cultured from honey bee broods (103) and from honey (14) collected from the colonies showing clinical symptoms of AFB.
2.2. Microbiological analysis
P. larvae strains isolated from the dead larvae were obtained by directly plating the larval remains taken from affected larvae with a sterile loop on CSA (Columbia sheep blood agar) and MYPGP (Mueller-Hinton broth, yeast extract, potassium phosphate, glucose and pyruvate) agar (Dingmann and Stahly Citation1983) supplemented with nalidixic acid (Hornitzky and Clark Citation1991) and pipemidic acid (Alippi Citation1995). The isolation of P. larvae from the honey samples was performed using the method previously described by Bassi et al. (Citation2010). The primary culture single colonies with a P. larvae-like morphology were tested for catalase reaction. Catalase-negative colonies were Gram stained and the colonies with presence of Gram-positive rods were cultured on TSYEA (tryptic soy yeast extract agar) slant and stored at 0–2 °C for further analysis. When the colony morphology was uniform, only one isolate for each outbreak was characterized, when instead the morphology of P. larvae-like colonies was not uniform, as occurred in two disease outbreaks, one isolate for each morphological type was examined.
2.3. Molecular analysis
All the isolates were definitively identified by PCR and genotyped with rep-PCR using ERIC primers.
2.3.1. PCR identification of P. larvae isolates
Extraction of bacterial DNA of the P. larvae isolates and PCR reaction based on the 16S rRNA gene was performed according to the protocol described by Dobbelaere et al. (Citation2001) with some modification. DNA was extracted by heating at 96 °C for 15 min the bacterial suspension in 500 μL of sterile distilled water and centrifugation at 5000 x g for 10 min at room temperature. The supernatant was used as DNA template in PCR reactions performed in a volume of 25 μL, with 5 μL of template DNA, according to GoTaq ®Hot Start Colorless Master Mix (PROMEGA). Primers AFB-F and AFB-R were added in a final concentration of 0.5 μM each to 12.5 μL of ready to use master mix. The PCR amplification reaction conditions were as follows: initial activation step (2 min, 95 °C), 30 cycles at 94 °C for 1 min, annealing at 60 °C for 30 s, elongation at 72 °C for 60 s and a final elongation step at 72 °C for 5 min. Ten microliters of amplification products were analysed on a 1.8% agarose gel containing SYBR Green (1 X) and visualized on a UV transilluminator.
2.3.2. Rep-PCR with ERIC primers
Preparation of the bacterial DNA and subsequent ERIC–PCR was performed according to the protocol described by Genersch and Otten (Citation2003) with some modifications. In brief, fresh bacterial colonies grown on culture plates were re-suspended in 1000 μL of sterile distilled water and centrifuged at 12000 x g for 1 min. The supernatant was discarded and the pellet was re-suspended in 200 μL of 6% InstaGene matrix (Biorad), incubated at 56 °C for 30 min and stirred at high speed for 10 s, then incubated at 100 °C for 8 min, stirred at high speed for 10 s and centrifuged at 12000 x g for 3 min. Ten microliters of supernatant containing DNA was directly used for PCR or stored at −25 °C. In this case, after thawing, the DNA was stirred at high speed and centrifuged at 12000 x g for 3 min before subjecting to PCR. A PCR reaction was carried out in a final volume of 25 μL according to FastStart Taq DNA Polymerase (Roche), containing 1 x PCR buffer, 2.5 mM MgCl2, 250 μM of each dNTPs, 5 μM of ERIC1R primer (5′-ATGTAAGCTCCTGGGGATTCAC-3′), 5 μM ERIC2 primer (5′- AAGTAAGTGACTGGGGTGAGCG-3′), 5.0 U FastStart Taq DNA polymerase and 10 μL of DNA as template. The amplification conditions were as follows: initial denaturation step (15 min, 95 °C), 50 cycles at 94 °C for 1 min, annealing at 53 °C for 1 min, elongation at 72 °C for 2.5 min and a final elongation step at 72 °C for 10 min. Ten microliters of PCR products were electrophoresed on a 0.8% agarose gel prepared with Pulsed Field Certified Agarose (Bio-Rad) gel in 0.5 X TBE (Sigma) running buffer in the presence of DNA molecular weight marker XVI (Roche) used as a marker. The gel was stained with ethidium bromide (0.5 μg/mL) and visualized on a UV transilluminator.
2.4. Biochemical analysis
Biochemical characterization was performed using the API® 50 CH system (bioMerieux) on cultures obtained on TSYEA after 24 h of incubation at 37 °C in 10% CO2 atmosphere and according to the manufacturer's instructions. The readings of the biochemical reactions were taken after 48–72 h of incubation in 10% CO2 atmosphere at 37 °C. The isolates were not tested with API® 20 E system (bioMérieux), normally used to complete API® 50 CH, because the aim of the test was only to investigate the carbohydrate metabolism profile of P. larvae.
2.5. Statistical analysis
To evaluate the associations between the carbohydrate fermentation and the ERIC genotype, a Fisher's exact test was performed by using R 3.1.1 Software (R Core Team Citation2014).
3. Results
3.1. Microbiological analysis
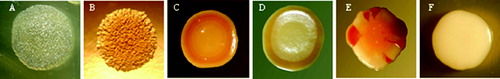
P. larvae colonies showed two different morphotypes. One morph type was attributable to the ‘classic’ colonies of P. larvae ((a), (a) and (b)) while the other morph type showed smooth surface, never transparent, never grainy, with regular margin and orange pigmentation variable in intensity and position (circular or sectoral pigmentation) ((b), (c)–(e)). Frequently, the colonies of this morphotype in first isolation on MYPGP agar were white in colour ((c) and (f)) and only in the subcultures it was possible to observe the pigmented colonies. All the isolates were Gram-positive rods and catalase-negative.
Figure 1. Colonies of P. larvae genotype ERIC I (a) and ERIC II (b) and (c) (photos by Dr Gianluca Rugna).
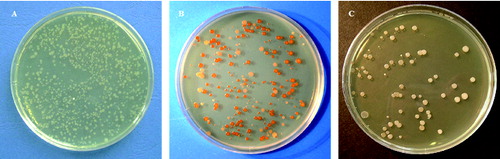
Figure 2. Colonies of P. larvae genotype ERIC I (a) and (b) (photos by Gianluca Paganelli) and genotype ERIC II (c)–(f) (photos by Dr Luca Gelmini).
3.2. Molecular analysis
All of the isolates were confirmed as P. larvae by PCR testing. Genotyping analyses performed in rep-PCR with ERIC primers (ERIC–PCR) allowed the identification of ERIC I or ERIC II genotype according to the specifications reported by Genersch et al. (Citation2006). In particular, the electrophoretic profiles of ERIC I and ERIC II genotypes presented a characteristic band at 970 base pair (bp), which was absent in ERIC III and ERIC IV genotypes, and a band at 2500 bp which was only present in the pigmented strains (ERIC II genotype) (). A total of 101 isolates were identified as ERIC I genotypes, while 16 isolates were identified as ERIC II genotypes. All of the P. larvae isolates with ‘classic’ colony morphology presented an electrophoresis pattern relative to the ERIC I genotype, while all isolates with ‘atypical’ colony morphology showed a profile relative to the ERIC II genotype ().
Figure 3. Electrophoretic pattern of genotypes ERIC I and ERIC II: (+) band migrating at 970 bp (*) band migrating at 2500 bp. In lanes 1 and 10, DNA molecular weight marker XVI (Roche), in lanes 2–4 tested ERIC I field isolates, in lane 5 ERIC I ATCC 9545 reference strain, and in lanes 6–9 tested ERIC II field isolates.
3.3. Biochemical analysis
The metabolic profiles of 60 strains of the ERIC I genotype and of 15 strains of the ERIC II genotype were studied, not for identification purposes but to investigate the presence of any specific biochemical markers for the two P. larvae genotypes. API® 50 CH allows the characterization of the metabolic activity of the microorganism towards 49 different carbon sources (carbohydrates). P. larvae generally shows down the low fermenting activity. In these cases, the results read sometimes lead to dubious interpretations. For this reason, only the results that showed a significantly positive reaction were considered as positive.
contains the results of the tests that showed discrimination between the two genotypes.
Table 1. Fermentation of fructose, mannitol and salicin in ERIC I and ERIC II genotypes of P. larvae strains in Italy.
Fructose always resulted negative in strains of the ERIC I genotype and positive in those of the ERIC II genotype. The mannitol fermentation test was always negative for the ERIC I genotype strains but resulted positive for 13 out of the 15 (86.6%) ERIC II genotype strains. Pigmented strains (ERIC II genotypes) never fermented the salicin, while only 3 out of 60 (5%) ERIC I genotype strains could metabolize it. According to Fisher's exact test performed, a significant association was observed between the ERIC genotype and the fermentation of fructose (p-value = 4.386e-16) and the fermentation of mannitol (p-value = 8.294e-13), respectively. While no significant association was observed between the ERIC genotype and the fermentation of salicin (p-value = 1).
3.4. Epidemiology
The spatial and temporal distributions of the 115 AFB outbreaks are presented in . The outbreaks were grouped according to the P. larvae genotype isolated. Overall, the prevalence of outbreaks caused by P. larvae genotypes ERIC I and ERIC II was 85.5% and 12.7%, respectively. Mixed infections of ERIC I + ERIC II genotypes were found in 1.8% of the outbreaks. Considering the data of Northern and Central Italy separately, it was noted that in Northern Italy the most outbreaks were caused by the ERIC I genotype (78.6%), followed by the ERIC II genotype (18.6%) and by co-infections of the two genotypes (ERIC I + ERIC II) (2.6%), while in Central Italy only outbreaks caused by the ERIC I genotype were observed.
Table 2. Distribution of AFB outbreaks caused by P. larvae ERIC I and ERIC II genotypes in five regions of Northern (a) and Central (b) Italy.
4. Discussion
The results of this study demonstrate that P. larvae ERIC II genotype is present in Italy. The ERIC III and ERIC IV genotypes were ruled out among the strains examined. The electrophoresis profile of strains identified as ERIC II () showed a band at 2500 bp instead of a band ‘around 2800 bp’ as reported previously by Genersch et al. (Citation2006). The different molecular weight of this band is probably due to the distinct electrophoresis conditions applied in the present experiment. In particular, the agarose gels were prepared using Pulsed Field Certified Agarose (Bio-Rad) that performs excellent separation and resolution of large DNA bands, in order to increase the degree of separation among DNA fragments and to better separate the bands in the gel. The results of carbohydrate fermentation tests using the API ® 50 CH system, showed that fructose was a genotype-specific biochemical marker for characterizing P. larvae. According to the results reported by Neuendorf et al. (Citation2004), only the strains of the ERIC II genotype were able to use/ferment this carbohydrate. Similarly, mannitol should be used by the ERIC II genotype strains only and this was observed in 86.6% of our tested strains. Finally, salicin was metabolized by a small percentage (5%) of the ERIC I genotype strains only and never by the ERIC II genotype strains. These results partially differ from those reported by Genersch et al. (Citation2006), because in the strains of the present investigation the fermentation of mannitol for the ERIC II genotype and of salicin for the ERIC I genotype did not consistently result positive. Often salicin fermentation is weak (Heyndrickx et al. Citation1996) and it is not easy to evaluate the colour change of the indicator after the biochemical reaction; for this reason, a reading criterion as severe as the one applied in this study could have lead to discrepancies in the interpretation of the test results compared to other researchers.
From an epidemiological point of view, the results of this study revealed that the P. larvae ERIC II genotype was only isolated in the regions of Northern Italy and was never isolated in regions of Central Italy (). In a previous work carried out in Southern Italy (Apulia Region), all the tested strains of P. larvae showed the ‘typical’ morphology of the classic genotype ERIC I (Di Pinto et al. Citation2011). Therefore, the P. larvae ERIC II genotype, based on the data available up to now, seems to be present in Northern Italy only.
The P. larvae ERIC II genotype has been reported in European countries with extremely variable prevalence. In Finland, the orange pigmented strains are very rare (Pentikäinen et al. Citation2009), in Germany the ERIC II genotype is estimated to be responsible for approximately 25% of the outbreaks (Genersch Citation2009), while in Austria 214 strains isolated from AFB affected broods and honey in all Austrian federal provinces belonged to the ERIC I genotype (58%) and the ERIC II genotype (42%) (Loncaric et al. Citation2009). In Northern Italy, the prevalence of these two genotypes is quite similar to that observed in Germany. Both genotypes were isolated in two AFB affected apiaries: in one case from two colonies of the same apiary, in another case from the same colony. The isolation of P. larvae ERIC I and ERIC II genotypes from dead larvae in the same apiary or in the same colony shows that mixed infections of the two genotypes could occur as already reported by Loncaric et al. (Citation2009) and Peters et al. (Citation2006). The co-infections at the colony level can give rise to different and variable clinical aspects that make AFB diagnosis more difficult.
In conclusion, this study shows that P. larvae genotype ERIC II is indeed present in Northern Italy, where alone or in co-infection with genotype ERIC I it was isolated in about 21% of the AFB outbreaks observed by us in the period 2008–2012. Regarding the phenotypic characteristics between the two genotypes, the fermentation of fructose has showed to have a high discriminatory power, with always positive results in the P. larvae genotype ERIC II and negative in genotype ERIC I strains, respectively.
In order to improve knowledge about the P. larvae genotypes that are present in Italy and to perform accurate epidemiological investigations, further studies using techniques with high discriminatory power and high reproducibility such as, for example, pulsed-field gel electrophoresis would be necessary.
Acknowledgements
The authors wish to thank Dr Adele Pizzuto, Dr Alessandra Giacomelli, Dr Patricia Musiu and Mrs Roberta Giannasi for technical assistance. In addition, they wish to thank Dr Giorgio Galletti for statistical analysis.
Disclosure statement
None of the authors has any financial or personal relationships that could inappropriately influence or bias the content of the paper.
References
- Alippi AM. 1995. Detection of Bacillus larvae spores in Argentinean honeys by using a semi-selective medium. Microbiologia. 11:343–350.
- Bassi S, Carra E, Carpana E, Paganelli GL, Pongolini S. 2010. A scientific note on the detection of spores of Paenibacillus larvae in naturally and artificially contaminated honey: comparison of cultural and molecular methods. Apidologie. 41:425–427.
- Dingmann DW, Stahly DP. 1983. Medium promoting sporulation of Bacillus larvae and metabolism of medium components. Appl Environ Microbiol. 46:860–869.
- Di Pinto A, Novello L, Terio V, Tantillo G. 2011. ERIC-PCR genotyping of Paenibacillus larvae in southern Italian honey and brood combs. Curr Microbiol. 63:416–419.
- Dobbelaere W, de Graaf DC, Peeters JE, Jacobs FJ. 2001. Development of a fast and reliable diagnostic method for American foulbrood disease (Paenibacillus larvae subsp. larvae) using a 16S rRNA gene based PCR. Apidologie. 32:363–370.
- Genersch E. 2008. Paenibacillus larvae and American Foulbrood – long since known and still surprising. J Verbr Lebensm. 3:429–434.
- Genersch E. 2009. Amerikanische Faulbrut: oft anders als im Lehrbuch. Deutsches Bienen-Journal. 8:4–6.
- Genersch E. 2010. American foulbrood in honeybees and its causative agent, Paenibacillus larvae. J Invert Pathol. 103:10–19.
- Genersch E, Ashiralieva A, Fries I. 2005. Strain- and genotype-specific differences in virulence of Paenibacillus larvae subsp. larvae, a bacterial pathogen causing American foulbrood disease in honeybees. Appl Environ Microbiol. 71:7551–7555.
- Genersch E, Forsgren E, Pentikäinen J, Ashiralieva A, Rauch S, Kilwinski J, Fries I. 2006. Reclassification of Paenibacillus larvae subsp. pulvifaciens and Paenibacillus larvae subsp. larvae as Paenibacillus larvae without subspecies classification. Int J Syst Evol Microbiol. 56:501–511.
- Genersch E, Otten C. 2003. The use of repetitive element PCR fingerprinting (rep-PCR) for genetic subtyping of German field isolates of Paenibacillus larvae subsp. larvae. Apidologie. 34:195—206.
- Hornitzky, M.A.Z., Clark, S. 1991. Culture of Bacillus larvae from bulk honey samples for the detection of American foulbrood. J Apic Res. 30:13–16.
- Heyndrickx M, Vandemeulebroecke K, Hoste B, Janssen P, Kersters K, De Vos P, Logan NA, Ali N, Berkeley R. 1996. Reclassification of Paenibacillus (formerly Bacillus) pulvifaciens (Nakamura 1984) Ash et al. 1994, a later subjective synonym of Paenibacillus (formerly Bacillus) larvae (White 1906) Ash et al. 1994, as a subspecies of P. larvae, with emended descriptions of P. larvae as P. larvae subsp. larvae and P. larvae subsp. pulvifaciens. Int J Syst Bacteriol. 46:270–279.
- Loncaric I, Derakhshifar I, Oberlerchner JT, Köglberger H, Moosbeckhofer R. 2009. Genetic diversity among isolates of Paenibacillus larvae from Austria. J Invert Pathol. 100:44–46.
- Neuendorf S, Hedtke K, Tangen G, Genersch E. 2004. Biochemical characterization of different genotypes of Paenibacillus larvae subsp. larvae, a honey bee bacterial pathogen. Microbiology. 150:2381–2390.
- Pentikäinen J, Kalliainen E, Pelkonen S. 2009. Molecular epidemiology of Paenibacillus larvae infection in Finland. Apidologie. 40:73–81.
- Peters M, Kilwinski J, Beringhoff A, Reckling D, Genersch E. 2006. American foulbrood of the honey bee: occurrence and distribution of different genotypes of Paenibacillus larvae in the administrative district of Arnsberg (North Rhine-Westphalia). J Vet Med B. 53:100–104.
- Rauch S, Ashiralieva A, Hedtke K, Genersch E. 2009. Negative correlation between individual-insect-level virulence and colony-level virulence of Paenibacillus larvae, the etiological agent of American foulbrood of honeybees. Appl Environ Microbiol. 75:3344–3347.
- R Core Team. 2014. R: a language and environment for statistical computing R Foundation for statistical computing. Vienna. Available from: http://www.R-project.org/.
- Schäfer MO, Genersch E, Fünfhaus A, Poppinga L, Formella N, Bettin B, Karger A. 2014. Rapid identification of differentially virulent genotypes of Paenibacillus larvae, the causative organism of American foulbrood of honey bees, by whole cell MALDI-TOF mass spectrometry. Vet Microbiol. 170:291–297.