
Abstract
Background: Natural autoantibodies (N(a)ab) were found in every species tested so far, and are likely important in maintaining homeostasis.
Objectives: (1) To determine N(a)ab in Bos taurus calves, (2) evaluate effects of diet and age on N(a)ab binding repertoires in calves, and (3) delineate bovine liver cell lysate (BLL) antigens related with variation in rumen score and body weight.
Animals and methods: Effects of age and diet on staining of BLL fragments by IgM and IgG antibodies in serum samples collected at 20 or at 26 weeks of age from bull calves either fed a restricted or ad libitum diet were analyzed using quantitative Western blotting. Correlations between fragments stained and grouping of calves were done by Principal Component Analysis (PCA). Redundancy analysis (RDA) was done to relate rumen score and body weight variation at slaughter at 27 weeks of age with stained BLL fragments.
Results: In sera from all calves IgM and IgG antibodies binding BLL antigens were found. Corresponding fragments were stained, but quantitative differences in staining intensities were related to diet and age for both IgM and IgG. PCA revealed that age had a greater influence than diet on BLL fragment staining. RDA suggested that staining by IgM or IgG of specific BLL fragments was related with variation in rumen score and body weight.
Conclusions and clinical importance: Analyses of N(a)ab in serum could be a potential tool to estimate the health status of cattle, and be used to evaluate effects of husbandry practices.
1. Introduction
As the first line of defense, innate immunity plays an important role in preventing or combating infection (Ehrenstein & Notley Citation2010). Next to complement, natural antibodies (Nab) form an important arm of humoral innate immunity (Baumgarth et al. Citation2005; Vani et al. Citation2008). Nab are present in non-immunized humans (Ehrenstein & Notley Citation2010), fish (Katchamakova et al. Citation2006), poultry (Sun et al. Citation2011), and cattle (Van Knegsel et al. Citation2007). In mammals, Nab are mostly produced by CD5+ B cells in the peritoneal cavity and intestines, but CD5− B cells also produce Nab (Casali & Notkins Citation1989). Nab are mostly poly-reactive and poly-specific (Baccala et al. Citation1989) with low binding affinity. In lower vertebrates, fetuses, and neonates, most Nab are of the IgM isotype, whereas in higher vertebrates IgG and IgA Nab are also present (Marianne Citation2000). Levels of Nab are affected by contact with non-pathogenic microbes, food, intestinal flora, and self-antigens (Quintana & Cohen Citation2004). The levels of Nab also depend on environmental factors (Kachamakova et al. Citation2006), genetic background (Parmentier et al. Citation2004; Pozsonyi et al. Citation2009; Sun et al. Citation2011), and age (Berghof et al. Citation2010). Many Nab bind pathogen-associated molecular patterns (PAMP), e.g. lipopolysaccharide, lipoteichoic acid, or peptidoglycan, which are conserved along different genera. These innate antigens serve as targets for identification of microbes by the innate immune system. Finally, when adoptively transferred, Nab facilitate specific immunity of the recipients (Lammers et al. Citation2004).
Nab were categorized into two classes. The first class of Nab is overt Nab, which can be readily detected in normal unfractionated untreated sera, and usually bind (exogenous) antigens that the individual has never encountered before, such as keyhole limpet hemocyanin. The second class of Nab bind self-antigens, so-called natural autoantibodies (N(a)ab) or cryptic, hidden, masked, latent, or silent Nab (Cheng & Chamley Citation2008). These N(a)ab bind heat shock proteins (Cohen Citation2013), (solubilized extracts and self-)antigens of liver, kidneys, brain, stomach, muscle, thymus, lungs, nuclear antigens, tumors, and red blood cells (Mouthon et al. Citation1995, Citation1996; Lacroix-Desmazes et al. Citation1995, Citation1998, Citation1999; Stahl et al. Citation2000) or in proteomic assays (Madi et al. Citation2009). The functions of N(a)ab are various: they inactivate cytokines, clear obsolete or damaged cells and metabolic waste, and are believed to play a role in surveillance or maintenance of homeostasis (Lutz et al. Citation2009) and immune maturation (Poleatev & Osipenko Citation2003). Analysis of the antigens bound by N(a)ab may provide information about an individual's immune competence (Madi et al. Citation2009), physiological homeostasis (Lutz et al. Citation2009), immune status (Cohen Citation2013), inflammation, autoimmunity, pathologies (e.g. atherosclerosis), survival, and immunosenescence (Ginaldi et al. Citation2001). Recently the profile of N(a)ab binding chicken liver cell lysate suggested a relation between (the level of) N(a)ab and the level of immune responsiveness (de Jong et al. Citation2013). In healthy humans, autoantibodies are influenced by age, gender, and disease (Nagele et al. Citation2013) and associated with the major histocompatibility (HLA) complex (Poszonyi et al. Citation2009). This suggests that also in food animals studying the binding of auto antigens by N(a)ab could provide a new way to distinguish differences in immune competence and immune maturation between individuals, and to assess effects of husbandry on immune responses.
The aims of the present study were as follows: (1) assess the presence of N(a)ab in Holstein-Friesian bull calves (Bos taurus), (2) evaluate whether N(a)ab binding repertoires in calves depend on diet or age, and (3) delineate bovine liver cell lysate (BLL) antigens stained by N(a)ab related with observed variation in rumen score and body weight, which were used as health parameters.
2. Materials and methods
The analysis was done with calves present in the experimental facilities of the Animal Science Department of Wageningen University, the Netherlands. Procedures respected the Dutch law on animal experimentation, which itself conforms to the ETS123 (Council of Europe 1985 and 86/609/EEC Directive), and were approved by the Committee on Animal Care and Use, Wageningen University. The experiment started in January and ended in August 2011.
2.1. Calves and husbandry
Holstein-Friesian bull calves (N = 38, 17.2 ± 0.5 days of age, and 45.9 ± 0.4 kg) were purchased from a dairy calf trader and transported to the experimental facilities. The calves arrived in two batches, 6 weeks apart (batch 1: N = 18; batch 2: N = 20). Calves were allocated to two diets: i.e. ad libitum or restricted. Calves from the same batch and same diet were housed in the same home pen (i.e. 4 pens in total). The pens had wooden slatted floors, open side fences (enabling contact between calves from adjacent pens) and 1.9 m2 per calf. Calves offered the ad libitum diet (N = 23) received milk replacer, concentrate, long hay, long barley straw, and corn silage in unlimited amounts, with the solid feeds being offered in separate troughs (the order of which changed every day to prevent positional preference). Ad libitum calves first received an allowance of 5 L.d−1 of milk replacer. This was then increased to ad libitum provision over the first three weeks after arrival. Calves offered the restricted diet (N = 15) were offered milk replacer and a solid feed mixture (65% corn silage, 30% pelleted concentrate, and 5% chopped barley straw, on DM basis) in limited quantities. These calves received 3.2 L.d−1 of milk replacer at arrival and this was increased gradually to reach 22.0 L.d−1 at 27 weeks of age. Restricted calves received 50 g DM.d−1 at 2 weeks to 500 g DM at 22 weeks of solid feed. After 22 weeks, solid feed provision decreased to 411 g DM.d−1 at 27 weeks. Milk replacer was provided to all calves via automated milk dispensers (TAP5-VH1-50-F2, Förster Technik®, Egen, Germany). The barn was mechanically ventilated and had artificial lighting switched on between 06:00 and 22:00 h. Temperature and humidity in the stable were recorded daily: minimum = 17.2 ± 0.1 °C and 57.5% ± 0.5%; maximum = 21.0 ± 0.1 °C and 73.0% ± 0.5%. Plasma hemoglobin levels were monitored at 10 and 22 weeks of age. Calves below 5.5 mmol.L−1 were injected with iron. Calves were given medicines when required according to a veterinary protocol.
Blood samples were taken from calves from batch 1 at 26 weeks of age. Calves from batch 2 were sampled at both 20 and 26 weeks of age. Serum samples were frozen at −20 °C until analysis. At 27 weeks of age, calves were slaughtered and rumen scores were recorded: rumen development was scored from 1 (low) to 4 (full) based on the color of the wall and the development of the papillae. Body weights were recorded at arrival at 2 weeks of age and at slaughter.
2.2. Binding of natural autoantibodies to bovine liver antigens
Quantitative Western blot analysis was used for the detection of bovine N(a)ab binding bovine liver lysate (BLL). BLL was prepared as follows: 2 g of liver tissue obtained from one of the calves was frozen in liquid nitrogen. After freezing, the liver was put through a strainer and lysed with 17.5 mL lysis buffer. The lysis buffer consisted of 10 mM TrisHCl, 1% SDS, and 1 mM EDTA, and 1 mL protease inhibitor cocktail (Sigma-Aldrich, St. Louis, USA). The mixture was centrifuged first for 10 min at 3000 rpm at 4 °C, and then for 13,200 rpm for 10 min at 23 °C. The lysed liver was diluted 1:0 or 1:20 in water and was than mixed with sample buffer (containing 5% β-mercaptoethanol) in 1:1 ration. The mixture was boiled for 5 min and, thereafter, immediately cooled on ice. The mixture was separated into smaller Eppendorf tubes and centrifuged at 13,200 rpm for 10 min at 23 °C. The supernatant containing the BLL was removed and stored at −20°C until use. In a Miniprotean Tetra cell (BioRad, Hercules, CA), the BLL fragments were separated with 12.5% SDS-PAGE (sodium dodecyl sulfate-polyacrylamide gel electrophoresis) under reducing (β-mercaptoethanol) conditions. Molecular weight markers (Mw) consisting of Precision Plus Dual Color Protein™ Standards (10, 15, 20, 25, 37, 50, 75, 100, 150, and 250 kDa, BioRad) were run as control markers. Subsequently, BLL fragments were blotted to a polyvinylidene fluoride membrane (PVDF, BioRad) with a Mini Transfer Packs blotting system (Trans-Blot®TurboTM, BioRad) for 9 min at 25 V and 2.5 A for 1 Mini blot per bay. Blots were rinsed with phosphate buffered saline (PBS) and blocked for one hour at room temperature in blocking buffer (PBS, 5% normal horse serum (NHS), and 0.05% Tween). Then, blots were incubated in a shaker for another hour with serum samples in a 16 lane Miniblotter (Immunetics, Boston, USA). Sera were diluted 1:40 and 1:20 with PBS containing 5% NHS and 0.05% Tween for IgG and IgM analysis, respectively. Each lane was filled with 200 µl serum, or PBS containing 5% NHS and 0.05% Tween to fill up empty lanes. Each blot contained a lane (lane 13 in and ) that was not incubated with test sera, and which served as conjugate control. The Miniblotter was put on a rocking table for 1 hour. After that, the blots were rinsed with PBS and washed three times with PBS containing 5% NHS and 0.05% Tween for 30 min on the suspension mixer. The second antibody (1:500 diluted rabbit anti-bovine IgG coupled to peroxidase (PO) or sheep anti-bovine IgM coupled to PO (Bethyl, Montgomery, Texas) was added to the lanes and incubated for one hour on the suspension mixer. Thereafter, the blots were rinsed again with PBS five times for 50 min. To color the bands, the Opti-4 CN substrate kit (BioRad) was used and the reaction was stopped between 5 and 30 min by rinsing them in demi water. All the chosen concentrations were based on optimizing results, with lighter background and clear distinctions between bands within the same serum sample of different dilutions.
Figure 1. Representative Western blot of plasma samples from calves of different age and fed different diets for the IgM isotype (separate lanes represent individual plasma samples). There are qualitative similarities of the conserved staining pattern in the samples but with quantitative differences. The most left lane represents molecular weight markers. Lanes 1 and 3: restricted diet, 20 weeks of age; lanes 2 and 4: restricted diet, 26 weeks of age; lanes 5, 7, 9, and 11: ad libitum diet, 20 weeks of age; lanes 6, 8, 10, and 12: ad libitum diet, 26 weeks of age. The most left lane represents molecular weight (kiloDalton) markers. The most right lane (13) in which no serum was incubated represents the conjugate (sheep anti-bovine IgM/PO) control.
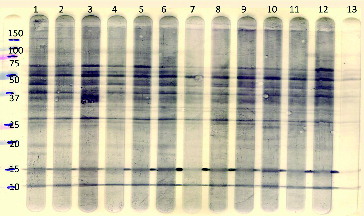
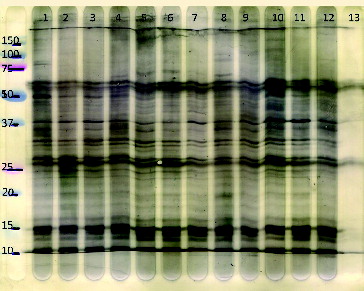
Figure 2. Representative Western blot of the same plasma samples as in , for the IgG isotype showing different animals of different ages and fed different diets (separate lanes represent individual calves). There are qualitative similarities of the conserved staining pattern in animals but with quantitative differences. More fragments are recognized at lower molecular weight for IgG than IgM. Lanes 1 and 3: restricted diet, 20 weeks of age; lanes 2 and 4: restricted diet, 26 weeks of age; lanes 5, 7, 9, and 11: ad libitum diet, 20 weeks of age; lanes 6, 8, 10, and 12: ad libitum diet, 26 weeks of age. The most left lane represents molecular weight (kiloDalton) markers. The most right lane (13) in which no serum was incubated represents the conjugate (rabbit anti-bovine IgG/PO) control.
2.3. Identification of stained bovine liver lysate fragments
For the Mw and number of BLL fragments and staining intensities, blots were scanned with a flatbed scanner and saved as a tif file. The Phoretix 1D pro software program (TotalLab, Newcastle upon Tyne, UK) with a minimum slope of 75 and linear log curve was used to measure pixel intensity (hereafter referred to as intensity) of stained fragments. The stained fragments above 100 kDa and below 10 kDa were left out of consideration. A two-way analysis of variance (ANOVA) was performed to estimate the effect of diet and age and diet by age interactions on stained fragments between 10 and 100 kDa using SAS 9.20 (SAS Institute Citation2004).
2.4. Principal component analysis and redundancy analysis
Principal component analysis (PCA) was carried out on (log10 transformed) staining intensities from BLL fragments using the CANOCO package for Windows (Leps & Smilauer Citation2003) to identify binding profiles of the antibodies. PCA was carried out only on fragments, for which staining intensity was significantly (P ≤ 0.05) or tended (P ≤ 0.1) to be affected by diet, age, or a diet by age interaction.
To highlight the fragments for which the staining intensity was related to differences in rumen score and body weight, a multivariate analysis was performed using the rumen scores and body weights as linear ‘species variables' and the staining intensities of the fragments for IgG or IgM as the ‘environmental variables’. The resulting bi-plots were created by Redundancy Analysis (RDA) using the Monte Carlo permutation under full model procedure in the CANOCO package. Diet (restricted or ad libitum) and age when blood samples were taken (20 or 26 weeks) were included as covariables for rumen score at slaughter, and diet (restricted or ad libitum), age (20 or 26 weeks blood samples) and body weight at 2 weeks of age, respectively, as covariables for body weight at slaughter.
3. Results
3.1. Animal parameters
At 27 weeks of age, body weights were significantly higher in calves offered an ad libitum diet (mean ± SEM: 253 ± 7 kg) compared with calves fed a restricted diet (217 ± 8 kg; P < 0.01). Ad libitum fed calves had significantly higher rumen scores (2.9 ± 0.7) compared with feed restricted calves (1.4 ± 0.1; P < 0.001).
3.2. Binding of N(a)ab to bovine liver lysate in Western blot
BLL fragments were stained by all calf sera ( and ). A similar number of fragments were stained by sera from calves at 20 and 26 weeks of age, and when offered an ad libitum diet compared with a restricted one. This was true for both the IgM and IgG isotypes (). Comparison of staining patterns of BLL fragments by individual calves at 20 and 26 weeks of age revealed that certain fragments were stained by sera from calves at 20 weeks of age but not by sera from calves at 26 weeks of age and vice versa. For both IgM and IgG, certain fragments were stained by sera from all calves, irrespective of age or diet. In addition, there were individual animals from which the serum stained unique BLL fragments suggesting diversity and within-species variation. Despite overall conservation of the staining patterns, the staining intensity of the fragments varied quantitatively between ages and between calves of similar age. An example of the output of the Phoretix 1D pro software program measuring staining intensities of fragments is shown in and for IgM and IgG, respectively.
Table 1. Total number of fragments stained by IgM and IgG for 20- and 26-week-old calves, and average number of fragments stained by sera from calves that received a restricted or ad libitum diet.
Figure 3. Graphical representations of a Western blot profile of an animal for the IgM isotype. The figure depicts background and height (peaks) of the stained fragments. The total number of recognized fragments is 39 which is relatively higher as compared to IgG stained fragments (). Arrow indicates ‘background staining’.
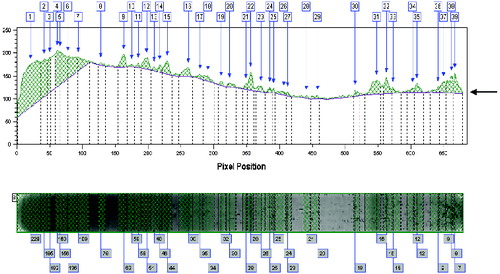
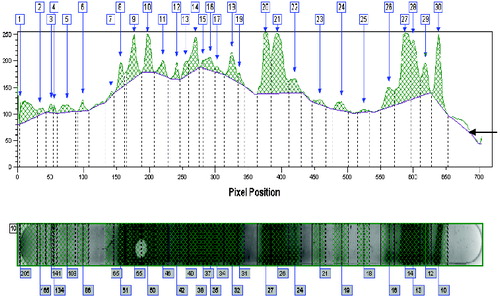
Figure 4. Graphical representation of a Western blot profile of the same animal as in for the IgG isotype. IgG showed relatively higher staining intensities than IgM, but the backgrounds are comparable. The number of fragments recognized is lower (30) for IgG as compared to IgM (39, ). Arrow indicates ‘background’ staining.
3.3. Analysis of staining intensities of the Western blot profiles
For IgM, significant age by diet interactions were found for BLL fragments in kDa: 68, 56, 51, 42, 36, 34, 31, and 23 (). Diet affected staining of fragments in kDa 66, 59, 41, 33, 32, 28, 18, and 17, and age affected staining of BLL fragments in kDa: 84, 79, 53, 49, 43, 33, 32, 29, 27, 25, 24, 22, 21, 19, 12, and 11.
Table 2. P-values for main effects of age (20 vs. 26 weeks) and diet (ad libitum vs. restricted) and the interaction between age and diet (Age × Diet) for BLL stained fragments (kDa) by IgM or IgG. P-values ≤ 0.1 were considered significant.
For IgG, age by diet interactions were found for staining of BLL fragments in kDa: 92, 76, 44, 42, and 22. Diet affected staining of fragments in kDa: 82, 64, 15, and age affected staining of fragments in kDa: 91, 90, 86, 84, 66, 58, 57, 54, 46,, 41, 34, 31, 26, 25, 15, 14, 12, 11, and 10 ().
Fragments from which the staining intensities were affected by diet, were not stained by both IgG and IgM. Fragments from which the staining intensities were affected by age, i.e. in kDa: 42, 31, 25, 12, and 11, were stained by both IgG and IgM.
3.4. PCA grouping of calves according to age for IgM and IgG
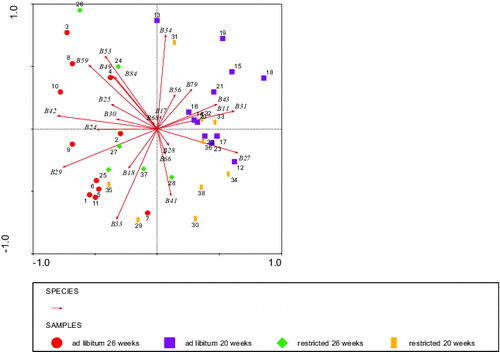
The first two dimensions (horizontal and vertical) of the PCA for BLL fragments that were stained by IgM and were affected by diet or age or diet by age interaction as shown in explained 19% and 14% of the variance (). Stained fragments in kDa 59, 42, 29, and 24 had high negative loadings (left) on the horizontal dimension, whereas stained fragments in kDa 43, 31, and 27 had high positive (right) loadings on the horizontal dimension (). Most calves with high scores on the horizontal dimension were 20 weeks of age, whereas most calves with negative scores on the horizontal dimension were 26 weeks of age () tentatively reflecting an ‘age effect’. This indicated that the high staining intensity of fragment 59 kDa, for example, might point to an older age in calves. BLL stained fragments in kDa 59, 53, and 34 had high positive loadings on the vertical dimension, whereas stained fragments in kDa 41 and 33 had high negative loadings on the vertical dimension. These loadings on the vertical dimension were not clearly distinguishable based on age or diet (). On the whole, suggested that calves could be mainly grouped to age: 20 versus 26 weeks of age. This grouping revealed a homogenous quantitative and qualitative correlation of IgM antibodies binding BLL fragments and clear differences between the two age categories.
Figure 5. Grouping by PCA analysis of stained fragments (species B ithalic) by IgM auto antibodies of bovine liver cell lysate (BLL) of the four groups of calves that were significantly affected or showed tendencies (). Circles: ad libitum fed, 26 weeks of age (calves 1–11), squares: ad libitum fed, 20 weeks of age (calves 12–23), diamonds: restricted fed, 26 weeks of age (calves 24–28 + 37), and bars: restricted fed, 20 weeks of age (calves 29–36 + 38). Numbers represent individual calves. Eigenvalues were 14% vertical and 19% horizontal axis.
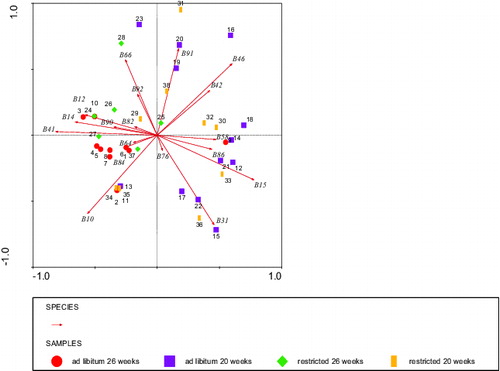
The first two dimensions (horizontal and vertical) of the PCA for IgG stained BLL fragments () that were affected by diet or age or diet by age interaction as shown in explained 28% and 17% of the variance (). The same pattern was found as for IgM: the horizontal dimension seemed to reflect age mostly, whereas the vertical dimension was not particularly associated to either age or diet ().
Figure 6. Grouping by PCA analysis of staining fragments (species B ithalic) by IgG auto antibodies of bovine liver lysate of the four classes of calves that were significantly affected or showed tendencies (). Circles: ad libitum fed, 26 weeks of age (calves 1–11), squares: ad libitum fed, 20 weeks of age (calves 12–23), diamonds: restricted fed, 26 weeks of age (calves 24–28 + 37), and bars: restricted fed, 20 weeks of age (calves 29–36 + 38). Numbers represent individual calves. Eigenvalues were 17% vertical and 28% horizontal axis.
3.5. Relation of stained BLL fragments and health parameters
3.5.1. BLL fragments and rumen score as health parameter
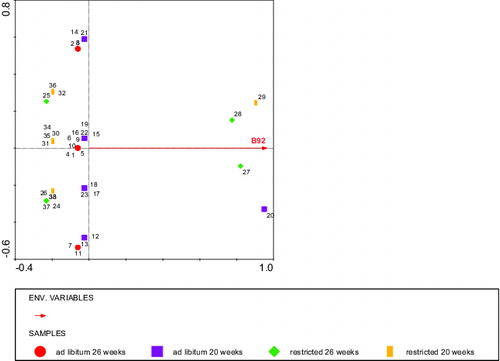
The RDA analysis using rumen score as the ‘environmental variable’, and fragment staining intensities as ‘species variables’, and diet and age of blood sampling, respectively, as covariables revealed that the staining intensity of two BLL fragments: kDa 68 and 11 stained by IgM explained 21% of the variation in rumen score. A high staining intensity of the 68 kDa fragment was associated with a high rumen score (P < 0.006), whereas a high staining intensity of the 11 kDa fragment was associated with a low rumen score (P < 0.05; ). The staining intensity of a 92 kDa fragment stained by IgG explained 22% of the variation in rumen score: a high staining intensity of the 92 kDa band was associated with a low rumen score (P < 0.02, ). Both and indicated that the relationship between the stained fragments and rumen score was independent of diet and age.
Figure 7. RDA analysis depicting the BLL fragments (Environmental variables B11 and B68) stained by IgM that significantly explained the rumen score with diet and age as covariables. Circles: ad libitum fed, 26 weeks of age (calves 1–11), squares: ad libitum fed, 20 weeks of age (calves 12–23), diamonds: restricted fed, 26 weeks of age (calves 24–28 + 37), and bars: restricted fed, 20 weeks of age (calves 29–36 + 38). Numbers represent individual calves. Fragments B68 and B11 in opposite directions explained 12% of the variation in the rumen score.
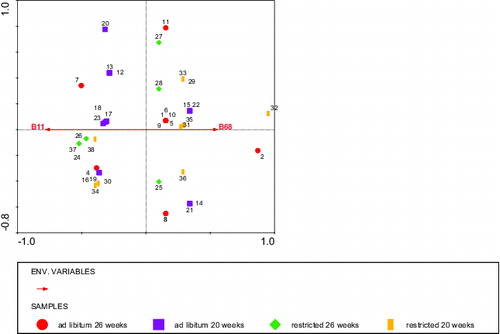
Figure 8. RDA analysis depicting the BLL fragment (Environmental variable B92) stained by IgG that significantly (P < 0.01) explained the rumen score with diet, age, and body weight at slaughter as covariates. Circles: ad libitum fed, 26 weeks of age (calves 1–11), squares: ad libitum fed, 20 weeks of age (calves 12–23), diamonds: restricted fed, 26 weeks of age (calves 24–28 + 37), and bars: restricted fed, 20 weeks of age (calves 29–36 + 38). Numbers represent individual calves. Fragment B92 explained 6% of the variation in the rumen score.
3.5.2. BLL fragments and body weight at slaughter as health parameters
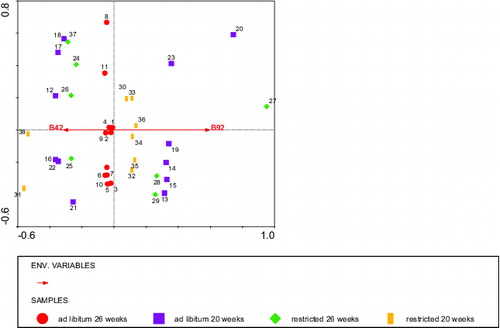
An RDA analysis using body weight at slaughter as the ‘environment variable' and fragment staining intensities as ‘species variables’, including body weight at 2 weeks of age, and diet and age of blood sampling, respectively, as covariables revealed that the IgM staining of BLL explained 38% of the body weight at slaughter, from which one fragment: 29 kDa stained by IgM was significantly related (P < 0.01) with a lower body weight at slaughter (). The IgG staining pattern of BLL fragments explained 28% of the variation in body weight at slaughter, from which a 92 kDa fragment stained by IgG tended to be related (P < 0.08) with a lower body weight at slaughter, whereas a 42 kDa fragment stained by IgG was significantly related (P < 0.03) with a higher body weight at slaughter ().
Figure 9. RDA analysis depicting the BLL fragment (Environmental variable B29) stained by IgM that significantly explained the body weight at slaughter with diet, age, and body weight at 2 weeks of age as covariates. Circles: ad libitum fed, 26 weeks of age (calves 1–11), squares: ad libitum fed, 20 weeks of age (calves 12–23), diamonds: restricted fed, 26 weeks of age (calves 24–28 + 37), and bars: restricted fed, 20 weeks of age (calves 29–36 + 38). Numbers represent individual calves. Fragment B29 (low body weight) explained 10% of the variation in body weight at slaughter.
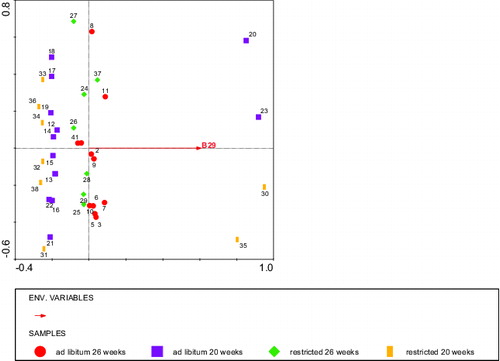
Figure 10. RDA analysis depicting the BLL fragments stained by IgG that tended (Environmental variable B92) to or significantly explained (environmental variable B42) the body weight at slaughter with diet and body weight at 20 weeks as covariates. Circles: ad libitum fed, 26 weeks of age (calves 1–11), squares: ad libitum fed, 20 weeks of age (calves 12–23), diamonds: restricted fed, 26 weeks of age (calves 24–28 + 37), and bars: restricted fed, 20 weeks of age (calves 29–36 + 38). Numbers represent individual calves. Fragments of B92 (low body weight) and B42 explained 11% of the variation in body weight at slaughter.
4. Discussion
4.1. Natural autoantibodies in calves and qualitative differences between individuals
The present paper reports the presence of IgM and IgG antibodies in sera from normal, non-immunized calves binding fragments of the auto-antigen complex BLL. The presence of N(a)ab in healthy humans (Lacroix-Desmazes et al. Citation1998; Nagele et al. Citation2013), healthy mice (Haury et al. Citation1997), and healthy poultry (de Jong et al. Citation2013) was demonstrated previously. By now a plethora of self-antigens recognized by N(a)ab in healthy individuals are known. N(a)ab binding DNA, hormones, histones, enzymes, receptors, major histocompatibility antigens, intercellular matrix components, and so on were found in healthy humans (Poletaev and Osipenko Citation2003). Consistent with these findings, in the present study N(a)ab were found in calves that to the best of our knowledge were not immunologically challenged and showed no clinical signs of disease. It has to be kept in mind, however, that the slightly broader reaction pattern of the older animals as found in this study may rest on a longer exposure to unknown germs. Our choice to use bovine liver tissue was based on the earlier findings demonstrating that liver tissue showed a high degree of heterogeneity and stability of reactivity from autoantibodies; however, other tissues like brain, muscle, and lungs as tested in mice (Haury et al. Citation1997) and man (Mouthon et al. Citation1995, Citation1996) may have shown similar results.
We employed Western immunoblotting to study the presence of N(a)ab and patterns of reactivities to BLL, as was described elsewhere (Stahl et al. Citation2000; Nagele et al. Citation2013). Other methods, including ELISA (Quintana et al. Citation2003; Van Knegsel et al. Citation2012) and antigen microarrays were also used (Madi et al. Citation2009; Merbi et al. Citation2013). Western blotting with biological material likely illustrates biological relevant antibody reactivity, but repeatability of these assays may be not as high as when using proteomic approaches, and therefore interpretations require caution. Western blotting under reducing conditions as used in the present study detects mainly linear epitopes. It is likely that when using different gels or conjugate dilutions, different electrophoresis conditions or different procedures for BLL preparation, results may be different. Also, a relatively limited number of individuals were studied. The majority of the calves in the present study showed similar staining of BLL fragments and corresponding fragments stained by both IgG and IgM, except for a few fragments that were recognized solely by IgM and not IgG. Other studies reported additional IgG stained fragments compared with IgM in humans (Stahl et al. Citation2000) and chickens (de Jong et al. Citation2013). The high conservation of N(a)ab staining patterns (profiles) across individuals irrespective of isotype in the present study suggested that they were not influenced by external antigens (Mouthon et al. Citation1995; Madi et al. Citation2011), and that they may perform or share a physiological role in the homeostasis of the body through clearance of metabolic waste from (dead, senescent, apoptotic) cells, and non-functional plasma proteins, or clearance of microbes with high conserved PAMPS as proposed by Lutz et al. Citation(2009). Considering IgM, the conservation noticed in the present study in healthy calves suggests that IgM N(a)ab are established early in life, may be independent of environmental antigen stimulation and may be maintained by auto-antigen stimulation. Similar results were reported by Mouthon et al. Citation(1996) in children and adults that were tested for autoantibody patterns recognizing self- and non-self-antigen. Also staining of BLL fragments by IgG in the present study was conserved across individuals and age. In chickens (de Jong et al. Citation2013) and humans (Madi et al. Citation2009; Nagele et al. Citation2013), distinct banding patterns for IgG amongst individuals of different ages were reported. One possibility is that IgG may react differently in cattle, and the present study was based on a limited number of calves. Alternatively, the conservation of IgG patterns may be explained by the relatively young age of the calves used in the present study, the period of six weeks may have been too short to significantly alter the IgG N(a)ab profile. This short period might underlie the greater resemblance between antibody reactivity of IgM and IgG in the present study than that found in humans (Madi et al. Citation2011). The IgG repertoire observed in 20-week-old calves may also be derived from the influence of maternally transferred IgG during neonatal life (Zinkernagel Citation2003) which can still have long-term selection effects in the neonatal B cell development. Unfortunately, no information about the calves' dams was available in the current study.
4.2. Quantitative differences in staining intensities
Although many fragments were stained in a qualitatively similar way across individuals, this study revealed that staining intensities of BLL fragments were affected by diet, age, and interactions between diet and age. suggested some effects of diet but also shows that age has the larger impact on the profiles than diet. More fragments stained by IgM were affected by diet than for IgG, but staining of BLL by IgM and IgG were both more affected by age than diet. It is worth noting that we observed differences in the staining intensity of specific fragments for the two isotypes ( and ). In essence, IgG () had higher staining intensities of BLL fragments compared with IgM (). de Jong et al. Citation(2013) found higher staining by IgM of liver lysate in chicken that could not be attributed to specific fragments suggesting many more other IgM-idiotypes with lower concentrations and adjacent specificities. The higher staining intensities and the more clearly distinct specific stained fragments found with IgG () suggested that auto-IgG would be the isotype more suitable for determining variation between individuals as proposed by Francoeur Citation(1988). As yet the nature of the stained fragments, i.e. being liver metabolites or cryptic antigens, is unknown. It would be interesting to characterize the chemical composition of these fragments and study if they fall in different categories. It is tempting to suggest that the high variance exhibited among the calves for the IgG isotype in the present study was entirely due to age and to a lesser extent diet. The high variance in conjunction with high specific staining heights exhibited with IgG suggests a higher plasticity of IgG repertoires with regard to environmental changes. For both isotypes stained BLL fragments were shared between 20- and 26-week-old calves, with some fragments (dis-)appearing in the older calves. Whether this rests on developmental arrest of auto-reactive IgM B cells that encounter auto-antigen (Nemazee & Hogquist Citation2003) leading to clonal deletion (Nemazee Citation2006) remains to be studied. The shared staining of fragments between IgM and IgG suggests that fragments or autoantibodies recognizing these fragments are retained partially from birth to adulthood as was found in humans (Madi et al. Citation2011).
4.3. PCA grouping of calves according to age for both IgM and IgG
The present results showed that calves were profoundly and principally grouped according to age but less by diet. Except for hay, which was only available to ad libitum calves, the same diet components were provided to both restricted and ad libitum fed calves. The effect of age was clearly apparent. As noted in and , there was clear grouping of 20-week-old calves on the one hand, and 26-week-old calves on the other hand. The cause for such age-related effect remains to be elucidated.
Using RDA, we explored whether staining of BLL fragments was related to health in the form of a ‘pathological’ condition using rumen score and body weight at slaughter as general health parameters. For both IgM and IgG, staining of some BLL fragments suggested a relation between the presence and levels of autoantibodies and the observed variation in the rumen score and body weight at slaughter. Identification and confirmation of such stained auto-antigens may then be important for feeding practices and management. It has to be kept in mind, however, as stated above, that Western blot results depend on gel electrophoresis and blotting conditions so that the identification of a fragment requires standardized conditions.
4.4. Conclusion
In conclusion, we report the presence of IgM and IgG antibodies binding BLL fragments in sera from 20- and 26-week-old Holstein-Friesian bull calves. The IgM and IgG binding patterns of BLL were affected mostly by age, but to a lesser extent also by diet. Conservation of staining of BLL fragments by sera from calves from 20 and 26 weeks of age was more apparent for IgM than IgG. Since RDA revealed specific BLL fragments from which the staining intensity was associated with variation in rumen score and body weight, we suggest a role for N(a)ab identification in health evaluation procedures for cattle as has been suggested for humans (Lacroix-Desmazes et al. Citation1995, Citation1998, Citation1999; Madi et al. Citation2009, Citation2011; Nagele et al. Citation2013), mice (Haury et al. Citation1997), and poultry (de Jong et al. Citation2013).
Acknowledgements
The authors thank the Division for Earth and Life Sciences (ALW) of the Netherlands Organization for Scientific Research (NWO, The Hague, the Netherlands), and the Product Board Animal Feed (The Hague, the Netherlands) for the financial support of the experiment. The care of the calves by the caretakers of the experimental facilities of the Department of Animal Science, Wageningen University, the Netherlands, and in particular Mr Bert Beukers is acknowledged.
Disclosure statement
No potential conflict of interest was reported by the authors.
References
- Baccala R, Quang TV, Gilbert M, Ternynck T, Avrameas S. 1989. Two murine natural polyreactive autoantibodies are encoded by nonmutated germ-line genes. Proc Natl Acad Sci. 86:4624–4628.
- Baumgarth N, Tung JW, Herzenberg LA. 2005. Inherent specificities in natural antibodies: a key to immune defense against pathogen invasion. Springer Sem Immunopathol. 26:347–362.
- Berghof TVL, De Vries Reilingh G, Nieuwland MGB, Parmentier HK. 2010. Effect of aging and repeated intratracheal challenge on levels of cryptic and overt natural antibodies in poultry. Poultry Sci. 89:227–235.
- Casali P, Notkins AL. 1989. CD5+ B lymphocytes, polyreactive antibodies and the human B-cell repertoire. Immunol Today 10:364–368.
- Cheng HM, Chamley L. 2008. Cryptic natural autoantibodies and co-potentiators. Autoimmun Rev. 7: 431–434.
- Cohen R. 2013. Autoantibody repertoires, natural biomarkers, and system controllers. Trends Immunol. 34:620–625.
- de Jong BG, Lammers A, Oberendorf LAA, Nieuwland MGB, Savelkoul HFJ, Parmentier HK. 2013. Genetic and phenotypic selection affect natural (auto-) antibody reactivity of chickens. PLoS One 8:e72276. doi:10.1371/journal.pone.0072276
- Ehrenstein MR, Notley CA. 2010. The importance of natural IgM: scavenger, protector and regulator. Nat Rev Immunol. 10:778–786.
- Francoeur AM. 1988. Antibody fingerprinting: a novel method for identifying individual people and animals. Nat Biotechnol. 6:822–825.
- Ginaldi L, Loreto MF, Corsi MP, Modesti M, De Martinis M. 2001. Immunosenescence and infectious diseases. Microbes Infect. 3:851–857.
- Haury M, Sundblad A, Grandien A, Barreau C, Coutinho A, Nobrega A. 1997. The repertoire of serum IgM in normal mice is largely independent of external antigenic contact. Eur J Immunol. 27:1557–1563.
- Kachamakova NM, Irnazarow I, Parmentier HK, Savelkoul HFJ, Pilarczyk A, Wiegertjes GF.2006. Genetic differences in natural antibody levels in common carp (Cyprinus carpio L.). Fish Shellfish Immunol. 21:404–413.
- Lacroix-Desmazes S, Kaveri SV, Mouthon L, Ayouba A, Malanchère E, Coutinho A, Kazatchkine MD. 1998. Self-reactive antibodies (natural autoantibodies) in healthy individuals. J Immunol Methods 216:117–137.
- Lacroix-Desmazes S, Mouthon L, Coutinho A, Kazatchkine MD. 1995. Analysis of the natural human IgG antibody repertoire: life-long stability of reactivities towards self antigens contrasts with age-dependent diversification of reactivities against bacterial antigens. Eur J Immunol. 25:2598–2604.
- Lacroix-Desmazes S, Mouthon L, Kaveri SV, Kazatchkine MD, Weksler ME. 1999. Stability of natural self-reactive antibody repertoires during aging. J Clinical Immunol. 19:26–34.
- Lammers A, Klomp MEV, Nieuwland MGB, Savelkoul HF J, Parmentier HK. 2004. Adoptive transfer of natural antibodies to non-immunized chickens affects subsequent antigen-specific humoral and cellular immune responses. Dev Comp Immunol. 28:51–60.
- Leps J, Smilauer P. 2003. Multivariate analysis of ecological data using CANOCO. Cambridge: Cambridge University Press; 269 pp.
- Lutz HU, Binder C J, Kaveri S. 2009. Naturally occurring auto-antibodies in homeostasis and disease. Trends Immunol. 30:43–51.
- Madi A, Hecht I, Bransburg-Zabary S, Merbl Y, Pick A, Zucker-Toledano M, Quintana FJ, Tauber AI, Cohen IR, Ben-Jacob E. 2009. Organization of the autoantibody repertoire in healthy newborns and adults revealed by system level informatics of antigen microarray data. Proc Natl Acad Sci. 106:14484–14489.
- Madi A, Kenett DY, Bransburg-Zabary S, Merbl Y, Quintana FJ, Tauber AI, Cohen IR, Ben-Jacob E. 2011. Network theory analysis of antibody-antigen reactivity data: the immune trees at birth and adulthood. PLoS One 6:e17445.
- Marianne B. 2000. Role of natural and immune IgM antibodies in immune responses. Mol Immunol. 37:1141–1149.
- Merbi Y, Zucker-Toledano M, Quintana FJ, Cohen IR. 2013. Newborn humans manifest autoantibodies to defined self molecules detected by antigen microarray informatics. J Clin Invest. 117:712–718.
- Mouthon L, Lacroix-Desmazes S, Nobrega A, Barreau C, Coutinho A, Kazatchkine MD. 1996. The self-reactive antibody repertoire of normal human serum IgM is acquired in early childhood and remains conserved throughout life. Scand J Immunol. 44:243–251.
- Mouthon L, Nobrega A, Nicolas N, Kaveri SV, Barreau C, Coutinho A, Kazatchkine MD. 1995. Invariance and restriction toward a limited set of self-antigens characterize neonatal IgM antibody repertoires and prevail in autoreactive repertoires of healthy adults. Proc Natl Acad Sci. 92:3839–3843.
- Nagele EP, Han M, Acharya NK, Demarschall C, Kosciuk MC, Nagele RG. 2013. Natural IgG autoantibodies are abundant and ubiquitous in human sera, and their number is influenced by age, gender, and disease. PLoS One 8:e60726.
- Nemazee D. 2006. Receptor editing in lymphocyte development and central tolerance. Nat Rev Immunol. 6:728–740.
- Nemazee D, Hogquist KA. 2003. Antigen receptor selection by editing or downregulation of V(D)J recombination. Curr Opinion Immunol. 15:182–189.
- Parmentier HK, Lammers A, Hoekman JJ, De Vries Reilingh G, Zaanen ITA, Savelkoul HFJ. 2004. Different levels of natural antibodies in chickens divergently selected for specific antibody responses. Dev Comp Immunol. 28:39–49.
- Poletaev A, Osipenko L. 2003. General network of natural autoantibodies as immunological homunculus (Immunculus). Autoimmun Rev. 2:264–271.
- Pozsonyi E, György B, Berki T, Bánlaki Z, Buzás E, Rajczy K, Hossó A, Prohászka Z, Szilágyi A, Cervenak L, Füst G. 2009. HLA-association of serum levels of natural antibodies. Mol Immunol. 46:1416–1423.
- Quintana FJ, Cohen IR. 2004. The natural autoantibody repertoire and autoimmune disease. Biomed Pharmacother. 58:276–281.
- Quintana FJ, Getz G, Hed G, Domany E, Cohen IR. 2003. Cluster analysis of human autoantibody reactivities in health and in type 1 diabetes mellitus: a bio-informatic approach to immune complexity. J Autoimmun. 21:65–75.
- SAS Institute. 1990. SASR User's Guide: Statistics, Version 6 edition. Cary, NC: SAS Institute Inc.
- Stahl D, Lacroix-Desmazes S, Mouthon L, Kaveri SV, Kazatchkine MD. 2000. Analysis of human self-reactive antibody repertoires by quantitative immunoblotting. J Immunol Methods 240:1–14.
- Sun Y, Parmentier HK, Frankena K, Van der Poel JJ. 2011. Natural antibody isotypes as predictors of survival in laying hens. Poult Sci. 90:2263–2274.
- Van Knegsel ATM, De Vries Reilingh G, Meulenberg S, Van den Brand H, Dijkstra J, Kemp B, Parmentier HK. 2007. Natural antibodies related to energy balance in early lactation dairy cows. J Dairy Sci. 90:5490–5498.
- Van Knegsel ATM, Hostens M, De Vries Reilingh G, Lammers A, Kemp B, Opsomer G, Parmentier HK. 2012. Natural antibodies related to metabolic and mammary health in dairy cows. Prev Vet Med. 103:287–297.
- Vani J, Elluru S, Negi V-S, Lacroix-Desmazes S, Kazatchkine MD, Bayary J, Kaveri SV. 2008. Role of natural antibodies in immune homeostasis: IVIg perspective. Autoimmunity Rev. 7:440–444.
- Zinkernagel RM. 2003. On natural and artificial vaccinations. Ann Rev Immunol. 21:515–546.