
ABSTRACT
In this paper, we quantify the degree of ganglion cell layer thinning due to retrograde trans-synaptic degeneration (RTSD) from retro-geniculate damage in six cases who had homonymous visual field defects known since childhood. Three had prenatal injuries, occurring close to mid-gestation and in the first parts of the early and late third trimester, respectively, and representing injuries at different early developmental stages. Three had later acquired injuries, at age 1.5, 4 and 13 years. The impact of the injury to the optic radiations was revealed by fibre tractography. The ganglion cell thinning corresponded with the visual field defects and the extent and location of the primary brain damage. The most important sign of RTSD was asymmetry of the ganglion cell topography within the macular area.
Introduction
The term retrograde trans-synaptic degeneration (RTSD) describes secondary degeneration of neurons after injury affecting the target neurons they synapse with. The general view in the twentieth century was, based on animal studies, that while RTSD occurred in the immature visual system in humans, RTSD after an injury to the mature retro-geniculate visual system was questioned. However, RTSD has been described after damage to the mature visual brain in humans in case reports confirmed with histology.Citation1–Citation3 Abnormal optic disc appearance in children with cerebral visual impairment due to periventricular leukomalacia has been attributed to RTSD.Citation4
With the help of new diagnostic tools, it has now become possible to more precisely describe the connection between the primary retro-geniculate lesion and the secondary loss of retinal ganglion cells. The primary brain lesion can be depicted with magnetic resonance imaging (MRI). Optic coherence tomography (OCT) can analyse the retinal nerve fibre layer (RNFL). In 2005 Mehta and PlantCitation5 used OCT and reported RNFL thinning in two adult patients who presented with homonymous visual field defects due to presumed prenatal occipital stroke. Jindahra et al. (2009)Citation6 demonstrated thinning of the RNFL in the human retina in individuals with homonymous hemianopia, in both “congenital” and adult acquired cases. The extent and exact location of the underlying brain pathology were not described. Park et al. (2012)Citation7 defined the pattern of brain pathology in adult stroke patients using MRI to describe the lesion side and vascular territory. They then used OCT to study the RNFL and demonstrated topographical correlations between the thinning of the RNFL and the nature of the brain lesion. They also quantified the degree of visual field loss. Their study therefore covered neuroradiology, RNFL structure and visual field function.
In paediatric neuro-ophthalmology, children present with visual field defects due to lesions of the retro-geniculate visual system, from events of various timings. The pattern of brain pathology often gives information about the stage at which development of the immature visual system has been disturbed.Citation8
With diffusion-weighted MRI (dMRI) and fibre tractography it is possible to analyse the primary brain lesion and its relation to the visual pathways/visual cortex. Our group, Lennartsson et al. (2014)Citation9, studied seven adult individuals with periventricular white matter damage that occurred at gestational age 24–34 weeks. We found a correlation between the lesions in the upper parts of both optic radiations (OR) and the thinning of the upper RNFL.
The introduction of spectral domain technology in OCT has been a major step forward. Software development has now made it possible to analyse the inner retinal layers of the macula, the ganglion cell layer and inner plexiform layer (GCL+IPL). Mitchell et al. (2015)Citation10 showed OCT-verified thinning of the GCL+IPL in several adults with homonymous VF defects who had various causes of brain damage. Only aetiology but not the precise lesion and its relationship to the retro-geniculate visual system was described. Herro and Lam (2015)Citation11 suggested that the GCL topography better predicted the VF function compared with RNFL thickness in patients with RTSD. Later, we were able to confirm this strict topographic relationship between the GCL+IPL and VF. We also added information from MRI and fibre tractography and found a strict topographical and quantitative correlation between the injuries to the superior parts of both ORs and the thinning of the superior GCL+IPL in each eye, corresponding with the inferior VF defects.Citation12
The purpose of this multiple-case study on young adults with homonymous VF defects known since childhood was to investigate if there was GCL+IPL loss as evidence of RTSD and relate this to their brain lesions mapped out using MRI and fibre tractography.
Our aim was to be more precise about the timing of the brain injuries than simply according the term “congenital”.Citation6 We therefore describe injuries of different aetiologies affecting the OR, and/or the visual cortex from the second trimester, through to the early and late third trimester, as well as postnatally acquired lesions at different stages of maturation. Our aim was to describe the distribution of ganglion cell loss in relation to the precise location and extent of the brain lesions, and to relate the patterns observed to the patterns of VF loss.
Material and methods
Cases
From a large cohort of individuals who presented with homonymous visual field defects as children collected by LJ in clinical paediatric ophthalmology care, six who had reached early adulthood, were invited. They were selected to represent a range of different stages of brain development at the time of injury. Only individuals with the intellectual and motor prerequisites to cooperate with the demanding MRI sessions, the ability to maintain fixation during OCT and the capacity to carry out standardised perimetry test, were invited. The study group contained six individuals (four female) with a median age of 20 years (range 17–23). Best-corrected decimal visual acuity (BCVA) was in right eyes (OD) median 1.25 (range 0.63–1.25) and left eyes (OS) median 1.25 (range (0.63–1.6) with spherical equivalent OD ±0 dioptres (D) (range −3.25 – +2.25) and OS ±0 D (range −2.25 – +3.25). Two subjects had exotropia and two had nystagmus.
Control group
Data from 13 young adults, coming for routine examination to the Optometry clinic at the Karolinska Institutet, Stockholm, Sweden, where included as control subjects. Inclusion criteria were: birth at full term; no history of ocular disease and absence of visual complaints. The group contained ten females and three males with a median age of 25 years (range 22–34). BCVA was a median of 1.5 (range 1.0–2.0) with a median spherical equivalent of −0.75 D (range +1 to −5.25).
Ocular examination
All participants went through an eye examination including refraction, cover test, motility, BCVA, perimetry and OCT examination.
Perimetry
The VF was examined using the Humphrey Field Analyser (HFA) Carl Zeiss Meditec, Dublin, CA, USA and the SITA Fast 24–2 test strategy. All patients unfamiliar with perimetry testing were offered a training session. If the result was considered unreliable, i.e., more than 30% fixation losses or more than 15% false positives, the patients were re-examined. Results were expressed as the VF index (VFI), a global metric that represents the entire VF based on the pattern deviation with central points accorded a greater weighting than more peripheral ones.
Optical coherence tomography
Retinal scans were obtained using the Spectral domain OCT from the Carl Zeiss model HD-Cirrus OCT™ 5000 version 8.0 (Carl Zeiss Meditec, Dublin, CA, USA). The macular cube scan 512 × 128 protocol, covering 6 × 6 mm of the retina with the fovea centred was used for measuring the GCL+IPL thickness. The GCL+IPL thickness was calculated by using the software tool; Ganglion Cell Analysis. The thickness maps were divided into six sectors representing the superior, inferior supero-nasal, infero-nasal, infero-temporal and supero-temporal portions of the elliptic GCL+IPL layer. The outcome report presented mean values for each sector, a total average value (mean GCL+IPL) and a minimum value (min GCL+IPL) of the thickness. The GCL+IPL symmetry was investigated by calculating the maximal difference in GCL+IPL thickness between sectors in each eye, in cases and controls.
High image quality of the OCT measurements was defined as images with small or negligible influence by eye movements and/or blinking and signal strength 6 or higher. The image quality was carefully reviewed since successful GCL+IPL segmentation depends on high-quality scans.
Neuroimaging
Conventional MRI and dMRI was collected with scanning protocols used in two previous studies: Lennartsson et al. 2015 (Cases A & B)Citation13 and Lennartsson et al. 2014. (Cases C-F).Citation9 Conventional images were visually assessed for lesion type, location and extent with a special focus on the visual pathways. Reconstruction of the ORs was performed with probabilistic constrained-spherical deconvolution fibre tractographyCitation14 by seeding streamlines in a 4mm sphere encapsulating the lateral geniculate nucleus (LGN) and using a 30mm radius sphere centred in the occipital pole (covering the calcarine sulcus) as an inclusion target.Citation8 The OR tracts were assessed by observation in relation to their expected topographyCitation15,Citation16 and in relation to lesions identified on conventional MRI. Cases where the number of streamlines (streamline density) in the OR tracts were clearly fewer (lower) than expected were considered abnormalCitation8 (). All radiological assessments were carried out by an experienced neuroradiologist (FL).
The study was approved by the local ethical committee (EPN Stockholm Nord, diarienr 2013/1114–31/2) and followed in accordance to the Helsinki declaration. All participants were given oral and written information and written approval was gathered.
Statistics
The mean and minimum GCL+IPL thickness data were checked for Gaussian distribution in each study group (cases and controls) separately using normal QQ-plots. Normally distributed data were presented as mean values and standard deviations. For comparisons between groups, the non-parametric Mann–Whitney U-test was applied due to the small study group, regardless of data being Gaussian distributed. The correlation between GCL+IPL thickness values and VFI data were investigated using Spearman’s ρ correlation coefficient. Due to multiple comparisons between groups, Bonferroni correction was applied and p-values ≤0.01 were regarded as significant.
The demographic data, i.e., refractive error and visual acuity were not normally distributed and therefore were recorded as median and range.
Results
MRI findings
The timing and cause of injury, and the resulting effects on the ORs, as well as the VF defects and GCL+IPL thickness-patterns are shown in .
Figure 1. Brain injury on MRI, visual field defects and GCL+IPL topography and layer thickness presentation for cases A-F. GW = gestational week, yrs = years, WMDI = white matter damage of immaturity, PCA = posterior cerebral artery, AVM = arteriovenous malformation, OR = optic radiation. Cases A to F are presented according to the timing of the damage (see ). For each case the brain injury is presented on representative conventional MRI (first panel, top row), the reconstructed ORs are super-imposed on conventional MRI (first panel, bottom row) with red arrows indicating the location of injury (see for descriptive analysis). Visual fields are presented in grey scales, with black indicating visual field defects. Below the GCL+IPL topography, with red indicating thinning, the thickness values for each macular area are presented. Green colour indicates values within the normal range, yellow borderline and red thin. Mean GCL+IPL values and minimum values for each eye are given in microns. There was a correlation between the sectors with GCP+IPL thinning (indicated by red and yellow in the grey fundus photos) and the visual field defects (indicated with dark/black colour in the greyscale map) in all except one case (E). However, in that case, there was an abnormal asymmetry in GCL+IPL thickness between the sectors, with a correlation between the thinnest sectors and the visual field damage.
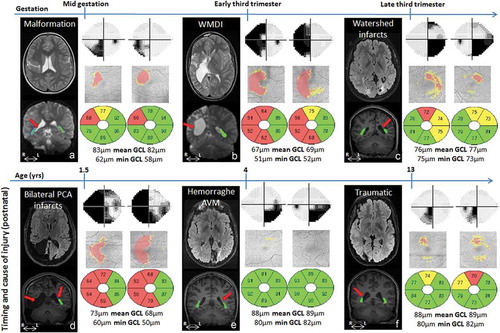
For all cases, MRI reliably defined the timing of the lesions; three of the subjects had prenatal injuries (Case A-C) and the other three subjects had later acquired injuries (Case D-F). The MRIs showed a range of extensive to mild injuries, including asymmetrical bilateral and unilateral injuries. However, the nature and degree of OR injury/involvement could be revealed only by fibre tractography ( and ).
Table 1. Clinical presentations and MRI findings for cases A-F, all with known homonymous VF defects.
OCT findings
There was a significant difference between the mean GCL+IPL thickness when comparing cases and controls, i.e., 77 ± 7µm and 84 ± 6µm (p = 0.01). The cases also showed a reduced minimum GCL+IPL thickness (−17µm) compared with controls (p < 0.0001).
All cases had, in each eye respectively, reduced or relatively reduced GCL+IPL thicknesses in the sectors anatomically corresponding to the visual field defects (). One of the cases (E) had GCL+IPL thickness values within the normal range (according to the normative data base in the OCT) but presented an asymmetry between sectors (). Cases had a significantly larger difference between the thinnest and thickest sector compared with controls (p < 0.0001). In controls the mean difference was 5 ± 2µm, while in the cases this was 20 ± 11µm. The maximum difference observed in the control group was 7µm (range 2–7) while 8µm was the smallest difference noticed among cases (range 8–37), see .
Figure 2. The GCL+IPL distribution in Case E with visual field defects and GCL+IPL thickness values within the normal range but abnormal asymmetry. S = superior, SN = superior nasal, IN = inferior nasal, I = inferior, IT = inferio-temporal and ST = superior temporal GCL+IPL layer sector. The GCL+IPL thickness is indicated on the cardinal positions between the centre point and S. Note that the controls have a symmetric distribution while Case E shows generally high thickness values with a local depression in the SN sector in the right eye (blue line, Case E_OD) and in the ST in left eye (red line, Case E_OS). This relative thinning corresponded with the visual field defects (homonymous defects in the left infero-nasal and right infero-temporal quadrant). No such asymmetry was seen in any of the controls.
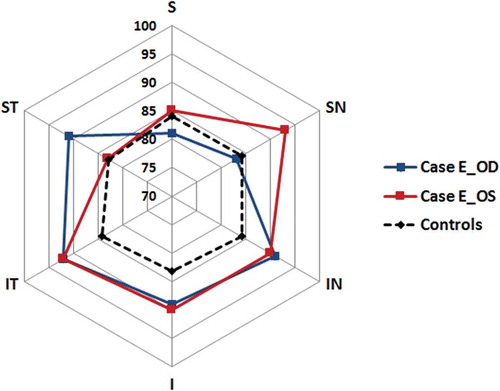
Figure 3. Maximum difference in GCL+IPL thickness between sectors in each eye in cases and controls. The maximum difference observed in the control group was 7 µm (range 2–7) while 8 µm was the smallest difference noticed among cases (range 8–37). GCL+IPL = ganglion cell + inner plexiform layer, µm = microns, * = statistically significant difference.
A correlation between the mean GCL+IPL thickness and the VFI was found among Cases, Spearman’s ρ correlation coefficient 0.67 (p = 0.0167).
Discussion
In this multiple case study on the ganglion cell topography in individuals with homonymous visual field defects known since childhood, we found convincing evidence of RTSD from the primary retro-geniculate injury in all cases, regardless of at what stage of development the visual system was injured. They were examined with OCT ten or more years after the injury, at an age when age-related loss of ganglion cells is very small.Citation17–Citation19 Fibre tractography of the OR lesions made it possible to localise and estimate the extent of the effect upon the retro-geniculate pathways, allowing for a topographical association between the primary injury in the retro-geniculate visual pathways and the secondary effect upon the pre-geniculate visual pathways and retina.
The causes of homonymous visual field defects in children are various, and the pattern of retro-geniculate brain pathology depends on the stage of development at which the brain was injured. The current study looked at the consequences for the GCL+IPL topography and VF function of brain pathologies at different timings. The access to OCT as a means of working up and ascertaining the origin of VF defects has proven to be very valuable. In our experience, it is possible to get good images in children with a developmental age of five years or more. However, the automatic analyses of the OCT images are often developed to suit the follow-up of glaucoma patients. There is a need to develop the analytic programmes to suit the questions asked by neuro-ophthalmologists. Therefore, the interpretation of the thickness values in relation to the normative database must be done with care. As long as the values are within the normal distribution the values will be “green” even when there is an abnormal asymmetry between sectors. This was well illustrated in one of our cases (E) whose values were recognised as each being within the normal distribution by the software, but the difference between the thinnest and the thickest sector was larger than in any of the controls. We interpret the regional thinning of the GCL+IPL layer as a result of RTSD as it corresponds with the extent of the brain lesion and with the VF loss. Although it is surprising to see the well-preserved GCL+IPL layer in relation to the VF loss, it can also be noted that the most central VF was unaffected in this subject unlike the rest of the study group. Another method to discover the asymmetry is to look at the difference between mean and minimum GCL+IPL thicknesses, which is normally very small in young healthy adults.Citation17 In case F, we found a normal peripapillary RNFL, but reduced GCL+IPL corresponding with the homonymous scotoma. The greater sensitivity of GCL+IPL loss compared with peripapillary analysis has been observed before.Citation11 In cases B and D, the peripapillary RNFL was severely reduced in all quadrants while the GCL+IPL layer was reduced only in the sectors corresponding to the VF defects. Thus, the GCL+IPL topography better predicts the pattern of the VF defect than the peripapillary RNFL pattern.
To add sensitivity to reveal relative loss of ganglion cells we suggest analysis of the symmetry between sectors of GCL+IPL topography. In a clinical setting, this is possible to do by comparing the maximum difference between sectors, which is normally less than 10 µm. If the thinning correlates to reduced VF sensitivity it should be regarded as a possible loss even when the measures are within the range of the normative database. The GCL+IPL pattern often predicts the pattern of the visual field damage better than peripapillary RNFL structure.
This multiple case study has a limited number of subjects but highlights the potential for OCT in identifying and characterising focal visual brain pathology and predicting the consequent visual field defects. Future work will be needed to profile the wider spectrum of lesions and their impact, their timings and the speed of degeneration.Citation20,Citation21 Another factor affecting visual field function outcome, besides location and extent of the lesion, is the reorganisation of the immature visual system that may normalise function, as described by Guzzetta et al. (2013).Citation22 However, as all cases in this study were selected because of homonymous visual field defects we did not and could not expect to find any proof of reorganisation. Mehta and Plant (2005) reported the association of congenital/long-standing visual field defects with RNFL OCT findings. In this study, we were able to confirm their observation by using GCL+IPL thickness measurements as a sensitive OCT outcome in individuals with pre-or postnatal injuries acquired at different stages of development.
Conclusion
We found convincing evidence of RTSD in all six cases we investigated, regardless of the developmental stage at which the retro-geniculate visual system was injured. The pattern of the GCL+IPL thinning corresponded with both the VF defects and the location and extent of the primary brain injury. The most salient sign of RTDS was asymmetry of GCL+IPL thicknesses between sectors in the macula. Analysis of GCL+IPL thickness, a non-invasive and quick investigation, may indicate damage to the retro-geniculate visual pathways as well as predicting VF outcome.
References
- Fledelius M. A propos de l’hémianopsie d’origine traumatique. Arch d’opht. 1934;51:561.
- Haddock JN, Berlin L. Transsynaptic degeneration in the visual system; report of a case. Arch Neurol Psychiatr. 1950;64(1):66–73. doi:10.1001/archneurpsyc.1950.02310250072006
- Dinkin M. Trans-synaptic retrograde degeneration in the human visual system: slow, silent, and real. Curr Neurol Neurosci Rep. 2017 Feb;17(2):16. doi:10.1007/s11910-017-0725-2.
- Jacobson L, Hellström A, Flodmark O. Large cups in normal-sized optic discs. A variant of optic nerve hypoplasia in children with periventricular leukomalacia. Arch Ophthalmol. 1997;115:1263–1269.
- Mehta J, Plant G. Optical coherence tomography (OCT) findings in congenital/long-standing homonymous hemianopia. Am J Ophthalmol. 2005;140:727–729. doi:10.1016/j.ajo.2005.03.059.
- Jindahra P, Petrie A, Plant G. Retrograde trans-synaptic retinal ganglion cell loss identified by optical coherence tomography. Brain. 2009;132:628–634. doi:10.1093/brain/awn334.
- Park HY, Park YG, Cho AH, Park CK. Transneuronal retrograde degeneration of the retinal ganglion cells in patients with cerebral infarction. Ophthalmology. 2013 Jun;120(6):1292–1299. doi:10.1016/j.ophtha.2012.11.021.
- Krägeloh-Mann I. Imaging of early brain injury and cortical plasticity. Exp Neurol. 2004;190:84–90. doi:10.1016/j.expneurol.2004.05.037.
- Lennartsson F, Nilsson M, Flodmark O, Jacobson L. Damage to the immature optic radiation causes severe reduction of the retinal nerve fibre layer – resulting in predictable visual field defects. Iovs. 2014;55:8278–8288.
- Dinkin M. Corresponding ganglion cell atrophy in patients with post-geniculate homonymous visual field loss. J Neuro-Ophthalmol. 2015;35: 353–359. doi:10.1097/WNO.0000000000000268
- Herro AM, Lam BL. Retrograde degeneration of retinal ganglion cells in homonymous hemianopsia. Clin Ophthalmol. 2015;9:1057–1064. doi:10.2147/OPTH.S81749.
- Lennartsson F, Nilsson M, Flodmark O, Jacobson L, Larsson J. Injuries to the immature optic radiation show correlated thinning of the macular ganglion cell layer. Front Neurol. 2018; 9:321. 2018 May 7. eCollection 2018. doi: 10.3389/fneur.2018.00321.
- Lennartsson F, Holmström L, Eliasson AC, et al. Advanced fiber tracking in early acquired brain injury causing cerebral palsy. AJNR. 2015;36:181–187. doi:10.3174/ajnr.A4072.
- Tournier J-D, Calamante F, Connelly A. MRtrix: diffusion tractography in crossing fiber regions. Int J Imaging Syst Technol. 2012; 22:53–66. doi:10.1002/ima.v22.1
- Ebeling U, Reulen HJ. Neurosurgical topography of the optic radiation in the temporal lobe. Acta Neurochir (Wien). 1988;92:29–36.
- Wärntges S, Michelson G. Detailed illustration of the visual field representation along the visual pathway to the primary visual cortex: a graphical summary. Ophthalmic Res. 2014;51:37–41. doi:10.1159/000355464.
- Mwansa JC, Oakley JD, Budenz DL, Chang RT, Knight OJ, Feuer WJ. Macular ganglion-cell inner plexiform layer: automated detection and thickness reproducibility with spectral domain-optical coherence tomography in glaucoma. IOVS. 2011;21:8323–8329.
- Totan Y, Gürağaç FB, Güler E. Evaluation of the retinal ganglion cell layer thickness in healthy Turkish children. J Glaucoma. 2015;24:e103–8. doi:10.1097/IJG.0000000000000168.
- Goh JP, Koh V, Chan YH, Ngo C. Macular ganglion cell and retinal nerve fiber layer thickness in children with refractive errors – an optical coherence tomography study. J Glaucoma. 2017;26:619–625. doi:10.1097/IJG.0000000000000683.
- Jindahra P, Petrie A, Plant GT. The time course of retrograde transsynaptic degeneration following occipital lobe damage in humans. Brain. 2012;135:534–541. doi:10.1093/brain/awr324.
- Schwartz G, Monroig A, Flynn H. Progression of transsynaptic retinal degeneration with spectral domain optical coherence tomography. Am J Ophthalmol Case Rep. Apr 2017;5:67–72. doi:10.1016/j.ajoc.2016.12.010.
- Guzzetta A, Fiori S, Scelfo D, Conti E, Bancale A. Reorganisation of visual fields after periventricular haemorrhagic infarction: potentials and limitations. Dev Med Child Neurol. 2013;55(Suppl.4):23–26. doi:10.1111/dmcn.12302.