
ABSTRACT
The present study was performed to evaluate the ganglion cell complex (GCC) thickness as well as the significance map and analyse the time course of the change in GCC thickness in patients with homonymous hemianopia due to posterior cerebral artery (PCA) territory stroke using spectral-domain optical coherence tomography. This study included 40 control subjects and 11 patients with unilateral PCA territory stroke. The GCC parameters were quantified using a custom-built software programme. The GCC data, centred on the macula, was divided vertically into hemianopic and unaffected sides. GCC parameters were calculated using an average of those from both eyes. The relationship between the GCC parameters and the time after stroke was determined by regression analyses. The GCC parameters in the hemi-retinae corresponding to the affected hemifields significantly differed between the hemianopes and the control group. The area under the receiver operating characteristics curve of the GCC significance map areas was significantly high. A regression analysis revealed a significant relationship between the time after stroke and both the GCC significance map areas (r = 0.791, p = .004) and GCC thickness (r = −0.736, p = .010) on the hemianopic side. The GCC parameters on the hemianopic side were reduced in patients with acquired occipital homonymous hemianopia, and the reduction was slowly progressive probably due to transsynaptic retrograde degeneration of the retinal ganglion cells. A significance map analysis provides additional OCT parameters that could be used to investigate the effect of retrogeniculate lesions on the inner retina of patients.
Introduction
Although experimental studies performed in adult monkeys have shown that the loss of retinal ganglion cells can occur after the removal of the occipital lobe,Citation1–Citation3 there has been some controversy over whether similar changes occur in the retinal ganglion cells after occipital lobe damage (such as the damage that occurs with an occipital stroke) in adult humans. Optical coherence tomography (OCT) studies of acquired occipital lobe lesions in humans have demonstrated circumpapillary retinal nerve fibre layer (cpRNFL) thinning with the use of time-domain OCT (TD-OCT),Citation4–Citation6 and later, spectral-domain OCT (SD-OCT).Citation7,Citation8 A recently published SD-OCT software programme has permitted the quantitative measurement of the retinal nerve fibre layer and the ganglion cell layer plus the inner plexiform layer of the macula. SD-OCT studies revealed inner macula retinal thinning in patients with acquired occipital lesions. In these SD-OCT studies, inner retinal thinning was observed in both the peripapillary and macular areas, in accordance with the patients’ hemianopic visual field defects.Citation9–Citation18 More recently, swept-source OCT (SS-OCT), which permits even faster scanning, has been used to study inner retinal thinning in homonymous hemianopia.Citation19
Recent advancements in spectral-domain optical coherence tomography (SD-OCT) has enabled the assessment of the RGC layer and the ganglion cell complex (GCC), which includes the retinal layers from the internal limiting membrane to the inner plexiform layer.Citation20 SD-OCT would make it possible to detect clinically insignificant optic atrophy. We reported the GCC thicknesses determined using RTVue-100 SD-OCT in three patients with homonymous hemianopia following unilateral posterior cerebral artery (PCA) territory infarction.Citation9 In these patients, GCC thinning was observed in accordance with the hemianopic visual field defects, despite the normal appearance of the fundus.
All parameters related to GCC measurements are colour-coded to indicate significant reductions in the GCC thickness. The size of the abnormal areas of the GCC was found to be the most pertinent parameter for detecting glaucoma.Citation21 Furthermore, the macular ganglion cell and inner plexiform layers (GCL+IPL) thickness deviation map showed a level of diagnostic performance that was comparable to that of the cpRNFL thickness deviation map in the detection of glaucomatous eyes with localised RNFL defects.Citation22 Thus far, little attention has been paid to the size of the affected areas of the GCC that are determined to be abnormal on significance maps in patients with visual disorders other than glaucoma. The SD-OCT devices statistically classify the thickness of each layer as abnormal, borderline, or normal as compared with the confidence intervals of the built-in normative database and display colour-coded significance maps in which the regions with abnormal or borderline thickness are shown in red or yellow. In the present study, for the purposes of a quantitative analysis on the ability to detect localised RGC defects we digitised the significance map results so that the number of abnormal superpixels could be counted by a customised image processing programme.
To date, the ability of macular GCC significance maps in RTVue-100 OCT to detect localised optic nerve damage in patients with homonymous hemianopia has not been demonstrated and the relationship between the size of the abnormal GCC areas and other OCT thickness parameters has not been investigated. Thus, this study was undertaken to analyse significance maps of the macular GCC thickness in patients with homonymous hemianopia due to posterior cerebral artery territory (PCA) stroke. In addition, the relationship between the time after the onset and the GCC thickness and significance map was investigated in both a cross-sectional and a longitudinal manner, in order to clarify the time course of the retinal changes. The present study also analysed the regional average GCC thickness and significance map to investigate its association with visual field defects in patients with homonymous hemianopia due to acquired post-geniculate visual pathway lesions.
Patients and methods
Subjects
All investigations adhered to the tenets of the Declaration of Helsinki, and this study was approved by the institutional review board and the ethics committee of Kawasaki Medical School. After explaining the nature and possible consequences of the study, written informed consent was obtained from all of the participating patients. The patients each had homonymous hemianopia due to unilateral retrogeniculate lesions, which had been diagnosed by magnetic resonance imaging (MRI). Normal age-matched subjects were enrolled as controls.
The participants included in this study met the following criteria: best-corrected visual acuity of >20/20, with a spherical equivalent between −6.0 and +3.0 dioptres and cylinder correction within ±3.0 dioptres. The ocular motility, intraocular pressure, anterior segments, media, and fundus (including red-free fundus photographs) were normal in both eyes. The patients were excluded if they met any of the following criteria: a history of retinal disease, including diabetic or hypertensive retinopathy; a history of eye trauma or surgery, with the exception of uncomplicated cataract surgery; optic nerve disease (including glaucoma); or a history of systemic or neurological disease other than cerebral stroke that may affect the visual field. The exclusion criteria also included evidence of more than one occipital lesion affecting the visual pathways.
Eleven patients with stroke in the PCA territory and 40 normal control subjects were included in this study. Each participant underwent a comprehensive ophthalmological assessment, including the measurement of the best-corrected visual acuity, slit-lamp biomicroscopy, tonometry, dilated stereoscopic examination of the optic nerve head and fundus, colour optic disc photography and red-free RNFL photography. The visual fields were obtained by static automated perimetry with a Humphrey visual field analyser (Carl Zeiss-Meditec, Inc., Dublin, CA, USA). Patients with homonymous hemianopia underwent assessment with a Humphrey visual field analyser using the central 30–2 Fastpac software programme. Normal control subjects were evaluated with a Humphrey visual field analyser using the central 30–2 Swedish Interactive Threshold Algorithm (SITA) programme. The visual field tests were considered reliable based on fixation losses of <20% and false-positive and false-negative errors of <15%. The visual field defects evaluated on the initial visit included the mean deviation (MD), as determined by a Humphrey visual field analyser.
Optical coherence tomography imaging
OCT images were obtained by RTVue-100 SD-OCT (RTVue-100, Optovue, Inc., Fremont, CA, USA), which acquires 26,000 A-scans per second and provides a 5 μm depth resolution in tissue. The RTVue-100 software programme (version 4.0) was used for data acquisition.
The GCC protocol was used to obtain macular measurements. This protocol consisted of one horizontal line scan of 7 mm in length (467 A scans) and 15 vertical line scans of 7 mm in length (each 400 A scans) at 0.5 mm intervals; the centre of the GCC scan was shifted 0.75 mm temporally to improve sampling of the temporal periphery. This scan configuration provided 14810 A scans in 0.58 seconds. The GCC thickness was measured from the inner limiting membrane (ILM) to the outer boundary of the inner plexiform layer (IPL). A built-in software programme allowed for automated segmentation not only of the total retina (from the ILM to the outer border of the retinal pigment epithelium) but also of the outer retina (from the inner border of the IPL to the outer border of the retinal pigment epithelium). The total retinal thickness, outer retinal thickness, GCC thickness, GCC thickness deviation map and GCC thickness significance map were obtained by GCC scans. The “Significance Map” was also colour-coded: green representing values within the normal range (p-value 5–95%), yellow indicating borderline results (P-value <5%), and red representing values outside the normal limits (p-value < 1%). Images were not included when the signal strength index was <40, when involuntary saccade or blinking artefacts were observed or when a careful visual inspection revealed algorithm segmentation failure. Eyes with any OCT scans where the retinal layer was poorly visualised were also excluded from analysis. The segmentation error was defined to be present if SD-OCT experienced technicians (S.A. and K.G.) judged that the segmentation used for the measurements of the retinal thickness was impossible. The SD-OCT results were analysed by Neuro-ophthalmology specialists (A.M., T.Y.).
The regional analysis of the GCC thicknesses and GCC significance maps
The regional analysis was performed on the basis of image data and xml output from the RTVue-100 system. We obtained the fovea position information from the xml file. The software programme calculated the average of the four divided regions using xml files, GCC map files, and GCC significance map files. The GCC thickness map file is a set of GCC thickness data (from the measurement data) that is represented by a data array of 933 × 933 pixels. GCC significance maps are displayed as jpeg images, which are captured by the RTVue-100. We divided GCC data into four quadrants around the fovea (superior temporal, inferior temporal, superior nasal, and inferior nasal quadrants). In this study, the GCC thickness and significance map on the hemianopic and unaffected sides were analysed using an average of both eyes. The analysed GCC data were extracted using a customised image processing software programme (SuperOne Co., Ltd., Tokyo, Japan). The GCC significance map is composed of red-yellow coded pixels that are derived from the GCC thickness map by comparison with a normative database.
Statistical analysis
The statistical analyses were performed using the IBM SPSS Statistics version 23.0 software programme (SPSS Japan, Inc., Tokyo, Japan). The data are presented as the mean ± standard deviation (SD). The Mann–Whitney U test and Fisher’s exact test were used to detect differences in the demographic characteristics of the normal control subjects and the patients with homonymous hemianopia. Differences in the GCC thickness parameters between the two hemifields were analysed using the Wilcoxon signed-rank test. The GCC thickness parameters were compared between the hemianopic sides of patients with cerebral artery lesions and normal eyes using the Mann–Whitney U test. The relationships between the GCC thickness parameters on the hemianopic side and the time after stroke and visual field defect (MD value) were evaluated with Spearman’s rank correlation coefficients. Additionally, Spearman’s correlation analysis was used to determine the correlation between the abnormal areas on the GCC significance map on the hemianopic side and the GCC parameters (GCC thickness, focal loss volume [FLV], and global loss volume [GLV]). P values of <0.05 were considered to indicate statistical significance in all analyses.
Results
There were no significant differences in age, gender, or spherical equivalent between the patients with homonymous hemianopia and the normal control subjects (). The clinical data of the patients are shown in . The ocular motility, intraocular pressure, anterior segments, media, and fundus (including red-free fundus photographs) were normal in both eyes. The mean MD value in the patients with homonymous hemianopia (as determined by a Humphrey visual field analyser) was −12.93 ± 3.70 dB (range −19.64 to −6.74 dB). The duration between the SD-OCT measurement and the onset of the occipital lobe lesion ranged from one month to 24.2 years (mean, 7.0 years).
Table 1. Characteristics of the study population.
Table 2. Patient demographics.
Cross-sectional study
The GCC thickness parameters on the hemianopic side were significantly reduced in comparison with the normal control eyes (p < .001 for all comparisons) (). The average thickness of the GCC was 83.01 ± 8.05 μm and 88.88 ± 8.43 μm on the hemianopic and unaffected sides, respectively, and was significantly thinner on the hemianopic side (p = .013) (). Additionally, the abnormal areas on the GCC thickness significance map (red, <1% level and yellow, <5% level) on the hemianopic side was 5.53 ± 3.55 mm2 in the brain lesion group, which was increased in comparison with the GCC thickness of the unaffected side (2.99 ± 3.25 mm2; p = .010) or that of the normal control eyes (0.08 ± 0.03 mm2; p < .001) (). shows the AUCs of the parameters for distinguishing the hemianopic side in patients with cerebral artery stroke from normal eyes. All AUCs for the GCC thickness on the hemianopic side were 1.00.
Table 3. The ganglion cell complex thickness and significance map parameters, as determined by optical coherence tomography.
The abnormal areas on the hemianopic side in the GCC significance map were significantly correlated with the GCC thickness, FLV, and GLV (r = −0.982, p = .001, r = 0.646, p = .032 and r = 0.782, p = .004, respectively). FLV is the total sum of statistically significant GCC volume loss divided by the GCC map area, in percentage. GLV is the sum of negative fractional deviation in the entire measurement area, in percentage.
A regression analysis revealed a linear relationship between the time after stroke and the GCC thickness parameters on the hemianopic side ( and –). Among the GCC thickness parameters on the hemianopic side, the GCC thickness significance map areas in red (p < 1% level) showed the strongest correlation with the time after stroke (). Additionally, the GCC thickness parameters on the hemianopic side were significantly correlated with the visual field defect in patients with homonymous hemianopia ( and ).
Table 4. Relationship between the mean of GCC thickness parameters on the hemianopic side, the GCC thickness significance map areas of both eyes and time following the stroke onset (months) in patients with homonymous hemianopia.
Table 5. Relationship between the mean GCC thickness parameters on the hemianopic side, the GCC thickness areas on significance maps of both eyes, and visual field defects in patients with homonymous hemianopia.
Figure 1. A regression analysis revealed a negative linear relationship (linear regression, r = −0.736, p = .010) between the time after stroke and the GCC thicknesses on the hemianopic side.
Figure 2. The area of abnormal GCC thickness on the hemianopic side was significantly correlated with the time after stroke (linear regression, r = 0.736, p = .010).
Figure 3. The area of normal GCC thickness on the hemianopic side was significantly correlated with the time after stroke (linear regression, r = −0.691, p = .019).
Figure 4. A scatter plot of the area of abnormal GCC thickness on the hemianopic side against the MD in patients with homonymous hemianopia. A regression analysis revealed a negative linear relationship (r = −0.600, p = .003) between the MD and the area of abnormal GCC thickness on the hemianopic side.
Longitudinal study
A total of 28 measurements from three patients (Cases 1–3) were analysed by a univariate linear regression analysis for each patient, with the mean GCC thickness parameters of both eyes as the outcome variable and elapsed time (days after stroke) as the explanatory variable (–). The values of all hemianopia patients tended to decrease during the period of measurement. In the three cases with significant regression coefficients, the initial measurements were made within six months of the onset of stroke. The rate of reduction in the GCC thickness ranged from 2.1–5.6 μm for each year of elapsed time ().
Figure 5. The time course of the GCC thickness and the area of abnormal GCC thickness on the hemianopic side in patients with homonymous hemianopia (Cases 1–3).
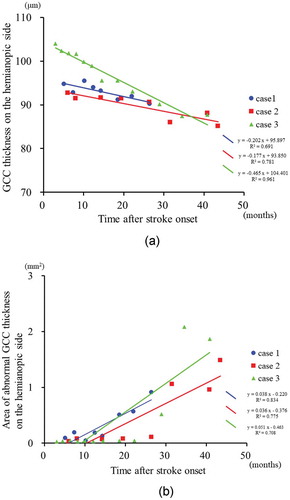
Figure 6. Patient 3. This 39-year-old woman had an infarct in the left posterior cerebral artery territory.
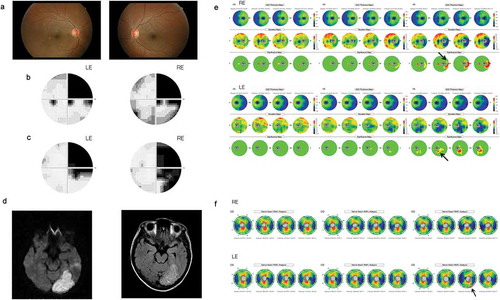
A clinical example is shown in . This 39-year-old woman suddenly noticed a right-sided visual field defect. Her best corrected visual acuity was 1.5 OU. The fundus (including red-free fundus photographs) () appeared to be normal in both eyes. A Humphrey visual field analyser showed right homonymous hemianopia, which was more dense superiorly (). MRI revealed an infarct in the left posterior cerebral artery territory of the brain (). At three months after the onset, the GCC thickness and the cpRNFL thickness OU were within the normal range in both eyes (). After 28 months, the areas with GCC thinning in both eyes were found to be in accordance with the hemianopic visual field defect (the nasal retina of the right eye and the temporal retina of the left eye) (). In the significance map of the cpRNFL thickness, there were areas with significant thinning in the inferior temporal portions of the right eye and the inferior temporal portions of the left eye ().
Discussion
OCT studies of acquired occipital lobe lesions in humans have demonstrated circumpapillary retinal nerve fibre layer (cpRNFL) thinning with the use of TD-OCT,Citation4–Citation6 and SD-OCT.Citation7–Citation9,Citation17 In the SD-OCT studies, inner retinal thinning was observed in both the peripapillary and macular areas, in accordance with the patients’ hemianopic visual field defects.Citation9–Citation16,Citation18,Citation23 GCC thinning has been demonstrated in the hemiretinae corresponding to the affected hemifields. Furthermore, macular measurements showed localised defects of RGCs more clearly than peripapillary measurements.Citation9,Citation11 In the present study, a reduction of the GCC thickness corresponding to the hemianopic visual field loss due to acquired post-geniculate visual pathway lesions was also detected using SD-OCT. Previous studies examined a large number of patients with cerebral infarction in various locations,Citation7,Citation15 but it was unclear whether each of the patients had homonymous visual field defects. In the present study, we only included patients with homonymous hemianopia due to occipital lobe lesions and excluded those with hemianopia due to optic tract lesions or in whom the cause of the visual field defects was unclear.
Additionally, we investigated the time-course of the change in GCC thickness using SD-OCT in patients with homonymous hemianopia due to post-geniculate lesions, in both cross-sectional and longitudinal manners. It has been reported that, within the first few years after cerebral infarction, cpRNFL thinning developed and subsequently became stable, showing a logarithmic relationship similar to that reported in occipital lobe lesions in monkeys.Citation3 Jindahra et al. reported that the rate of decline of the cpRNFL thinning after acquired occipital lobe damage was 9.08 μm per log year.Citation5 Park et al. reported that the rate of cpRNFL thinning in patients with various cerebral infarctions was 3.276 μm per log year.Citation7 Furthermore, our previous study suggested that the reduction in the GCL+IPL thickness is slowly progressive over a period of several years after the onset of PCA stroke.Citation18 This study confirms the finding that the time after the onset of stroke is significantly associated with the degree of transsynaptic retrograde degeneration. The GCC thickness parameters on the hemianopic side in patients with homonymous hemianopia were significantly correlated with the time after stroke.
In our results, the GCC thinning was not entirely limited to the affected side of the retina. The GCC thinning could be seen in the hemiretina corresponding to the unaffected hemifield as well. It may be partly explained by the fact that the nerve fibres of a particular retinal area do not necessarily originate from RGCs or photoreceptors in that area. Alternatively, there might have been effects of the brain damage on the other hemisphere.
To our knowledge, no studies have evaluated the diagnostic ability of GCC significance maps in identifying localised RGC damage in patients with homonymous hemianopia. Shin et al. investigated the 5% and 1% thinning area indices of the ganglion cell inner-plexiform layer and cpRNFL – as measured by Cirrus OCT – in patients with visual field defects that respected the vertical meridian and compared the measurements in the macula and around the optic disc.Citation11 They reported that macular GCIPL analysis clearly visualised a characteristic topographic pattern of RGC loss in these patients. The GCC thickness parameters on the hemianopic side were significantly correlated with the visual field defect. In our study, the GCC thickness and significance map were divided into the hemianopic and unaffected sides and then analysed in patients with homonymous hemianopia. In our longitudinal study, the GCC significance map after the onset of stroke showed thinning of the hemifield corresponding to visual field loss. This study investigated the diagnostic ability of the GCC significance map in RTVue SD-OCT. To analyse the diagnostic ability quantitatively, we digitised the significance map results so that the number of abnormal superpixels could be counted using a customised image processing software programme. The AUC of the GCC significance map areas and the averaged GCC thickness on the hemianopic side were found to be significantly high. Additionally, the GCC significance map areas were significantly correlated with the time after stroke and the mean deviation of the Humphrey visual field. Thus, GCC significance maps provide additional important OCT parameters when evaluating RGC damage in patients with homonymous hemianopia.
We analysed the relationship between the macular inner retinal layer thickness and visual field defects in order to elucidate the effects on RGCs in cases of post-geniculate visual pathway lesions. Jindahra et al. reported that the cpRNFL thickness was well-correlated with the MD in patients with homonymous hemianopic or quadrantanopic field loss.Citation6 We have previously reported that the reduction of the quadrantic cpRNFL thickness was significantly correlated with some of the visual field parameters, in accordance with the structure-function relationship. In the contralateral eyes, the temporal and inferior quadrant cpRNFL thickness were correlated with the MD and hemianopic field total deviation at 24 months. In the ipsilateral eyes, the superior, temporal, and inferior quadrant cpRNFL thickness was correlated with the MD.Citation17 It would be more difficult to determine the correlation between the visual field and the peripapillary thickness than the correlation between the visual field and macular thickness because the anatomical distribution around the optic disc is more complex than that in the macula. Our regression analysis revealed a negative linear or second-order polynomial relationship between the visual field defect and the GCC thickness parameters on the hemianopic side in patients with homonymous hemianopia.
Several limitations associated with the present study need to be considered. In this study, the sample size was relatively small. A future study of larger sample size should be conducted. Due to the retrospective study design, the follow-up periods of the patients are biased and two patients had a very long follow-up period. Further study including patients with various follow-up periods is necessary to support the results of our study.
In summary, a sector analysis of the GCC thickness, including a significance map analysis, by SD-OCT revealed inner retinal thinning corresponding to the visual field defects in patients with posterior cerebral artery territory stroke. Both the cross-sectional and longitudinal analyses showed that the inner retinal change was correlated with the time that elapsed after stroke. Moreover, the abnormal area on the hemianopic side in the GCC significance map was significantly correlated with the hemianopic visual field defect. Retrograde degeneration of the RGCs became easily apparent on SD-OCT after approximately two years and likely begins within a few months following injury to the visual cortex.
Declaration of interest statement
The authors declare no conflicts of interest in association with the present study.
Additional information
Funding
References
- Weller RE, Kaas JH. Parameters affecting the loss of ganglion cells of the retina following ablations of striate cortex in primates. Vis Neurosci. 1989;3:327–349.
- Niida T, Mukuno K, Ishikawa S, Iwai E. Transneuronal retrograde degeneration in adult monkey retina following ablation of the striate cortex. In: Iwai E, Mishkin M, eds. Vision, Memory, and the Temporal Lobe. New York: Elsevier; 1990:369–375.
- Cowey A, Stoerig P, Williams C. Variance in transneuronal retrograde ganglion cell degeneration in monkeys after removal of striate cortex: effects of size of the cortical lesion. Vision Res. 1999;39:3642–3652.
- Jindahra P, Petrie A, Plant GT. Retrograde trans-synaptic retinal ganglion cell loss identified by optical coherence tomography. Brain. 2009;132:628–634. doi:10.1093/brain/awp001.
- Jindahra P, Petrie A, Plant G. The time course of retrograde trans-synaptic degeneration following occipital lobe damage in humans. Brain. 2012;135:534–541. doi:10.1093/brain/awr324.
- Jindahra P, Petrie A, Plant GT. Thinning of the retinal nerve fibre layer in homonymous quadrantanopia further evidence for retrograde trans-synaptic degeneration in the human visual system. Neuro-ophthalmol. 2012;36:79–84. doi:10.3109/01658107.2012.674615.
- Park HY, Park YG, Cho AH, Park CK. Transneuronal retrograde degeneration of the retinal ganglion cells in patients with cerebral infarction. Ophthalmology. 2013;120:1292–1299. doi:10.1016/j.ophtha.2012.11.021.
- Gunes A, Inal EE, Demirci S, Tok L, Tok O, Demirci S. Changes in retinal nerve fiber layer thickness in patients with cerebral infarction: evidence of transneuronal retrograde degeneration. Acta Neurol Belg. 2016;116:461–466. doi:10.1007/s13760-015-0592-z.
- Yamashita T, Miki A, Iguchi Y, Kimura K, Maeda F, Kiryu J. Reduced retinal ganglion cell complex thickness in patients with posterior cerebral artery infarction detected using spectral-domain optical coherence tomography. Jpn J Ophthalmol. 2012;56:502–510. doi:10.1007/s10384-012-0146-3.
- Keller J, Sánchez-Dalmau BF, Villoslada P. Lesions in the posterior visual pathway promote trans-synaptic degeneration of retinal ganglion cells. PLoS One. 2014 23;9(5):e97444. doi:10.1371/journal.pone.0097444.
- Shin HY, Park HY, Choi JA, Park CK. Macular ganglion cell-inner plexiform layer thinning in patients with visual field defect that respects the vertical meridian. Graefes Arch Clin Exp Ophthalmol. 2014;252:1501–1507. doi:10.1007/s00417-014-2706-3.
- Herro AM, Lam BL. Retrograde degeneration of retinal ganglion cells in homonymous hemianopsia. Clin Ophthalmol. 2015;9:1057–1064. doi:10.2147/OPTH.S81749.
- Meier PG, Maeder P, Kardon RH, Borruat FX. Homonymous ganglion cell layer thinning after isolated occipital lesion: macular OCT demonstrates transsynaptic retrograde retinal degeneration. J Neuroophthalmol. 2015;35:112–116. doi:10.1097/WNO.0000000000000182.
- Mitchell JR, Oliveira C, Tsiouris AJ, Dinkin MJ. Corresponding ganglion cell atrophy in patients with postgeniculate homonymous visual field loss. J Neuroophthalmol. 2015;35:353–359. doi:10.1097/WNO.0000000000000268.
- Moon H, Yoon JY, Lim HT, Sung KR. Ganglion cell and inner plexiform layer thickness determined by spectral domain optical coherence tomography in patients with brain lesions. Br J Ophthalmol. 2015;99:329–335. doi:10.1136/bjophthalmol-2014-305361.
- Anjos R, Vieira L, Costa L, et al. Macular ganglion cell layer and peripapillary retinal nerve fibre layer thickness in patients with unilateral posterior cerebral artery ischaemic lesion: an optical coherence tomography study. Neuroophthalmology. 2016;40:8–15. doi:10.3109/01658107.2015.1122814.
- Goto K, Miki A, Yamashita T, et al. Sectoral analysis of the retinal nerve fiber layer thinning and its association with visual field loss in homonymous hemianopia caused by post-geniculate lesions using spectral-domain optical coherence tomography. Graefes Arch Clin Exp Ophthalmol. 2016;254:745–756. doi:10.1007/s00417-015-3181-1.
- Yamashita T, Miki A, Goto K, et al. Retinal ganglion cell atrophy in homonymous hemianopia due to acquired occipital lesions observed using Cirrus high-definition OCT. J Ophthalmol. 2016;2016:2394957. doi:10.1155/2016/2394957.
- Yamashita T, Miki A, Goto K, et al. Preferential atrophy of the central retinal ganglion cells in homonymous hemianopia due to acquired retrogeniculate lesions demonstrated using swept-source optical coherence tomography. Acta Ophthalmol. 2018;96:e538–e539. doi:10.1111/aos.13644.
- Tan O, Chopra V, Lu AT, et al. Detection of macular ganglion cell loss in glaucoma by Fourier-domain optical coherence tomography. Ophthalmology. 2009;116:2305–2314. doi:10.1016/j.ophtha.2009.05.025.
- Rimayanti U, Latief MA, Arintawati P, Akita T, Tanaka J, Kiuchi Y. Width of abnormal ganglion cell complex area determined using optical coherence tomography to predict glaucoma. Jpn J Ophthalmol. 2014;58:47–55. doi:10.1007/s10384-013-0281-5.
- Kim MJ, Park KH, Yoo BW, Jeoung JW, Kim HC, Kim DM. Comparison of macular GCIPL and peripapillary RNFL deviation maps for detection of glaucomatous eye with localized RNFL defect. Acta Ophthalmol. 2015;93:e22–28. doi:10.1111/aos.12485.
- Schwartz SG, Monroig A, Flynn HW Jr. Progression of transsynaptic retinal degeneration with spectral-domain optical coherence tomography. Am J Ophthalmol Case Rep. 2017;5:67–72. doi:10.1016/j.ajoc.2016.12.010.