
Abstract
Aim
Comparing the anxiety and depression severity and their impact on subsequent birth outcomes in pregnant women before and during Omicron wave in Shanghai in 2022.
Methods
The depression-anxiety symptoms networks were compared between the pregnant women during the outbreak period (outbreak group; n = 783) and a matched control group of pregnant women before the outbreak (pre-outbreak group; n = 783). The impact of baseline mental state on follow-up pregnancy and neonatal outcomes was also explored by logistic regression.
Findings
Levels of depression and anxiety between the two groups were not significant different. Network analysis showed that central symptom "trouble relaxing" and bridge symptom "depressed mood" shared by both groups. Different symptom associations in different periods of the pandemic. Total scores and sub-symptom scores of prenatal depressive and anxious severities increased the odds ratios of maternal and neonatal syndromes. The influence of mental state on gestational and neonatal outcomes differed across different pandemic periods.
Conclusion
The Omicron wave did not have a significant negative impact on the depressive and anxious mood in pregnant women. Targeting central and bridge symptoms intervention may be effective in reducing their adverse effects on co-occurring of anxious and depressive mood and birth outcomes.
Introduction
Since May 2020, Shanghai, China implemented a long-term policy of regular epidemic prevention and control. However, a wave of SARS-CoV-2 Omicron BA.2 infection rapidly appeared in Shanghai in late February 2022 [Citation1]. The resurgence of the pandemic showed such characteristics as rapid transmission, high transmissibility, high covert transmission, and complex chains of transmission, which not only threatened the public physical health but also had various degrees of psychological consequences for individuals and society [Citation2], especially for vulnerable group. Women tend to report higher symptoms of anxiety and depression during disease outbreaks than men [Citation3]. As a susceptible population for COVID-19 and mental problems, women who are pregnant during the COVID-19 pandemic faces greater psychological challenges. In general, approximately 10–15% of pregnant women experience diverse emotional changes that increase the risk of anxiety and depression [Citation4]. The effects of prenatal depression and anxiety may occur directly through the influence of related physiological changes on the developing fetus or indirectly through the effects of prenatal depression and anxiety on maternal health and pregnancy outcomes, which, in turn, affect infant health and development [Citation5]. During the outbreak, pregnant women expressed higher levels of concern for the health of their families and unborn children, as well as for their available maternal health care resources [Citation6]. This was a big stressor, which drove a large increase in their risk of depression and anxiety, potentially impairing their pregnancy and neonatal outcomes.
The previous research showed that the COVID-19 pandemic had a negative influence on the mental health of pregnant women worldwide [Citation7–12]. Previous studies have used group comparisons, regression, analysis of covariance, and subgroup analyses to explore the effects of pandemic risk factors on depressive and anxious severity in pregnant women. These studies were based on the latent variable model. This model regards the disorder as a latent entity causing the emergence and correlation of the symptoms [Citation13]. One of the advantages of our study is the use of network analysis. Network analysis is an emerging approach for conceptualizing psychopathology and comorbidity [Citation14]. Network analysis describes mental disorders as an interacting network of symptoms, focusing on specific symptoms or patterns of symptoms [Citation15]. The network structure consists of nodes that represent symptoms and edges that connect nodes and represent the relationships between them. Blue indicated positive correlations, and red indicated negative correlations. Thicker edges indicated stronger associations between two nodes. The central symptom represents the most important symptom in the network structure and is the key symptom associated with prognosis. Bridge symptoms represent symptoms that may contribute to the development and maintenance of two disorders. Network analysis provides many useful concepts to describe psychopathology and to explore issues related to the structure of psychological problems and their development and maintenance [Citation15]. Most of these studies on the psychological challenges faced by pregnant women during the pandemic focused on the period before and after the first outbreak of the 2020 pandemic. There were fewer studies on the mental state of pregnant women during the wave of Omicron infections. During this prolonged period of uncertainty, there may be new patterns of depressive and anxious states and symptom associations in pregnant women. One of the issues that concerned us was whether pandemic fluctuations have different effects on the mental health of pregnant women. Previous studies have used pregnancy complications to predict the levels of depression and anxiety in pregnant women, not vice versa, and it was possible that most of the pregnant women in their studies were in second or third trimester [Citation7,Citation11]. Another issue that concerns us is exploring the effect of depressive and anxious severity in early pregnancy on subsequent pregnancy and neonatal complications.
The present study aimed to investigate the mental status of pregnant women in their first trimester before and during the wave of Omicron infections in Shanghai, China in Shanghai, China. We would explore the depressive and anxious symptoms network and its impact on gestational and neonatal outcomes. This might be able to provide more references for maternal mental health care during public health emergencies such as COVID-19 pandemic.
Materials and methods
Participants
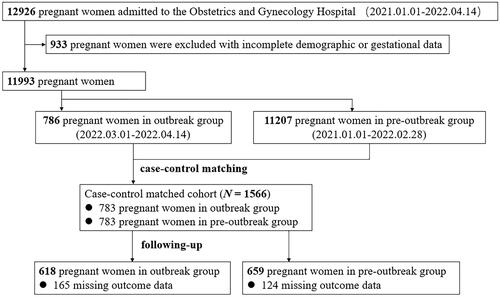
The present prospective case-control study included 12926 pregnant women admitted to the Obstetrics and Gynecology Hospital between January 1, 2021 and April 14, 2022. The inclusion criteria were as follows: (1) Pregnant women at greater risk of Omicron infection during the Shanghai outbreak between March 1, 2022 and April 14, 2022 (first local infection in Shanghai on March 1); (2) complete pregnancy archives; (3) no heart, liver, lung, kidney, or other vital organ diseases; no benign tumors. We excluded pregnant women with mental disorders, serious cognitive disorders, and illiteracy. A total of 786 pregnant women met the above criteria, defined as the outbreak group (OB group). We selected four matching variables in the OB group including age, type of household registration, education level and parity. Pregnant women in the pre-outbreak period were matched 1:1 using random number method and 783 pregnant women were randomly selected as the pre-outbreak group (POB group). A total of 783 pregnant women from each OB group and POB group entered final analysis, and these 1566 women were followed for gestational and neonatal outcomes. All diagnoses of maternal and neonatal conditions were managed by a professional team of obstetricians, neonatologists, and psychiatrists. This study was approved by the ethics committee of the Obstetrics and Gynecology Hospital. All pregnant women provided electronic informed consent.
Instruments
The electronic medical record system was used to extract the demographic information and general clinical data of the OB group and the POB group. At the time of baseline documentation, gravidity, parity, gestational age, recent history, past medical history, family history, pregnancy medication history, toxicants, pregnancy fever, and an exhaustive assessment of their pregnancy risk were obtained. The scores of the Patient Health Questionnaire (PHQ-9) and General Anxiety Disorder-7 (GAD-7), which were used to assess the severity of depression and anxiety, respectively, were also obtained from the electronic system. They are both screening scales. Scores of 5, 10, 15, and 20 in the PHQ-9 represent cut-points for mild, moderate, severe, and very severe depression, respectively [Citation16]. Scores of 5, 10, and 15 in GAD-7 represent cut-points for mild, moderate, and severe anxiety, respectively [Citation17]. Indicators of gestational outcome at follow-up include abortion, birth mode, intrapartum fever, perinatal infections, amniotic fluid abnormality, premature rupture of membrane (PROM), postpartum hemorrhage (PPH), gestational diabetes mellitus (GDM), hypertensive disorder complicating pregnancy (HDCP), and hypothyroidism in pregnancy. Indicators of neonatal outcome include preterm birth (PTB), low birth weight (LBW), neonatal hypoglycemia, neonatal respiratory disorders, neonatal digestive disorders or malformations, and neonatal neurological disorders.
Study design
This study was designed as a case-control study. We compared the differences in general clinical data and psychological characteristics between the OB and POB group with group comparisons and network analysis. Furthermore, we analyzed the influence of depressive and anxious severity at baseline on indicators of pregnancy and neonatal outcome at follow-up by regression ().
Figure 1. A flow chart of study subject recruitment, exclusion and loss of follow-up.
Statistical analysis
Intergroup comparison
The normally distributed continuous data were expressed as the mean and standard deviation (SD), and independent sample t-tests were performed to compare continuous variables with normal distributions. The non-normally distributed descriptive parameters were expressed as medians and interquartile range (IQR), and Mann-Whitney U tests were performed to compare the rank sum between the groups. Categorical variables were presented with numbers and percentages. The chi-square test was used to compare categorical variables between groups, and pairwise comparisons with Bonferroni correction were also conducted. A two-tailed P value < 0.05 was regarded as statistically significant. Data analysis was performed using SPSS 26.0.
Mixed graphical model network estimation
The R program was used to estimate the relational network of each variable for both groups. Within a network model, nodes represent symptoms, and edges represent the association between adjacent nodes [Citation18]. The mixed graphical model (mgm) is used when the data consists of both categorical and continuous variables and is implemented in the mgm package [Citation19]. Network visualization using the qgraph package. The layout of the node positions was computed with the Fruchterman-Reingold algorithm, which minimizes the number of crossing edges and keeps the length of the edges as equal as possible [Citation20]. Green edges indicate positive relationships, red edges indicate negative relationships, and grey edges indicate relationships involving categorical variables for which no sign is defined. The width of the edges is proportional to the absolute value of the edge weight.
Graphical Gaussian model network estimation
A graphic Gaussian model (GGM) was used to perform network analysis on continuous data. A regularized network was computed with the Least Absolute Shrinkage and Selection Operator (LASSO) and the Extended Bayesian Information Criterion (EBIC), which limited the number of spurious connections to generate a more interpretative and sparser network [Citation21]. To quantify the importance of each node in the network, expected influence (EI) was calculated with the qgraph package. This is more appropriate for networks consisting of both positive and negative edges than the traditional centrality index (i.e. strength centrality) [Citation22]. The greater the EI of a node, the closer it is to other nodes, representing its greater importance in the network. The networktools package was used to calculate bridge EI to identify bridge symptoms. To identify bridge symptoms, we used the 80th percentile of bridge EI values as a cutoff according to the recommendations of methodological articles [Citation23]. Symptoms with higher bridge EI values indicate a greater risk of spreading from one symptom to others [Citation14]. The bootnet package was used to assess the accuracy and stability of the network. A correlation stability coefficient (CS coefficient) was calculated to quantify the stability of the centrality index, which should be above 0.50 and not below 0.25 [Citation24]. Finally, we used NetworkComparisonTest package to compare network differences between the two groups.
Logistic regression
Continuous variables were standardized. As all indicators of subsequent pregnancy and neonatal outcome were binary variables, we explored the effect of total and sub-symptom scores for depression and anxiety features on them by logistic regression with R, after controlling age, education level, type of household registration, BMI, marriage age, gravidity and parity.
Results
Differences between the OB group and POB group at baseline
Among the initial 12,926 pregnant women, 13 had a history of COVID-19 infection in their medical history, none of the 1566 pregnant women we included. There was no significant difference between the two groups on the matching background variables. However, the OB group had significantly higher proportions of low BMI, family history, pregnancy risk, and marriage age. The OB group had significantly lower husband health and past medical history.
Overall, the prevalence of depression and anxiety in the OB group were 31.7% and 18.5%, and in the POB group were 34.2% and 20.2% (PHQ-9 ≥ 5, GAD-7 ≥ 5), with no significant difference between the two groups. Pregnant women in two groups showed no significant differences in either total GAD-7 scores (t = 1.687, p = 0.326) or total PHQ-9 scores (t = 0.982, p = 0.092). Further, there was also no significant difference in the distribution of depressive and anxious severity levels (according to the GAD-7 and PHQ-9 severity ratings; anxiety: χ2(3, N = 1566) =4.492, p = 0.213; depression: χ2(4, N = 1566) =3.256, p = 0.516) ().
Table 1. Comparison of demographic information and general clinical data of the outbreak group and the pre-outbreak group.
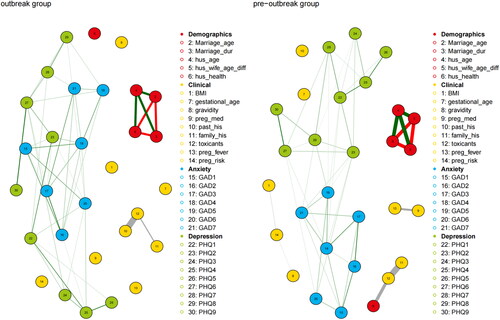
We also used the MGM network to analyze and visualize the relationships between the demographic information, general clinical information, and emotional states of the two groups of pregnant women. The results indicated little interaction between the communities in both periods and strong interconnectedness within the communities (). Within the community of demographic variables, strong positive correlations could be observed between marriage age, marriage duration, and spouse age difference in both groups, and a negative correlation between husbands’ age and them. There was a strong correlation between husbands’ health status and toxicants only in the POB group. Within the clinical data community, there was a strong correlation between toxicants and past medical history in the OB group; a strong correlation between toxicants and family history, pregnancy fever and pregnancy medication history in the POB group. There was a positive correlation between symptoms of depression and anxiety.
Figure 2. MGM network with the outbreak group (left) and the pre-outbreak group (right). Green edges indicated positive relationships, red edges indicated negative relationships and grey edges indicated relationships involving categorical variables for which no sign is defined. The width of the edges was proportional to the absolute value of the edge-parameter. The colors of the nodes mapped to the different domains Demographics, Clinical, Anxiety and Depression.Note: 3:Marriage_dur: Marriage duration; 4: hus_age: husband’s age; 5: hus_wife_age_diff: age difference between husband and wife; 6: hus_health: health status of the husband; 9: preg_med: Medicines during pregnancy; 10: past_his: past medical history; 11: family_his: family history; 13:preg_fever: fever in pregnancy; 14:preg_risk: pregnancy risk.
Comorbidity symptoms network of anxiety and depression
We used the GGM for anxious and depressive symptoms network analyses to explore specific patterns of associations of psychological symptoms during the pandemic ( and ). The top three strongest edges observed in the model were distributed within respective communities of mood problems. In the OB and POB group, the edge between PHQ6 and PHQ9 (OB: 0.39; POB: 0.37) was strongest, followed by edges PHQ4-PHQ5 (OB: 0.35; POB: 0.33), GAD2-GAD3 (OB: 0.31; POB: 0.33).
Figure 3. Comorbidity symptoms network of anxiety and depression with the outbreak group (left); bridge centrality index of symptoms network with the outbreak group (right).
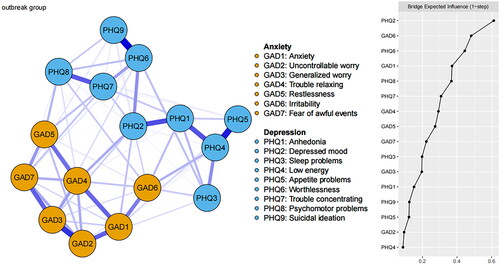
Figure 4. Comorbidity symptoms network of anxiety and depression with the pre-outbreak group (left); bridge centrality index of symptoms network with the pre-outbreak group (right).
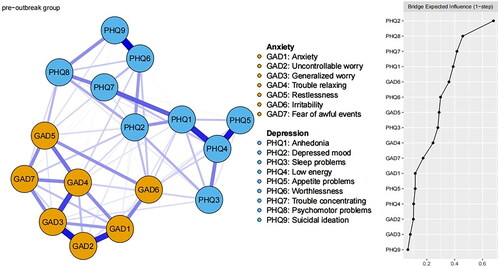
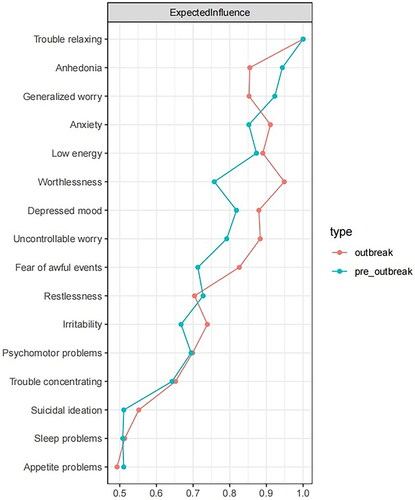
Centrality analyses showed that “Trouble relaxing” and “Worthlessness” had the largest EI values in the OB group. In the POB group, “Trouble relaxing” and “Anhedonia” had the largest EI values (). Regarding bridge symptoms, in the comorbidity symptoms network of the OB group, PHQ2 “Depressed mood,” GAD6 “Irritability” had the highest bridge EI values ( right). In the POB group, PHQ2 “Depressed mood,” PHQ8 “Psychomotor problems” had the highest bridge EI values ( right).
Figure 5. Centrality index of comorbidity symptoms network of anxiety and depression (red: outbreak group; blue: pre-outbreak group).
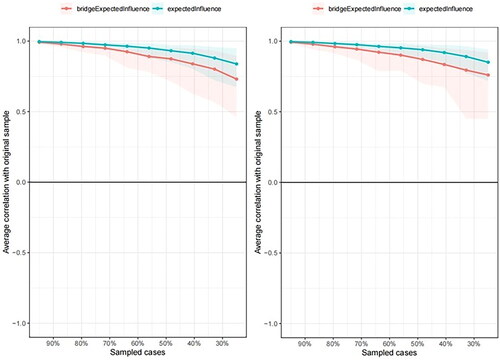
showed the stability coefficients for EI and bridge EI for both groups. The CS coefficients of EI in two groups were both 0.75, which indicated that EI were sufficiently stable. However, the CS coefficients of bridge EI in two groups were both 0.25 and which indicated that the order of bridge EI was interpretable with care. Network comparison showed there was no significant difference in network structure (p = 0.71), network global strength (p = 0.65), edge difference (p > 0.68), and EI difference.
Figure 6. Stability analysis results for expected influence and bridge expected influence in the outbreak group (left) and pre-outbreak group (right). Lines indicate the means and areas indicate the range from the 2.5th quantile to the 97.5th quantile.
Follow-up pregnancy outcomes and logistic analysis
In the OB group, 165 pregnant women dropped out (dropout rate = 21.1%) and 16 had abortion; in the POB group, 124 pregnant women dropped out (dropout rate = 15.8%) and 22 had abortion. The 289 who shed were younger; less educated, married at a younger age, had shorter marital durations, had younger husbands, and were at a younger gestational age. The chi-square test showed no significant association between the occurrence of abortion and the fluctuation of the epidemic (χ2(1) = 0.62, p = 0.431). To obtain the standardized coefficients, we standardized the continuous variables. Logistic regression indicated that total PHQ-9 and GAD-7 scores did not significantly predict gestational and neonatal outcomes in the OB group; total PHQ-9 scores negatively predicted the probability of GDM in the POB group (B = − 0.11, OR (95% CI) = 0.89 (0.82, 0.98), p = 0.019). We further analyzed the effect of the levels of depressive and anxious symptoms on the follow-up data (). Logistic regression indicated, GAD5 scores predicted the occurrence of abortion in the POB group alone (B = 0.41, OR (95% CI) = 1.51 (1.00, 2.27), p = 0.051).
Table 2. Logistic regression results for the levels of depressive and anxious symptoms on gestational and neonatal outcomes for the outbreak group and the pre-outbreak group.
Discussion
Principal findings
Since March 2022, Shanghai has faced one of the most serious challenges during the regular pandemic prevention and control of COVID-19. The daily lives of the local citizens have been inconvenienced of lockdown, and some people have even experienced mental health symptoms [Citation1]. This prospective case-control study used multiple statistical analyses to compare the effect of the pandemic’s resurgence on the mental state of pregnant women after a policy of regular pandemic prevention and control was implemented in Shanghai. Our results showed this Omicron wave did not have a significant negative impact on the overall state of depressive and anxious mood in pregnant women. Independent sample t-tests and network comparison analyses revealed the same conclusion that there were no significant differences. This was consistent with previous research [Citation9,Citation12]. More available information and reassurance were provided by social media, healthcare institutions and government departments during the regular pandemic prevention and control, thus pregnant women were less afraid of uncertainty than the first outbreak period [Citation9]. More importantly, during this Omicron wave, Shanghai’s overall vaccination coverage exceeded 90%. The supply of food and daily consumable was guaranteed, and social workers and many volunteers made a huge contribution to caring for the people in need from both material and psychological perspectives [Citation1]. The model of working from home saves daily commuting time and offers better indoor environmental quality conditions to work, allows pregnant women the freedom to adjust their working style and schedules. All of the above may reduce the perceived work stress and interpersonal stress of pregnancy, which may benefit mother and child outcomes [Citation25–28]. Moreover, compared with previous strains, the pathogenicity and clinical severity of Omicron BA.2 appeared to be weakened [Citation29]. All of the above helped pregnant women dealing with the fluctuation of the pandemic to maintain a stable mental state.
The MGM network analyses showed that symptoms of depression and anxiety in pregnant women in both groups were not associated with demographic and general clinical information. This may not ideally help us spotlight the scope of the susceptible group. Our results were inconsistent with previous studies in which the relationship with her husband and BMI were associated with depressive and anxious features [Citation7], which may be influenced by different demographic profiles.
Group differences in depression-anxiety symptoms network
Network analysis showed worthlessness (PHQ6) with suicidal ideation (PHQ9), low energy (PHQ4) with appetite problems (PHQ5), and uncontrollable worry (GAD2) with generalized worry (GAD3) were the three strongest associations in both groups. Partial strong associations between two specific nodes indicate that alleviating either symptom would improve both symptoms accordingly. Since data collected on feelings of depression and anxiety in first trimester of pregnancy, above results implied that depressive symptoms during the first trimester should be main targets in treatments to release mental distress in pregnant women to prevent negative outcomes including increased risk of suicidal ideation [Citation30,Citation31], overweight or obesity [Citation32], immune dysregulation and pro-inflammatory response [Citation33].
Centrality analysis can identify which symptoms are more important in the network, and these symptoms were the most likely candidates for triggering or maintaining remaining anxiety and depressive symptoms [Citation34]. There are no differences in core symptoms (trouble relaxing) for the OB and POB groups. “Trouble relaxing” is a physiological activation response to increased sympathetic and decreased parasympathetic nervous system activity [Citation35]. Anxiety in the first trimester of pregnancy increases plasma levels of cortisol and corticotrophin releasing hormone in the mother and fetus that may contribute to insulin resistance and behavior disorders in their offspring [Citation36]. This anxiety symptom characterizes distress experienced by groups in a period of regular pandemic prevention and control in response to future stress. It had the highest positive correlation with “anxiety” for the OB group and with “generalized worry” for the POB group. This result was consistent with the contrast avoidance model (CAM) of GAD [Citation37]. According to CAM, for reducing negative emotional contrasts, the pre-outbreak pregnant women who maintained a chronically negative state of generalized worry as a protective emotional defence against any possible future negative events made sense [Citation37]. When already in a period of outbreak, pregnant women have elevated health anxiety about infection [Citation6]. We found differences in core depressive symptoms, “worthlessness” for the OB group and “anhedonia” for the POB group. Pregnant women who suffered the inevitable negative public health events extensively may become learned helplessness and exhibit typical depressive symptoms like worthlessness and anhedonia [Citation38]. Our findings suggested a clinical utility for combining relaxation training with cognitive-behavioral therapy to directly target the core anxiety symptoms. Through behavior activation and cognitive restructuring, we can alleviate anxious features in the short term and, in turn, reduce the depressive severity [Citation39].
Bridge centrality analysis measures the symptoms that play a crucial role in the comorbidity of disorders. Consistent with previous research [Citation23,Citation40], “depressed mood” was the common bridge symptom for both groups, and both had the highest positive correlation with anhedonia. This indicated that the depressive mood of feeling down, depressed, or hopeless exhibited by pregnant women would worsen their anxiety during the fluctuations of the pandemic. The second significant bridge symptoms were “irritability” and “psychomotor problems” for the OB group and POB group, respectively. For pregnant women in the outbreak stage, both of their bridge symptoms were emotional symptoms and could be difficult to recognize. This required the pregnant women and their families to pay more attention to negative state of mind shifts. For the POB group, psychomotor retardation or agitation was a somatic depressive symptom and was more likely to be detected. Our intervention based on mindfulness-based approaches, relaxation exercises, or behavioral activation should be highly effective [Citation41]. Focusing on the bridge symptoms mentioned to intervene can be beneficial for breaking the cycle of symptoms for pregnant women at different stages of public health crisis.
The effects of depressive and anxious severity on gestational and neonatal outcomes
The dropout rate was greater than 15% in both OB and POB groups, which may be related to urban exodus for the reduction of jobs offered by offline services during the lockdown and the lower risk of infection in smaller cities. Our findings showed that depressive severity may be “protective” factors for GDM in the POB group. The result indicated that individuals with perceived high levels of stress showed signs of anhedonia traits and losing appetite [Citation42], which may lead to a reduced risk of obesity and GDM.
Logistic regression results showed that the levels of prenatal depressive and anxious symptoms affected gestational and neonatal outcomes. The majority of the preceding research offered an overall assessment of the effect of depressive and anxious severity on gestational and neonatal outcomes, whereas our findings provided detailed information at the symptom level. In the OB group, the odds of PROM increased by 96% for each unit increase in level of apparent anxious symptom “uncontrollable worry” in the early pregnancy. In the POB group, the odds of hypothyroidism in pregnancy increased by 105% for each unit increase in level of apparent anxious symptoms of “irritability”. Consistent with previous studies which have shown that prenatal depression and anxiety can increase the risk of PROM, GDM, HDCP, and thyroid-related disorders [Citation43–46]. In the POB group, the odds of intrapartum fever and PROM increased by 84% and 49% for each unit increase in level of apparent depressive symptoms of “trouble concentrating.” Our evidence supported that prenatal stress activates HPA and suppresses the immune system during and beyond pregnancy, and finally result in stressed mothers being more susceptible to infections and illnesses during pregnancy [Citation47].
We also found that stress in the first trimester can indirectly affect infant health by increasing the occurrence of adverse pregnancy outcomes. In the OB group, the odds of neonatal respiratory disorders increased by 219% for each unit increase in level of apparent anxious symptom “generalized worry”, and the odds of PTB increased by 117% for each unit increase in level of apparent depressive symptoms of “sleep problems”. In the POB group, the odds of abortion, PTB, neonatal respiratory disorders increased by 51%, 280%, 271% for each unit increase in level of apparent anxious symptoms of “restlessness”. LBW and neonatal hypoglycemia increased by 214%, and 298% for each unit increase in “fear of awful events”. Our results supported the previous results [Citation5]. The stress hormones transported through the placenta may suppress the developing immune system; reduce fetal blood flow and the supply of essential nutrients and oxygen, which, in turn, increased the likelihood of PTB, LBW, neonatal respiratory distress, and respiratory failure [Citation48–50]. Exposure to maternal antidepressants during pregnancy may be related to an increased risk of neonatal hypoglycemia in infants [Citation51].
Limitations
Several limitations of this study should be acknowledged. First, because our data were collected in a cross-sectional study design, causal relations and dynamic changes in depression and anxiety scores in the second and third trimester on birth outcomes could not be inferred. Second, this study focused on differences between different periods of the outbreak, so we did not systematic collect information on whether these pregnant women had been infected with COVID-19. And the available small number of COVID-19 related data on pregnant women who actively reported and took antigen tests did not satisfy the criteria for effective data analysis. Our results may not extend to pregnant women who were infected with COVID-19. Moreover, scales of PHQ-9 and GAD-7 may be incomplete to measure specific depressive and anxiety symptoms associated with pregnancy and pandemics. The more appropriate Edinburgh Postpartum Depression Scale (EPDS) was not used and future studies would benefit from the addition of the EPDS to our electronic medical record system in August 2022.
Conclusion
Our results showed that the resurgence of the pandemic after regular pandemic prevention and control did not have a significant negative impact on the overall state of depressive and anxious mood in pregnant women. Compared to the POB group, however, pregnant women in the OB period were at greater risk of anxiety. The depression-anxiety symptom network suggested that the symptoms of “trouble relaxing” and “depressed mood” should be highlighted and intervened on a priority basis in order to ensure mental health care for pregnant women during the pandemic. Prenatal depressive and anxious severity also influenced the risk of maternal and neonatal syndromes. And the influence of mental state on gestational and neonatal outcomes differed across different pandemic periods.
Ethical statement
The data used in this study were de-identified before use. All methods were performed in accordance with the Declaration of Helsinki. The Obstetrics and Gynecology Hospital of Fudan University Ethics Committee granted permission to access the raw data used in this study, number 2021-17, January 18, 2021.
Disclosure statement
The authors have no known conflict of interest to disclose.
Additional information
Funding
References
- Zhang X, Zhang W, Chen S. Shanghai’s life-saving efforts against the current omicron wave of the COVID-19 pandemic. Lancet. 2022;399(10340):1–14. doi:10.1016/S0140-6736(22)00838-8
- Wang C, Horby PW, Hayden FG, et al. A novel coronavirus outbreak of global health concern. Lancet. 2020;395(10223):470–473. doi:10.1016/S0140-6736(20)30185-9
- Wang C, Pan R, Wan X, et al. Immediate psychological responses and associated factors during the initial stage of the 2019 coronavirus disease (COVID-19) epidemic among the general population in China. Int J Environ Res Public Health. 2020;17(5):1729. doi:10.3390/ijerph17051729
- National Collaborating Centre for Mental Health (UK). Antenatal and postnatal mental health: clinical management and service guidance: updated edition. Leicester (UK): British Psychological Society; 2014.
- Coussons-Read ME. Effects of prenatal stress on pregnancy and human development: mechanisms and pathways. Obstet Med. 2013;6(2):52–57. doi:10.1177/1753495X12473751
- Corbett GA, Milne SJ, Hehir MP, et al. Health anxiety and behavioural changes of pregnant women during the COVID-19 pandemic. Eur J Obstet Gynecol Reprod Biol. 2020;249:96–97. doi:10.1016/j.ejogrb.2020.04.022
- Ayaz R, Hocaoğlu M, Günay T, et al. Anxiety and depression symptoms in the same pregnant women before and during the COVID-19 pandemic. J Perinat Med. 2020;48(9):965–970. doi:10.1515/jpm-2020-0380
- Durankuş F, Aksu E. Effects of the COVID-19 pandemic on anxiety and depressive symptoms in pregnant women: a preliminary study. J Maternal-Fetal Neonatal Med. 2022;35(2):205–211. doi:10.1080/14767058.2020.1763946
- Kotabagi P, Fortune L, Essien S, et al. Anxiety and depression levels among pregnant women with COVID‐19. Acta Obstet Gynecol Scand. 2020;99(7):953–954. doi:10.1111/aogs.13928
- Lebel C, MacKinnon A, Bagshawe M, et al. Elevated depression and anxiety symptoms among pregnant individuals during the COVID-19 pandemic. J Affect Disord. 2020;277:5–13. doi:10.1016/j.jad.2020.07.126
- Wu Y, Zhang C, Liu H, et al. Perinatal depressive and anxiety symptoms of pregnant women during the coronavirus disease 2019 outbreak in China. Am J Obstet Gynecol. 2020;223(2):240. e241–240. e249. doi:10.1016/j.ajog.2020.05.009
- Hessami K, Romanelli C, Chiurazzi M, et al. COVID-19 pandemic and maternal mental health: a systematic review and meta-analysis. J Maternal-Fetal Neonatal Med. 2022;35(20):4014–4021. doi:10.1080/14767058.2020.1843155
- McNally RJ. Network analysis of psychopathology: controversies and challenges. Annu Rev Clin Psychol. 2021;17(1):31–53. doi:10.1146/annurev-clinpsy-081219-092850
- Jones PJ, Ma R, McNally RJ. Bridge centrality: a network approach to understanding comorbidity. Multivariate Behav Res. 2021;56(2):353–367. doi:10.1080/00273171.2019.1614898
- Contreras A, Nieto I, Valiente C, et al. The study of psychopathology from the network analysis perspective: a systematic review. Psychother Psychosom. 2019;88(2):71–83. doi:10.1159/000497425
- Kroenke K, Spitzer RL, Williams JB. The PHQ‐9: validity of a brief depression severity measure. J Gen Intern Med. 2001;16(9):606–613. doi:10.1046/j.1525-1497.2001.016009606.x
- Spitzer RL, Kroenke K, Williams JB, et al. A brief measure for assessing generalized anxiety disorder: the GAD-7. Arch Intern Med. 2006;166(10):1092–1097. doi:10.1001/archinte.166.10.1092
- Epskamp S, Cramer AO, Waldorp LJ, et al. Network visualizations of relationships in psychometric data. J. Stat. Soft. 2012;48(4):1–18. doi:10.18637/jss.v048.i04
- Haslbeck JMB, Waldorp LJ. Mgm: estimating time-varying mixed graphical models in high-dimensional data. J. Stat. Soft. 2020;93(8):1–46. doi:10.18637/jss.v093.i08
- Fruchterman TM, Reingold EM. Graph drawing by force‐directed placement. Softw Pract Exp. 1991;21(11):1129–1164. doi:10.1002/spe.4380211102
- Epskamp S, Fried EI. A tutorial on regularized partial correlation networks. Psychol Method. 2018;23(4):617–634. doi:10.1037/met0000167
- Robinaugh DJ, Millner AJ, McNally RJ. Identifying highly influential nodes in the complicated grief network. J Abnorm Psychol. 2016;125(6):747–757. doi:10.1037/abn0000181
- Garabiles MR, Lao CK, Xiong Y, et al. Exploring comorbidity between anxiety and depression among migrant Filipino domestic workers: a network approach. J Affect Disord. 2019;250:85–93. doi:10.1016/j.jad.2019.02.062
- Epskamp S, Borsboom D, Fried EI. Estimating psychological networks and their accuracy: a tutorial paper. Behav Res Method. 2018;50(1):195–212. doi:10.3758/s13428-017-0862-1
- Mohammed Z, Nandwani D, Saboo A, et al. Job satisfaction while working from home during the COVID-19 pandemic: Do subjective work autonomy, work-family conflict, and anxiety related to the pandemic matter? Cogent Psychol. 2022;9(1):2087278. doi:10.1080/23311908.2022.2087278
- Xiao Y, Becerik-Gerber B, Lucas G, et al. Impacts of working from home during COVID-19 pandemic on physical and mental well-being of office workstation users. J Occup Environ Med. 2021;63(3):181–190. doi:10.1097/JOM.0000000000002097
- Lee BE, Ha M, Park H, et al. Psychosocial work stress during pregnancy and birthweight. Paediatr Perinat Epidemiol. 2011;25(3):246–254. doi:10.1111/j.1365-3016.2010.01177.x
- Jensen SK, Dumontheil I, Barker ED. Developmental inter‐relations between early maternal depression, contextual risks, and interpersonal stress, and their effect on later child cognitive functioning. Depress Anxiety. 2014;31(7):599–607. doi:10.1002/da.22147
- Wang B, Yu Y, Yu Y, et al. Clinical features and outcomes of hospitalized patients with COVID-19 during the omicron wave in shanghai. J Infect. 2023;86(1):e27–e29. doi:10.1016/j.jinf.2022.08.001
- Chen C, Okubo R, Okawa S, et al. The prevalence and risk factors of suicidal ideation in pregnancy and the postpartum under the COVID-19 pandemic in Japan. Psychiatry Clin Neurosci. 2023;77(5):300–301. doi:10.1111/pcn.13538
- Xiao M, Hu Y, Huang S, et al. Prevalence of suicidal ideation in pregnancy and the postpartum: a systematic review and meta-analysis. J Affect Disord. 2022;296:322–336. doi:10.1016/j.jad.2021.09.083
- Landaeta-Díaz L, González-Medina G, Agüero SD. Anxiety, anhedonia and food consumption during the COVID-19 quarantine in Chile. Appetite. 2021;164:105259. doi:10.1016/j.appet.2021.105259
- AE, Malavazos M, MC, Romanelli F, Bandera, et al. Targeting the adipose tissue in COVID‐19. Obesity (Silver Spring). 2020;28(7):1178–1179. doi:10.1002/oby.22844
- McElroy E, Fearon P, Belsky J, et al. Networks of depression and anxiety symptoms across development. J Am Acad Child Adolesc Psychiatr. 2018;57(12):964–973. doi:10.1016/j.jaac.2018.05.027
- Andor T, Gerlach AL, Rist F. Superior perception of phasic physiological arousal and the detrimental consequences of the conviction to be aroused on worrying and metacognitions in GAD. J Abnorm Psychol. 2008;117(1):193–205. doi:10.1037/0021-843X.117.1.193
- Weinstock M. The long-term behavioural consequences of prenatal stress. Neurosci Biobehav Rev. 2008;32(6):1073–1086. doi:10.1016/j.neubiorev.2008.03.002
- Llera SJ, Newman MG. Rethinking the role of worry in generalized anxiety disorder: evidence supporting a model of emotional contrast avoidance. Behav Ther. 2014;45(3):283–299. doi:10.1016/j.beth.2013.12.011
- Abramson LY, Metalsky GI, Alloy LB. Hopelessness depression: a theory-based subtype of depression. Psychol Rev. 1989;96(2):358–372. doi:10.1037/0033-295X.96.2.358
- Wittchen HU, Kessler R, Pfister H, et al. Why do people with anxiety disorders become depressed? A prospective‐longitudinal community study. Acta Psychiatr Scand. 2000;102(s406):14–23. doi:10.1111/j.0065-1591.2000.acp29-03.x
- Bai W, Xi H-T, Zhu Q, et al. Network analysis of anxiety and depressive symptoms among nursing students during the COVID-19 pandemic. J Affect Disord. 2021;294:753–760. doi:10.1016/j.jad.2021.07.072
- Kaiser T, Herzog P, Voderholzer U, et al. Unraveling the comorbidity of depression and anxiety in a large inpatient sample: network analysis to examine bridge symptoms. Depress Anxiety. 2021;38(3):307–317. doi:10.1002/da.23136
- Hyldelund NB, Frederiksen C, Byrne DV, et al. Is stress taking the pleasure out of food?-a characterization of the food pleasure profiles, appetite, and eating behaviors of people with chronic stress. Foods. 2022;11(13):1980. doi:10.3390/foods11131980
- Dayan J, Creveuil C, Marks MN, et al. Prenatal depression, prenatal anxiety, and spontaneous preterm birth: a prospective cohort study among women with early and regular care. Psychosom Med. 2006;68(6):938–946. doi:10.1097/01.psy.0000244025.20549.bd
- Lin T-T, Zhang C, Zhang H-Q, et al. Thyroid hormone changes in early pregnancy along with the COVID-19 pandemic. Front Endocrinol (Lausanne). 2020;11:606723. doi:10.3389/fendo.2020.606723
- Sargent IL, Borzychowski AM, Redman CW. NK cells and human pregnancy–an inflammatory view. Trends Immunol. 2006;27(9):399–404. doi:10.1016/j.it.2006.06.009
- Raina J, El-Messidi A, Badeghiesh A, et al. Pregnancy hypertension and its association with maternal anxiety and mood disorders: a population-based study of 9 million pregnancies. J Affect Disord. 2021;281:533–538. doi:10.1016/j.jad.2020.10.058
- Rogers LK, Velten M. Maternal inflammation, growth retardation, and preterm birth: insights into adult cardiovascular disease. Life Sci. 2011;89(13-14):417–421. doi:10.1016/j.lfs.2011.07.017
- Coussons-Read ME. Stress and immunity in pregnancy. In: Suzanne CS, editor, The oxford handbook of psychoneuroimmunology. New York: Oxford University Press; 2012. doi:10.1093/oxfordhb/9780195394399.013.0001
- Lee KW, Ching SM, Hoo FK, et al. Neonatal outcomes and its association among gestational diabetes mellitus with and without depression, anxiety and stress symptoms in Malaysia: a cross-sectional study. Midwifery. 2020;81:102586. doi:10.1016/j.midw.2019.102586
- Ogunyemi D, Jovanovski A, Liu J, et al. The contribution of untreated and treated anxiety and depression to prenatal, intrapartum, and neonatal outcomes. AJP Rep. 2018;8(3):e146–e157. doi:10.1055/s-0038-1661379
- Uguz F, Department of Psychiatry, Necmettin Erbakan University Meram School of Medicine, Konya, Turkey. The relationship between maternal antidepressants and neonatal hypoglycemia: a systematic review. Alpha Psychiatr. 2021;22(5):224–229. doi:10.5152/alphapsychiatry.2021.21143