
 ?Mathematical formulae have been encoded as MathML and are displayed in this HTML version using MathJax in order to improve their display. Uncheck the box to turn MathJax off. This feature requires Javascript. Click on a formula to zoom.
Abstract
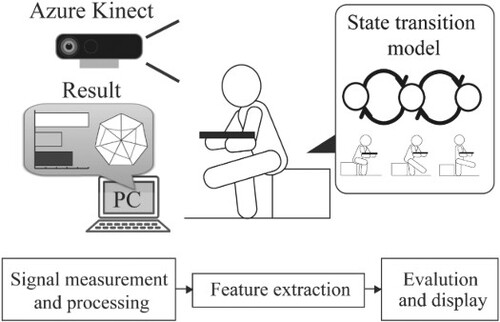
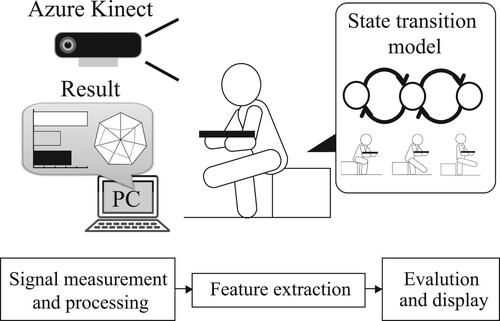
This paper developed a simple and quantitative evaluation system for a single-leg standing test. The proposed method represents the stand-up motion as a state transition model by quantitative measurement using a camera with a depth sensor (Azure Kinect) and a force plate. It objectively evaluates the movement of each state. In the experiment using the prototype, the evaluation results by the system and the skilled athletic trainer were the same for all subjects, and the shape of the radar chart was different among the subjects whose evaluation scores were the same. The results show that the proposed system can be quantitative evaluation even at worksites without skilled evaluators.
GRAPHICAL ABSTRACT
1. Introduction
The average age of workers in Japan has been increasing, and a survey by the Ministry of Health, Labour and Welfare reported that the average age was 43.2 years old in 2020 [Citation1]. This is because older workers are increasingly entering the workforce. Consequently, the number of deaths and injuries due to industrial accidents involving workers aged 60 years or older is also increasing [Citation2]. Among industrial accidents, falls are the most frequent cause accounting for 24% of fatalities and injuries in 2020 [Citation2]. Thus, falls in the workplace are a severe problem, and solutions are needed to prevent them.
Many kinds of research for fall prevention evaluate the motor function involved in maintaining upright stationary and walking states. Niino et al. conducted a study to elucidate fall mechanisms via stimulation experiments involving stumbling, slipping and other fall factors [Citation3]. Doi et al. evaluated the comparison of walking conditions such as walking speed and fall history among elderly people, and reported that the risk of fall is higher as the walking speed is slower [Citation4]. The Ministry of Health, Labour and Welfare has developed guidelines for the prevention of industrial accidents [Citation5]. These guidelines require both employers and older workers to objectively assess their physical fitness status. By way of example for assessing physical fitness status, Jones et al. proposed the 30-second chair stand test (CS-30) [Citation6]. This test evaluates the lower limb muscle strength of the elderly according to the number of times they can stand up from a chair within 30 s. Various researchers have investigated the relationship between the height at which a person can stand up and lower limb muscle strength [Citation7,Citation8]. A method in the field has proposed ‘safety strength’ functionnal test by Nagara et al. for objectively assessing the physical fitness of workers [Citation9]. This test includes several physical fitness test items: grip strength, seated forward bend, a single-leg standing test, and so on. This program was implemented to prevent industrial accidents caused by declining motor function due to aging or a lack of exercise. This program can provide training menus for individual subjects whose functions are judged to have declined based on the evaluation results. Nagara et al. reported that the number of accidents involving falls had decreased annually in the JFE Steel Corporation due to the program's continuous implementation since 2004 [Citation10]. Thus, although this test is a very effective method for preventing occupational accidents, including falls, it faces two major challenges.
Accurate evaluation is difficult unless a skilled evaluator since part of the test is visual evaluation. Therefore, it is essential to develop a method that enables quantitative evaluation regardless of the evaluator's skill level.
The single-leg standing test is a five-point scale, making it difficult to evaluate and quantify the movement state in detail. Differences between subjects with the same score cannot be noted.
The authors have proposed a simple and quantitative evaluation system for the single-leg standing test in ‘safety strength’ functionnal test [Citation11]. The proposed system objectively evaluated the standing up motion by quantitative measurements using an RGB camera and force plate. However, there was a problem that accuracy degradation occurred when measuring motion with the RGB camera.
This paper proposes a novel single-leg standing test evaluation system using a camera with a depth sensor (Azure Kinect) and a force plate. The standing-up movement is represented by a state transition model and evaluated objectively for each state. The evaluation results were output as a 5-level evaluation score, which was the same as the conventional method. The experiment compared the proposed method with ratings provided by a skilled athletic trainer. This paper also discusses whether a more detailed evaluation is possible by calculating various evaluation indices from the joint position information obtained from Azure Kinect.
2. ‘Safety strength’ functionnal test [9]
Nagara et al. have developed a ‘safety strength’ functionnal test to diagnose safety fitness and prevent employee falls. The report shows that the number of falls among workers over 50 years old has decreased since the year following the program's start. As older ages can implement these methods, they have attracted widespread attention as an effective way to prevent fall injuries.
This test consisted of fall risk tests (balance walk, two-step test, single-leg standing), back pain risk tests (sit-up test, seated forward bend), and handling tests (grip strength, arm lift). The evaluator gives a visual rating of the fall risk tests on a 5-point scale. If a score of the test is less than 2 points, intervention programs for functional recovery is implemented.
In particular, the single-leg standing test requires evaluation by focusing on multiple parts of the subject's trunk and legs simultaneously and is employed as a test to evaluate lower limb muscle strength to support body weight. The subjects were then asked to hold a drawing board with a 500 ml plastic bottle half-filled with water and stand up with a single leg straight outstretched. The standing-up posture was maintained for 3 seconds. The following three points were evaluated in a series of movements as shown in Figure .
Whether the pivoting leg moved
Whether the drawing board moved away from the body
Whether the outstretched knee was bent
Figure 1. Evaluation method of the single-leg standing test [Citation9].
![Figure 1. Evaluation method of the single-leg standing test [Citation9].](/cms/asset/edbd864e-6462-40ce-a4e1-57172a13860a/tadr_a_2132833_f0001_ob.jpg)
The evaluation score is out of five points, and one point was deducted for each deduction item. If the subject could not stand up, the evaluation score is 1. Thus, the single-leg standing test requires visual evaluation by focusing on multiple parts of the subject, and accurate assessment is difficult unless the evaluator is skilled. Accordingly, there is a need for a method that enables quantitative evaluation without influencing the evaluator's skill level.
3. Evaluation system for the single-leg standing test
Figure illustrates the proposed approach, which involves the use of a Balance Wii Board ©Nintendo 2007 and a Microsoft Azure Kinect ©Microsoft 2020 for COP (center of pressure) and joint positions of the subject's body determination. The details of this system are described below.
Figure 2. Overview of the prototype system.
3.1. Signal monitoring and preprocessing
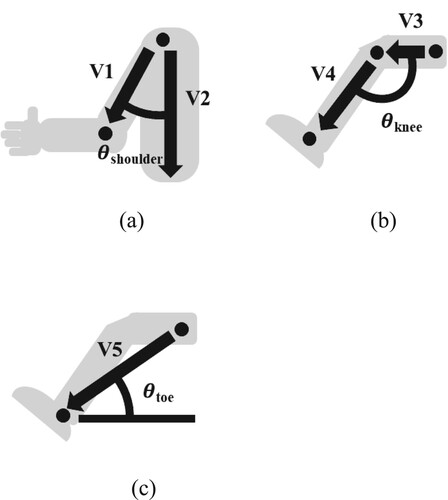
The system acquires the 3-axis coordinates of each joint of the subject using Azure Kinect to evaluate the state of standing-up. The center of pressure (COP) is also measured using a Balance Wii Board. Joint angles such as shoulder, knee, and toe were calculated based on skeletal information estimated using Azure Kinect Body Tracking SDK as shown in Figure . By way of example, the shoulder joint angle is defined using the shoulder-elbow vector
and the neck-waist vector
by the following equation.
(1)
(1) Finally, the joint angles were converted into angular velocity and acceleration information by passing it through a differential filter.
Figure 3. Joint angle model. (a) Shoulder joint angle. (b) Knee joint angle. (c) Toe joint angle.
Foot pressure and COP
were measured using a Balance Wii Board. The Balance Wii Board had four force sensors at the corners. When the weights of each sensor were defined
,
,
and
, and the total weight was W, the COP value was calculated as follows:
(2)
(2)
(3)
(3) These features were used to evaluate whether the subject could stand up and the degree of wobbliness during standing up.
3.2. Transition model for single-leg standing
In the proposed method, a transition model was constructed to represent single-leg standing behavior by dividing it into multiple states, as shown in Figure and Table . The transition model is constructed using 7 place and 6 transitions
. Here, the initial state
is the sitting state. Subsequently, the similarity to the ideal standing state predefined based on the joint angle and foot pressure information is evaluated. The transition from sitting (
) to raising the right leg (
) occurs when the right knee angle exceeds a threshold value. In the condition with the left leg as the pivoting leg, the model judges successful standing when the subject transitions from a sitting state (
) to a fully standing state (
). The system calculates and evaluates some indices from the standing transition state (
,
) to the fully standing state (
).
Figure 4. Transition model for single-leg standing.
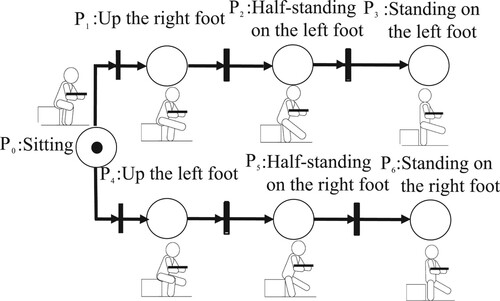
Table 1. Places and transitions.
3.3. Evaluation index
The system calculates the following 15 indices.
: maximum right-shoulder angle
Here, the number of measurement samples is n, and t is the sample variance. Maximum right-shoulder angle () is calculated by the following formula.
(4)
(4)
and
are calculated in the same way.
Mean angle (–
) is calculated using Equation (Equation5
(5)
(5) ).
(5)
(5) Maximum change in foot pressure (
), mean change of foot pressure (
) and distribution of foot pressure (
) are defined as the movement of the pivoting foot.
(6)
(6)
(7)
(7)
(8)
(8) Distribution of
and
(
,
) are defined as the dispersion from the average COP with the same formula as Equation (Equation8
(8)
(8) ). The frontal and sagittal width of COP are defined as the difference between the maximum and minimum values of each COP coordinate as calculated as follows.
(9)
(9) Rectangle area of COP indicates the movement range of the COP calculated using
and
.
(10)
(10)
(11)
(11)
(12)
(12) The following four evaluation items are then judged by comparing the change in each joint angle with the ideal movement.
Whether the pivoting leg moved
Whether the drawing board moved away from the body
Whether the outstretched knee was bent
Whether the subject stood up
Evaluation item (i) and (ii) are evaluated using and
, respectively. These points are deducted when they exceed a threshold value set based on preliminary experiments. Similarly, (iii) deducts points when the maximum knee angle (
) falls below a threshold value. Finally, the system calculates a 5-point evaluation score. If the stand-up transition model determines that the subject could not stand up, the score is 1.
Standardization of the relevant index values here is performed in consideration of a control group (e.g. a group of subjects with an evaluation score of 5), with indices ( :
) determined from the standard deviation (
) and mean (
) of standard-subject figures for individual index values.
(13)
(13) Application of
supports determination of discrepancies between values from the control group and recorded data. Furthermore, the standing state is evaluated comprehensively by taking the weighted sum of
with
.
(14)
(14)
3.4. Graphic display
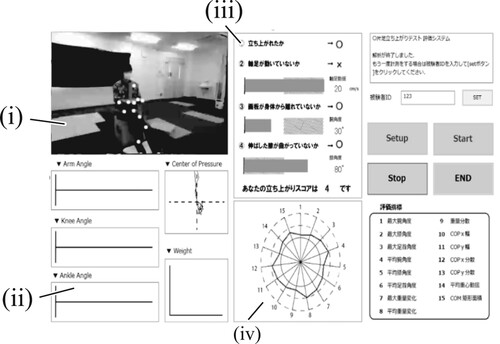
Figure shows plots of recorded data and index values, with (i) depicting a subject in Azure Kinect. The system shows evaluation results for joint location, skeleton tracking. Figure (ii) show joint angles, while (iii) indicate a score sheet for stand-up evaluation, respectively. Radar charts of 15 evaluation indices are given in Figure (vi).
Figure 5. System screen. (i) Images from Azure Kinect. (ii) Joint angles. (iii) Evaluation results. (iv) Radar chart.
4. Experiments
4.1. Method
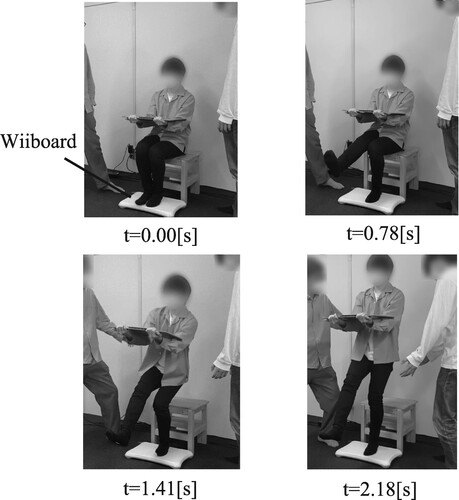
In the study's experiment, 8 unimpaired young subjects (average age: ; A–D,G : male; E–F : female). were monitored to verify the proposed method. Testing involved the use of Microsoft Azure Kinect ©Microsoft 2020 and a Nintendo Wii Balance Board ©Nintendo 2007 with sampling frequencies of 30 and 100 Hz, respectively. Subjects were asked to seat on a 40-cm cardboard. Joint coordinate positions are estimated using Azure Kinect's Body Tracking SDK. The subject was asked to stand with one leg extended while holding the drawing board as shown in Figure , and one trial was performed. In order to prevent falling while standing up, assistants was always present at the subject's side. An evaluation by a skilled athletic trainer (AT), who routinely evaluates the single-leg standing test was also conducted simultaneously. This study was conducted under the review of the Research Ethics Committee of the Prefectural University of Hiroshima (No. 15MH070).
Figure 6. Examples of single-leg standing test.
4.2. Results
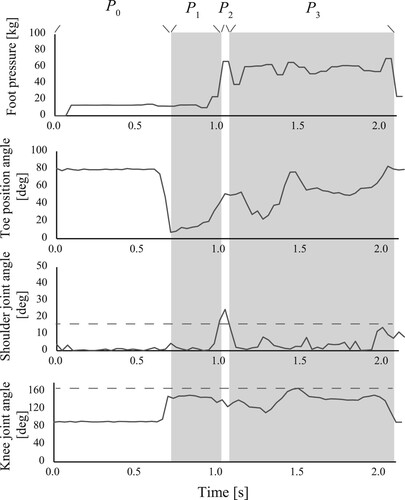
Figure shows the time-series waveforms of the foot pressure and each joint angle of subject A during stand-up. From the top of the figure are the foot pressure, toe joint angle, shoulder joint angle, and knee joint angle. The shaded areas in the figure indicate state transitions, and the dotted lines are thresholds for evaluating point reduction items determined through preliminary experiments. Subject A was judged by the athletic trainer to fit all the point reduction items and was given an evaluation score of 2. Let us first focus on the foot pressure and each joint angle. The standing-up state transitions from to
at 0.7, 1.0, and 1.1 seconds from the start. This indicates that the system judged the rise to be successful in the same way as an athletic trainer. However, the foot pressure after stand-up (
) showed a significant fluctuation, indicating that the pivoting foot was moving and wobbling. The proposed method also judged that the right elbow angle exceeded the threshold value during the standing-up motion (
), and therefore, the drawing board was away from the body. In addition, the knee angle was also kept below the threshold value, resulting in a one-point deduction for not extending the knee sufficiently during the standing-up motion. Thus, it can be seen that the proposed method also determines that all point reduction items are applicable and can calculate the same evaluation values as skilled AT.
Figure 7. Examples of measured data.
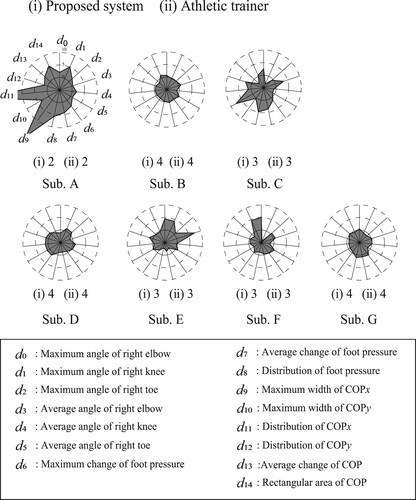
Radar charts based on index total standardization with the subject group which the highest AT evaluation score value are shown in Figure (solid lines: averages for young participants; dotted: double/quintuple standard deviations (5SD, 10SD)). The lower part of the chart shows the evaluation score values by the system and AT. The evaluation score values by the system and AT were the same for all subjects. The shape of the radar tended to be more significant for those with worse evaluation scores. For example, subject A has a significantly larger radar chart area than the others. On the other hand, subjects B, D, and G, who had the highest AT scores, had a circle-like radar configuration on the solid line indicating the average. Thus, it is possible to visually capture the deviations from the ideal standing state from the proposed method. The shape of the radar chart was different for subjects C, E, and F, even with the same score value.
Figure 8. Standardization results of index values.
Therefore, the weighted absolute sum was calculated when
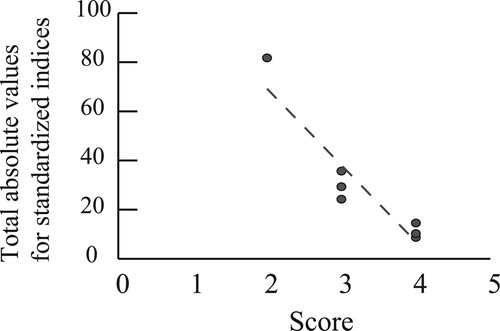
for each of the 15 standardized evaluation indices. The results are shown in Figure . The horizontal axis shows each subject, and the vertical axis shows the absolute sum of eight absolute evaluation indices. Subject A with an evaluation score of 2 has the most considerable absolute sum of 81.73, significantly larger than the other subjects. To evaluate the relationship between the absolute sum and the evaluation score value, the evaluation result is given in Figure .A strong negative correlation coefficient (
) was found between the absolute sum and the evaluation score. The subjects with lower evaluation scores tended to have more considerable absolute sums.
Figure 9. The comprehensive evaluation result using all indices.
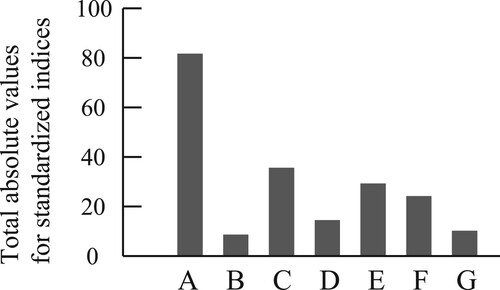
Figure 10. Relationship between total absolute values and score.
4.3. Discussions
This study aims to realize a quantitative evaluation system for the single-leg standing test and examines the following two points.
Whether the evaluation can be performed with the same evaluation score value as a visual evaluation by a skilled athletic trainer (AT)
Whether each evaluation index in the proposed system can evaluate differences that cannot be assessed only by conventional evaluation score values.
Concerning (I), the results given in Figures and showed that the proposed system could calculate the same score values as AT for all subjects. This suggested that the proposed method achieved quantitative evaluation without differences among evaluators, even at worksites where skilled evaluators do not exist.
Next, let us consider (II). The radar charts (Figure ) confirm that subjects with lower evaluation scores tend to have larger radar areas. This suggests that the evaluation indices used in this study may be able to evaluate deviations from the ideal standing-up motion. The shape of the radar chart differs even for the same evaluation score value, as in subjects C, E, and F. Thus, there is a possibility that differences in the standing state can be evaluated and classified in more detail. A similar trend was also confirmed in evaluating the relationship between the absolute sum of radar chart values and the evaluation score in Figure . A strong negative correlation was observed between the absolute sum and the evaluation score with a correlation coefficient of . Plotted points for three subjects with an evaluation score of 3 show different absolute sums. These results show that it is possible to visually identify deviations from the ideal standing motion using a radar chart. The results also showed the possibility of proposing a new scoring method that can evaluate more subtle differences in the absolute sum value based on the radar chart.
However, the number of subjects in this experiment was only seven, and none of the subjects achieved the max evaluation score of 5 points. The authors plan to increase the number of subjects and investigate a new scoring method to evaluate the standing test. In previous studies of standing movements, it has been reported that trunk flexion is more significant in elderly patients with lower muscle strength [Citation12]. The importance of trunk movement has also been shown to be meaningful even in healthy young adults [Citation13]. Therefore, the potential fall risk could be assessed by focusing on trunk movements. The same has also been reported for sitting movements [Citation14]. Various studies in this area have also been investigated using the position of the center of mass (CoM) [Citation15]. CoM can be easily calculated from the joint coordinates obtained with the proposed system [Citation16]. This study used evaluation indices based on the JFE Steel Safety Physical fitness function test. The authors will conduct a detailed evaluation in future works by adding evaluation indices based on previous research as described above.
5. Conclusion
This paper developed a quantitative motor function evaluation system for the single-leg standing test, one of the items in the ‘safety strength’ functionnal test. An evaluation method that enables stable evaluation even without skilled evaluators was also proposed. The proposed system uses a depth-sensor camera (Azure Kinect) and a foot-pressure sensor to measure the motion quantitatively. The single-leg standing action is represented as a state transition model to be objectively evaluated by each state. The evaluation results are output in a conventional five-stage evaluation score and a radar chart that visually allows the user to grasp deviations from the ideal stand-up behavior.
The proposed system was tested on seven young healthy subjects in the experiment. The results showed that the evaluation score values were the same for all subjects in the system and skilled athletic trainer evaluations. The results show that the proposed system can be quantitative evaluation even at worksites without skilled evaluators. Furthermore, the shape of radar charts showed different results even among subjects with the same evaluation score, indicating that the proposed system may enable a more detailed evaluation of standing movements.
The authors plan to continue to model the reference group that indicates the ideal standing state and investigate evaluation indices by increasing the number of subjects. We aim to establish a new scoring method that enables a more detailed evaluation.
Disclosure statement
No potential conflict of interest was reported by the author(s).
Additional information
Funding
Notes on contributors
Hayato Mikami
Hayato Mikami received the B.E degree from the National Institute of Technology, Tomakomai College in 2021. In April of the same year, he entered the Graduate School of Science and Engineering at Yokohama National University. Engaged in research on fall prevention.
Mami Sakata
Mami Sakata received the B.E, M.E, and Ph.D. degrees from YOKOHAMA National University, Yokohama, Japan, in 2015, 2016, and 2019, respectively. She was a Research Fellow of the Japan Society for the Promotion of Science (JSPS) from 2017 to 2019 (DC1) and from 2019 to 2020 (PD). She is currently an assistant professor in the YOKOHAMA National University. Her current research interests focus on fall risk evaluation and posture control. Dr. Sakata recieved the IEEE Circuits and Systems Society Student Travel Grant Initiative in 2015.
Keisuke Shima
Keisuke Shima received the B.E, M.E, and Ph.D. degrees from Hiroshima University, Hiroshima, Japan, in 2005, 2007, and 2009, respectively. He was a Research Fellow of the Japan Society for the Promotion of Science (JSPS) from 2007 to 2008 (DC1) and from 2009 to 2012 (PD). He is currently an Assistant Professor in the YOKOHAMA National University. His current research interests focus on biological signal analysis, neural networks, and humanmachine interface. Dr. Shima recieved the Honorable Mention for the Student Paper Award presented at the IEEE International Conference on Systems, Man and Cybernetics in 2008.
Tomoyuki Nagara
Tomoyuki Nagara graduated from PL Gakuen Senior High School in 1981. He belonged to a baseball team built within Kawasaki Steel Corporation, and was active as a player and coach from 1998 to 2012. He currently works at JFE Steel Corporation, and he protects workers' safety and health as an athletic trainer.
Makiko Yamashita
Makiko Yamashita M.D. has completed the residential course for occupational health physician at the University of Occupational and Environmental Health, Japan in 2010. While working at JFE Steel Corporation as an occupational physician, she conducts joint research with several universities to prevent workers from falling, back pain, heat stroke, and mental disorders.
Koji Shimatani
Koji Shimatani received the M.E degrees from Nihon University, Japan, in 2004 and Ph.D. degrees from Hiroshima University, Hiroshima, Japan, in 2008. He was Clinical and Research Fellow of Gaslini Child Hospital (Italy) from 2013 to 2014. He is currently a Professor in Faculty of Health and Welfare, Prefectural University of Hiroshima. His current research interests focus on children's rehabilitation, maternal and child development support, and posture control.
References
- Ministry of Health, Labour and Welfare. Basic Survey on Wage Structure. [Cited 2022 March 2]. Available from: https://www.mhlw.go.jp/toukei/itiran/roudou/chingin/kouzou/z2020/index.html.
- Safety at Work Site. Statistics on Occupational Accidents (2020) [Internet]. Ministry of Health, Labour and Welfare. [Cited 2022 March 2]. Available from: https://anzeninfo.mhlw.go.jp/user/anzen/tok/anst00.htm.
- Niino N, Tsuzuku S, Ando F, et al. Frequencies and circumstances of falls in the National Institute for Longevity Sciences, Longitudinal Study of Aging (NILS-LSA). J Epidemiol. 2000;10(1sup):90–94.
- Doi T, Shimada H, Park H, et al. Cognitive function and falling among older adults with mild cognitive impairment and slow gait. Geriatr Gerontol Int. 2015;15(8):1073–1078.
- Ministry of Health, Labour and Welfare. Guidelines for Ensuring the Safety and Health of Older Workers [Internet]. Ministry of Health, Labour and Welfare. [Cited 2022 March 2]. Available from: https://www.mhlw.go.jp/stf/newpage_10178.html.
- Jones CJ, Rikli RE, Beam WC. A 30-s chair-stand test as a measure of lower body strength in community-residing older adults. Res Q Exerc Sport. 1999;70(2):113–119.
- Nakatani T, Nadamoto M, Mimura K, et al. Valizatiopn 0f a 30-sec chair-stand test for evaluating lower extremity muscle strength in Japanese elderly adults. Japan J Phys Educ Health Sport Sci. 2002;47(5):451–461. Japanese
- Muramatsu S. Evaluation of the muscular strength of the lower extremities using the standing movement and clinical application. J Showa Med Assoc. 2001;61(3):362–367. Japanese
- Nagara T, Kaneyoshi A, Tsuji H. Developing a physical ability test to improve workplace safety. Japan society for Occupational Health;2007 April 25–28;Osaka, Japan:Japanese journal of industrial health. Supplement;2010. Japanese. 80. p. 312.
- Nagara T, Sanada M, Tsuji H. The action to prevent injury by the fall down in JFE Steel Corporation West JapanWorks(Kurashiki). Supplement; Japan society for Occupational Health;2010 May 26–28;Fukui, Japan:Japanese journal of industrial health. Supplement;2010. Japanese. 83, p. 370.
- Horita S, Sakata M, Shima K, et al. Motion function evaluation system based on single- leg standing test for prevention of falls in workers. SI2018 ;2018 December 12–15; Osaka, Japan:SICE;2018. Japanese. p. 1491–1492.
- Li J, Xue Q, Yang S, et al. Kinematic analysis of the human body during sit-to-stand in healthy young adults. Medicine. 2021;100(22):n.pag.
- Van Lummel RC, Evers J, Niessen M, et al. Older adults with weaker muscle strength stand up from a sitting position with more dynamic trunk use. Sensors. 2018;18(4):1235.
- Jeon W, Whitall J, Griffin L, et al. Trunk kinematics and muscle activation patterns during stand-to-sit movement and the relationship with postural stability in aging. Gait Posture. 2021;86:292–298.
- Sloot LH, Millard M, Werner C, et al. Slow but steady: similar sit-to-stand balance at seat-off in older vs. younger adults. Front Sports Active Living. 2020;2:548174.
- Yang CX. Low-cost experimental system for center of mass and center of pressure measurement (June 2018). IEEE Access. 2018;6:45021–45033.