
Abstract
Limited information on the agronomic performance of polyhalite (K2SO4.MgSO4.2CaSO4.2H2O) motivated us to establish two field trials in Sao Paulo, Brazil. The objective was to evaluate the comparative responses of tomato to muriate of potash (MOP), sulfate of potash, potassium magnesium sulfate, and polyhalite at different graded doses of potassium (K) application supplying varied amount of secondary nutrients. Under very low soil K conditions, polyhalite resulted in significantly higher marketable fruit yield, and higher foliar and fruit K and sulfur (S) concentrations than other K sources. This was not the case under medium soil K levels, that is, 101 mg kg−1. Likewise, polyhalite enhanced postharvest residual soil calcium (Ca), magnesium (Mg), and S than other evaluated sources. Depending on soil nutrient status and the cost of polyhalite, tomato farmers of Brazil could consider polyhalite as an option to meet crop K and secondary nutrient requirements.
Introduction
Polyhalite (K2Ca2Mg(SO4)42H2O) is a natural evaporate mineral composed of 15.7% dipotassium oxide (K2O), 18.6% calcium oxide (CaO), 6.6% magnesium oxide (MgO), and 21.3% sulfur (S). All these nutrients are essential for plant metabolism and crop growth. Limited agronomic information exists on polyhalite (PH) although it was evaluated for its nutrient availability for maize and sorghum in early 19th century on loamy soils of Texas, USA (Fraps and Schmidt Citation1932). Barbarick (Citation1991) noted PH as a slow release K fertilizer for sorghum sudangrass on loamy sand soils of Colorado, USA. However, the discovery of huge Zechstein deposits in the North Sea basin in the United Kingdom led to the enhanced interest in its usage as a multi-nutrient fertilizer for various crops across the globe (Kemp et al. Citation2016). Polyhalite from the above deposit has approximately 90% purity and contain 14% K2O, 17% CaO, 6% MgO, and 19% S. Polyhalite is a neutral salt with a solubility of 27 g L−1 at 25 °C and has <2% chloride (Cl), making it suitable for chloride sensitive crops like potatoes and tobacco (Sirius Minerals Citation2016).
The current study evaluates PH in tomato (Solanum lycopersicum L.) in Brazil since tomato consumes significant quantities of the nutrients contained in PH and Brazil is renowned for its tropical weather conditions leading to low soil base cation levels. Brazil ranks eighth in tomato production producing 4.3 million t from an area of 62096 ha with an average productivity of 67 t ha−1 (IBGE Citation2016) compared to a global production of 171 million t with an average productivity of 34 t ha−1 (FAO Citation2014). One ton tomato fruit consumes 4 kg of K2O, 2.5 kg of CaO, 0.9 kg of MgO, and 0.54 kg of S (Christou et al. Citation1999). Potassium ranks second for nutrient uptake often exceeding 361 kg K2O ha−1 (Fayad et al. Citation2002). Potassium is essential for different metabolic and transport processes including pH and charge balance, stomatal regulation, photophosphorylation, starch and sugar synthesis, carbon translocation, and stress tolerances (Dorais, Papadopoulos, and Gosselin Citation2001). Inadequate K nutrition negatively affects growth, fruit set, dry matter distribution, and fruit quality. Potassium deficient crop suffers from physiological disorders such as blotchy ripening, greenback, yellow shoulder, decreased lycopene content, and irregular shaped and hollow fruits.
Brazilian farmers usually apply excess K, which can lead to calcium (Ca) or magnesium (Mg) deficiencies due to the antagonistic relation among K+, Ca2+, and Mg2+ cations. Calcium deficiency in tomato causes blossom-end rot, a physiological fruit disorder (Saure Citation2001) associated with a high K: Ca ratio (Dekock et al. Citation1982) and may reduce marketable yields (Taylor and Locascio Citation2004). Magnesium is a component of the chlorophyll molecule and structural tissues and affects photosynthesis and carbon allocation (Marschner Citation2011) resulting in decreased biomass production or a lower biomass allocation to fruit (Hao and Papadopoulos Citation2004). High soluble K in the root environment often decreases Mg uptake and impact plant growth. Unlike other conventional K fertilizers, PH contains K, Ca, and Mg cations and therefore we expect a different agronomic response to PH application in terms of tomato growth and quality.
Potassium management practices depend on soil K levels, available sources, application techniques, and crop requirements. Choice of K fertilizer can be influenced by its accompanying anion (Zehler, Kreipe, and Gething Citation1981) that may effect the uptake of other nutrients and therefore yield, and quality. Muriate of potash (MOP, KCl – 60% K2O, 45% Cl−) is the common source of K2O for many crops and regions due to its lower price and common availability. While tomato is considered as an intermediate crop to chloride tolerance (White and Broadley Citation2001), MOP application can increase the soil chloride content that can be associated with high soil salinity and reduced plant nitrate (NO3−) and sulfate (SO42−) uptake. Potassium sulfate (SOP, K2SO4 – 50% K2O and 17% S) is another conventional K fertilizer supplying both K and S. Water solubility of SOP is 120 g L−1 at 20 °C (IPNI Citation2010b) compared to MOP, that is, 344 g L−1 (IPNI Citation2010a). Potassium magnesium sulfate (SOPM, K2SO4.2MgSO4 – 21% K2O, 17% MgO, and 21% S) commonly known as langbeinite is another K fertilizer containing Mg besides S. Its water solubility is 240 g L−1 at 20 °C (IPNI Citation2010c). Cost and availability are the constraints of SOP and SOPM usage in Brazil. Lower solubility of PH, that is, 27 g L−1 at 25 °C (Sirius Minerals Citation2016) relative to MOP or SOP, could be advantageous for plant nutrient uptake under tropical conditions of Brazil. Pavuluri et al. (Citation2017) evaluated MOP, PH, and a combination of MOP and kieserite for corn in Tanzania on soils containing very high K status. Owing to the S component, PH and a combination of MOP and kieserite recorded higher yields than MOP. They recommended continuing the research on PH to confirm the above results and understanding the reasons of the yield advantage to PH. More recently, enhanced yield from PH as well as SOP plus kieserite blends compared to MOP blend was attributed to Mg by Mello et al. (Citation2018) in potato (Solanum tuberosum L.) at one out of two locations in Sao Paulo region of Brazil.
The current study was undertaken for the following reasons. Global demand for K2O is forecasted to reach 38 million ton per annum in 2022 compared to current annual consumption of 35 million tons (Rawashdeh, Xavier-Oliveira, and Maxwell Citation2016). There is a need to develop alternative sources of K2O like PH due to finite existing sources. Potassium sources such as MOP, SOP, SOPM, and PH differ with respect to their salt index, solubility, and nutrient composition although they all contain K. Hence, we expect a different agronomic response to their application as a straight K fertilizer. Polyhalite contains K and each secondary nutrient in varying proportions and is now commercially available to the farmers. There is a scope for its inclusion in nutrient management plans by farmers. However, no information is available to the farmers and researchers on its effectiveness for yield and yield attributes in tomato. Thus, the broad objective of the current study is to determine the tomato responses to PH compared to MOP, SOP, and SOPM at different levels of K applications in Sao Paulo conditions of Brazil. The specific research questions are as follows: (i) Is there any influence of different K fertilizers on tomato yield and fruit quality at different K2O rates? (ii) How differently K sources affect the tomato foliar and fruit nutrient concentrations? and (iii) What is the influence of K sources and rates on postharvest soil nutrient parameters?
Materials and methods
Experiment locations and their description
Field trials were conducted in Sao Paulo, Brazil at Monte Mor (22° 49′ S, 47° 16′ W) in 2014 on silt loam soil and at Cerquilho (23° 10′ S, 47° 44′ W) in 2016 on loamy sand soil. Fifteen soil samples from 0 to 20 cm depth were collected to make a composite soil sample from each site prior to tomato planting. Samples were analyzed for pH (CaCl2 0.01 mol L−1), P, K, Ca, and Mg (ion exchange resin extraction), and S-SO4 (Ca (H2PO4)2 0.01 mol L−1) and total acidity H + Al (calcium acetate) (Raij et al. Citation2001). Postharvest soil samples were collected from each plot from the 0–20 cm depth and were analyzed for pH (CaCl2 0.01 mol L−1), P, K, Mg, Ca (ion exchange resin extraction), SO4-S (Ca (H2PO4)2 0.01 mol L−1), and electrical conductivity (EC) on a 1:2 soil water extract. Initial soil analysis indicated that soils at both locations were acidic in nature (5.8 at Monte Mor and 5.3 at Cerquilho) and low in organic matter content (11 g kg−1 at Monte Mor and 5 g kg−1 at Cerquilho). Soil K (101 mg kg−1) and S (6 mg kg−1) contents were classified as medium category and soil Ca (380 mg kg−1) and Mg (96 mg kg−1) contents were classified as high category, at Monte Mor (Raij et al. Citation1996). Soil K (23 mg kg−1) was under very low category and soil Ca (220 mg kg−1) was under high category at Cerquilho. Soil Mg (48 mg kg−1) and S (6 mg kg−1) were under low category (Raij et al. Citation1996). It means that we evaluated K sources under two different soil K levels, that is, medium and very low.
The meteorological measurements were collected from August to December at Monte Mor in 2014 and from March to August at Cerquilho in 2016 from National Institute of Agrometeorology. At Monte Mor, the mean monthly minimum air temperature was 13 °C during vegetative phase, that is, August and September and 17 °C during reproductive stage, that is, October to December. At Cerquilho, the mean monthly minimum air temperatures ranged from 14 to 20 °C during vegetative phase, that is, March and May, and 10 to 12 °C during reproductive stage, that is, May end to August.
Treatments and experimental design
The experimental designs were a 4 × 4 factorial plus single control treatment structure at Monte Mor and 4 × 3 factorial plus single control treatment structure at Cerquilho, arranged in randomized complete block design. Each study evaluated MOP, SOP, SOPM, and PH as the K sources in straight form at four different K2O rates with uniform rates of all other nutrients except the nutrients contained in the treatments, that is, K, Ca, Mg, and S. A treatment with N and P application but not K and secondary nutrients was included as a control. The K2O rates were 200, 400, 600, and 800 kg ha−1 K2O at Monte Mor and 125, 250, and 375 kg ha−1 at Cerquilho. Results from Monte Mor experiment in 2014 prompted us refining the rates of K2O at Cerquilho in 2016 trial. The total rates of N and P2O5 were 281 kg ha−1 of N and 300 kg ha−1 P2O5 at Monte Mor and 275 kg ha−1 of N and P2O5 at Cerquilho. At the time of planting, 35% of total K2O of each treatment was applied and incorporated along with 100% of the P2O5 and 20% of total N. Rest of the N and K2O were applied in eight split doses as a side dressing at a 15-day interval after transplanting in banded form. Urea and MAP were the sources of N and P2O5, respectively. Polyhalite was supplied by Sirius Minerals PLC (Scarborough, UK) as granules with a size range of 2–4 mm in diameter and other fertilizers were obtained from local commercial sources.
Agronomy
Plots were cultivated twice to a depth of 25 cm to ensure proper suitable conditions for planting. Seedlings containing four to five true leaves were planted 1.8 m apart with 0.5 m interplant spacing corresponding to a plant population of 11111 plants ha−1 at Monte Mor. Seedlings were planted 1.5 m apart with 0.65 m interplant spacing resulting in a population of 10256 plants ha−1 at Cerquilho. The genotypes were Compack (Seminis®) at Monte Mor and Norte (Clause®) at Cerquilho. The tomato seedlings were planted on 8 August 2014 (31 days after sowing) at Monte Mor and on 22 March 2016 (30 days after sowing) at Cerquilho after pre-plant fertilizer applications. The trial was drip-irrigated and each dripper had a flow rate of 1 L h−1, spaced 20 cm apart. Soil moisture was maintained at field capacity. Cultural practices such as weed, pest, and disease control on all plots were done as per the guidelines given by University of Sao Paulo, Brazil.
Leaves between the third and fourth fruit clusters were collected on 16 October in 2014 at Monte Mor and on 21 June at Cerquilho, and were dried at 65 °C and were digested with nitric and perchloric acid (Malavolta, Vitti, and Oliveira Citation1997). Extractant was analyzed for P (colorimetric method), K (flame photometric), Ca, Mg (atomic absorption), and S (turbidimetric method by BaSO4).
Postharvest quality evaluations
Tomato fruits were harvested at half ripen stage from 78 to 130 days after transplanting (DAT) at Monte Mor and from 70 to 130 DAT at Cerquilho and were graded into marketable (1 A, 2 A, and 3A) and unmarketable (fruits with physiological disorders and symptoms caused by pests and diseases) categories. The marketable yield was again classified into three categories according to transversal diameter, that is, class 1 A (small fruits, 40–50 mm), class 2 A (medium fruits, 50–60 mm), and class 3 A (large fruits, > 60 mm). Three fruits of each plot were rinsed with tap water, dipped in a phosphate-free detergent solution (0.1% w/v), and rinsed three times with deionized water. The fruits were dried at 68 °C until they reached a constant weight, and were ground and analyzed for N, P, K, Ca, Mg, and S (Malavolta et al. Citation1997). At Cerquilho, 15 tomato fruits from each plot were randomly collected for the quality analyses thrice: (i) immediately after harvesting; (ii) 20 days after harvesting (storage at 8 °C); and (iii) 25 days after harvesting (storage for 20 days at 8 °C followed by storage for five days at 20 °C). Samples of pulp were measured for pH by using a pH meter, total soluble solids by using a digital refractometer (ATAGO PR-101), electrical conductivity by using an EC meter, titratable acidity by titration with NaOH 0.1 mol L−1 Carvalho et al. (Citation1990). The vitamin C content was determined using the method described by Carvalho et al. (Citation1990). Fruit firmness was measured in the fruits at two points in the median region using the method described by Hampson (Citation1952).
Statistical analysis
Experiments with a complete factorial set of treatments plus one or more additional treatment are referred to as augmented factorial designs and often data from these designs are analyzed with a one-way analysis of variance (ANOVA) and mean separation tests using post hoc multiple comparison tests, including least significant difference (LSD) (Marini Citation2003). The drawback to this analytical approach is that much of the information in the experiment is lost because the factorial components (main effects and interactions) are not investigated and erroneous conclusions can be drawn when interactions are ignored (Marini Citation2003). We analyzed each location as an augmented factorial design (4 × 4 factorial + single control design at Monte Mor and 4 × 3 factorial + single control design at Cerquilho) as described by Piepho, Williams, and Fleck (Citation2006) using the factorial plus added control structure procedures in the GENSTAT statistical analysis software (Payne et al. Citation2009) as this procedure allows the comparison of any fertilizer at any (non-zero) application rate to the control treatment, the comparison between application rates averaged over the different fertilizer sources, comparison of overall differences between fertilizer sources averaged over application rates, and the interaction between application rate and fertilizer source given that some sort of fertilizer has been applied. We used Fishers unprotected LSD at the 10% significance level when F-tests indicated that significant differences existed (p < .1). Linear, quadratic, and exponential models were fitted on variables against the rates of K2O for each source of K when ANOVA p values were significant at 10% level of significance. Models were selected based on higher r2 and minimum p values. Total yield was used as a dependent variable and foliar and fruit nutrient concentrations were used as independent variables to fit the yield data by using multiple linear regression techniques.
Results and discussions
Pretrial soil K analysis results predicted a response to K application at Cerquilho due to its very low soil K content. Differences between SOPM and PH for yield and quality were not predicted due to high initial soil Ca status since both fertilizers supplied enough K, Mg, and S. We also expected a response to Mg from SOPM and PH over MOP and SOP due to low soil Mg content at Cerquilho.
Total fresh fruit yield
The total average yield at Monte Mor was high, that is, 112 t ha−1 compared to an average Brazil yield of 67 t ha−1 which can be attributed to the optimum weather conditions at Monte Mor for tomato growth in terms of rainfall and temperature. Significant differences among treatments including control were not observed (data not shown). This lack of response to K sources or rates was majorly due to sufficient pretrial soil base cation levels, that is, 101 ppm of soil available K, 380 ppm of Ca, and 96 ppm of Mg. Soil at this site should have supplied enough nutrients that are critical for the crop growth.
At Cerquilho, the average total yield was 55 t ha−1. It was 49% lower to the yield at Monte Mor. Lower yield at Cerquilho was due to lower minimum temperatures than optimum during reproductive phase besides lower inherent soil fertility levels such as lower organic matter and low soil pH. Van Ploeg and Heuvelink (Citation2005) reviewed and confirmed the negative influence of suboptimal night temperatures on pollen quality, fruit set, yield, and quality parameters.
At Cerquilho, K application significantly enhanced total yield (). Application of 250 and 375 kg K2O ha−1 significantly enhanced tomato yield (62 t ha−1) over 125 kg ha−1 K2O application that produced a yield of 56 t ha−1. Fertilizers MOP, SOP, SOPM, and PH were on par with each other (). However, PH produced numerically higher yields over control, MOP, SOP, and SOPM by an extra yield of 26, 4, 4, and 4 t ha−1, respectively. Multiple linear regressions were significant for yield in 2016 and revealed the importance of foliar and fruit K concentration besides foliar S concentration, which altogether explained 70% of total variation in total yields (data were not shown). Tomato yield response to K application was widely reported under the low soil K conditions (Locascio et al. Citation1997; Santos Citation2013). Current K yield response results at Cerquilho corroborated those conclusions. Literature evaluating different K sources in tomato is rather limited. Locascio et al. (Citation1997) conducted trials in Florida on soils ranging from very low to medium exchangeable K and reported no differences among MOP, SOP, and KNO3 at seven of eight instances. Current observations regarding the lack of yield differences among K sources were consistent with the above findings. Similarly, Santos (Citation2013) reported comparable yields for MOP and SOP on silt soils containing less than 20 mg kg−1 of soil K in Florida.
Table 1. P values from analysis of variance (ANOVA) and least squares means of fruit yield,fruit number and weight in response to different K sources and rates at Cerquilho, Brazil.
Marketable and unmarketable yields
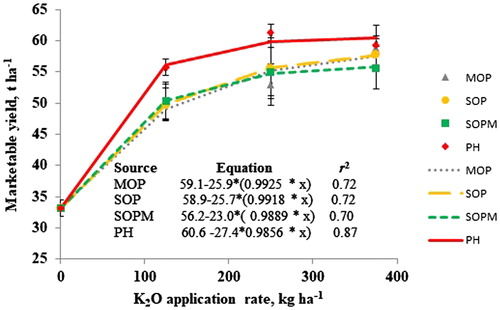
Potassium application significantly enhanced marketable yields over control by 22 t ha−1 at Cerquilho (). Observed K response was due to very low soil initial K levels, that is, 22 ppm. The probability of response to K fertilizers was very high at very low initial soil K concentrations in Sao Paulo, Brazil. Interestingly, significant differences among different K sources were observed for marketable yields at Cerquilho (). Treatment of PH produced an extra 26 t ha−1 of significantly higher yield over control and an extra 5 t ha−1 of significantly higher yield over MOP, SOP, and SOPM. Significant differences among MOP, SOP, and SOPM were not observed. The response of tomato to MOP or SOP depends on the soil fertility, climate, and crop variety grown. Muriate of potash produced a lower marketable yield than SOP in Florida at 405 kg K2O application rate (Santos Citation2013). In contrast, enhanced marketable yields from MOP application compared to SOP and SOPM were observed in Xinjiang in China (Li and Zhang Citation2013). Our current study did not observe any differences among MOP, SOP, and SOPM for total or marketable yields. However, Bose, Sanyal, and Majumdar (Citation2006) reported 8 t ha−1 higher yield for a blend of 22 kg of K2O through SOPM in combination with 168 kg K2O from MOP against 190 kg K2O from MOP on laterite soils containing at 54 mg Kg−1 in India. Owing to the relatively low K concentration in PH compared to MOP, we suggest to further research the above approach by using a combination of PH and MOP blends to meet the crop K and secondary nutrient requirement. We are unaware of any literature evaluating PH in comparison with other K sources in tomato. Five-ton yield advantage for PH over SOPM could be attributed to Ca in PH although initial soil Ca levels were high since SOPM treatment supplied enough Mg and S, required for tomato crop growth, although we did not observe any enhanced foliar or fruit Ca concentration in PH treatment. Hao and Papadopoulos (Citation2003) carried out greenhouse tomato experiments in Canada and reported a linear response to Mg applications (20, 50, and 80 mg L−1) only at higher Ca application levels, that is, 300 mg L−1, than at lower Ca application levels, that is, 150 mg L−1. Such response to Mg could have obtained for PH owing to its Ca content.
Exponential curves fitted for the commercial yields explained approximately 71% variation for MOP, SOP, and SOPM and 82% variation for PH (). Ninety percent of maximum yields of MOP, SOP, SOPM, and PH were 53, 53, 52, and 54 t ha−1, respectively, and were obtained at 182, 169, 125, and 103 kg K2O ha−1. This value of 182 kg ha−1 for MOP is close to the value of 198 kg ha−1 of K2O obtained by Fontes, Sampaio, and Finger (Citation2000) for a total yield of 82 t ha−1 in Mato Grosso, Brazil. Decreased K2O application rates to realize the 90% of highest yields are associated with increase in the number of secondary nutrients in treatments from MOP (K2O) to SOP (K2O and S) to SOPM (K2O, S, and Mg) to PH (K2O, S, Mg, and Ca). This could demonstrate the advantage of using PH as a multi-nutrient fertilizer in tomato.
Figure 1. Marketable tomato fruit yield response to fertilizer type and potassium (K) application rates at Cerquilho, Brazil. Error bars indicate standard error of the means.
Reduced commercial yields up to 50% due to inadequate calcium uptake and its transport to the sink resulting in increased blossom end rot were not uncommon (Taylor and Locascio Citation2004; Ho and White Citation2005). Higher K concentrations in treatments such as MOP, SOP, and SOPM than PH could affect the mobility of Ca in xylem consequently leading to Ca imbalance. Such antagonistic relation between K and Ca should be less severe for PH treatment possibly due to increased Ca content at the rhizosphere. Some other potential reasons were synchrony between crop nutrient requirement and availability of nutrients from the fertilizer. This warrants the need to conduct nutrient uptake studies for each K source. Also, there is a need to understand the influence of K sources on the release of cations from soil exchangeable sites to understand and associate the mechanisms behind the observed results.
Fruit number and weight
Potassium application significantly enhanced fruit number per plant, that is, 59 compared to control, that is, 52, at Monte Mor. But the average individual fruit weight was significantly lower for K applied treatments, that is, 168 g, compared to the control, that is, 182 g. Significant differences were not observed among K sources for fruit number or fruit weight.
At Cerquilho, control produced a significantly lower number of small, medium, large (data were not shown), and total fruits () than K fertilized plots. On an average, control produced 35 fruits per plant, 17 fewer than K applied plots. Control recorded 105 g individual fruit weight compared to 116 g from K applied plots. Significant differences were not observed among K sources for fruit number or weight.
A significant positive correlation was observed between fruit yield and fruit number per plant. Observed correlation coefficients were 0.92 at Monte Mor and 0.89 at Cerquilho. The correlation between fruit yield and average fruit weight was 0.35 at Monte Mor and 0.5 at Cerquilho. These r2 values for fruit weight were relatively small compared to that of fruit number. This implies that K application has enhanced tomato yields by increasing fruit number. In general, PH as a sole K source maintained a similar number of fruits as that of other K sources. Potassium influence on tomato fruit number through vigorous crop growth, early flowering, and fruit set was reported by Sanju, Dris, and Singh (Citation2003). Reduced sink activity due to inadequate potassium nutrition through hindered carbohydrate transport to the tomato fruits was illustrated by Kanai et al. (Citation2007).
Fruit quality parameters
Fruit quality parameters were measured only at Cerquilho. Fruit firmness is related to total soluble solid content and can positively influence fruit flavor and shelf life. At Cerquilho, K application enhanced fruit firmness at harvest and at 20 days after postharvest (20 days of fruit storage at 8 °C after harvesting) (). Further, plots applied with PH produced firmer fruits than MOP and SOPM at harvest and at 25 days after harvesting (20 days of storage at 8 °C after harvesting followed by another five days of storage at 20 °C). Potassium application resulted in enhanced fruit acidity at all the three measured instances (). Fruits from all K sources were similar in their acid content but it increased linearly with K rate at all the measured instances. 375 and 250 kg K2O ha−1 resulted in higher fruit acidity than control at all instances while 150 kg K2O ha−1 recorded higher acidity than control only at 20 days after harvesting. Wien (Citation1997) reported enhanced fruit acidity through K application by active synthesis and transport of amino acids and sugars from vegetative to reproductive tissue. Neither K application nor source affected fruit ascorbic acid content (Vitamin C) at any instance and brix at harvest and 20 days after harvest ().
Table 2. P values from analysis of variance (ANOVA) and least squares means of fruit yield in response to different K sources and rates at Cerquilho, Brazil.
Foliar nutrient concentrations
Foliar nutrient concentrations in all treatments including control ranged from adequate to high at Monte Mor (K 34 to 39; Ca 13 to 16; Mg 3.6 to 4.7; and S 5.0 to 5.5 g kg−1) (Renato de Mello and Caione Citation2012). All treatments were on par for foliar K concentrations (). It could imply that soil had supplied enough K to the control at Monte Mor. Control recorded significantly higher values for leaf Ca, that is, 16 g kg−1, compared to K applied plots, that is, 14.5 g kg−1. Treatment of SOP for an unexplainable reason resulted in higher foliar Mg concentration than PH and SOPM although latter two contain Mg nutrient. Treatment of MOP recorded significantly lower leaf S concentration compared to SOP, SOPM, and PH treatments that can be attributed to the S of SOP, SOPM, and PH fertilizers. Above differences in foliar K, Ca, or Mg concentrations have not affected any total or marketable yields at Monte Mor.
Table 3. P values from analysis of variance (ANOVA) and least squares means of foliar andfruit nutrient concentrations in response to different K sources and rates at Monte Mor, Brazil.
At Cerquilho, leaf concentrations were adequate in all treatments including control for leaf Ca (more than 14 g kg−1), Mg (more than 4 g kg−1), and S (more than 4 g kg−1) (Renato de Mello and Caione Citation2012) (). However, leaf K values for control and other treatments were found to be under the deficient category, that is, less than 40 g kg−1. Potassium application significantly enhanced foliar K concentration compared to control and PH recorded significantly higher foliar K concentration than MOP and SOP (). This affirms the availability of K from PH as a sole K source for tomato under Sao Paulo conditions. As observed at Monte Mor, control recorded significantly higher leaf Ca values than K applied plots possibly due to lower K availability in the rhizosphere which could have resulted in enhanced Ca uptake. A similar observation was made for leaf Mg content. Higher leaf Ca and Mg in control than MOP, SOP, SOPM, and PH treatments could also be due to a dilution effect. Further research on nutrient uptake from various sources of K2O could confirm the above observations. As observed at Monte Mor, MOP treatment resulted in significantly lower leaf S content compared to SOP, SOPM, and PH at 250 kg K2O ha−1 rate (). Polyhalite resulted in enhanced foliar S concentration than other K sources at 250 kg K2O ha−1 and than MOP and SOP at 375 kg K2O ha−1. Reduced S concentration in MOP treatment could be explained by the absence of S application and the competition between chloride and sulfate anions at the rhizosphere.
Figure 2. Foliar S concentration response to fertilizer type and potassium (K) application ratesat Cerquilho, Brazil. Error bars indicate standard error of the means.2
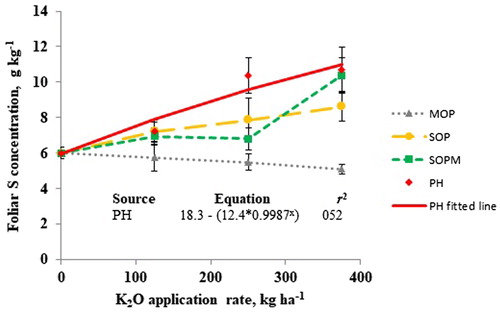
Table 4. P values from analysis of variance (ANOVA) and least squares means of foliar and fruit nutrient concentrations in response to different K sources and rates at Cerquilho, Brazil.
Fruit nutrient concentrations
At Monte Mor, significant differences among K sources for fruit K, Ca, Mg, and S were not again observed due to higher initial soil fertility conditions (). At Cerquilho, interestingly, consistent with foliar nutrient concentrations, K application enhanced fruit K concentration (). It was significantly higher in PH compared to MOP, SOP, and SOPM and the latter three were on par with each other. Fruit K concentration better reflects K nutrient status of the tomato plant as K harvest index is 0.7 for fruits compared to 0.2 for leaves (Balliu and Ibro Citation2002). All the treatments including PH recorded significantly higher fruit Ca content than SOP (). In the current study, PH treatment recorded numerically highest fruit yields, foliar, and fruit K and Ca contents, possibly due to extra Ca content in PH. Potassium and Ca reduce fruit disorders such as blossom end rot, cat face, and uneven ripening and enhance commercial yield (Imas Citation1999).
Treatment of SOPM recorded significantly higher fruit Mg content than SOP, MOP, and control (). SOPM and PH were on-par with each other for fruit Mg content. Treatment of SOPM contains 11% Mg while PH contains 3.6% Mg and therefore SOPM supplied extra Mg than PH at each rate. For example, at 125 kg K2O ha−1 rate, SOPM supplied 65 kg Mg compared to 32 kg Mg from PH. This could infer that the availability of Mg from PH was comparable to SOPM when they were used as a sole source of potassium. As expected, PH recorded significantly higher fruit S content than the other treatments due to extra supply of S compared to other K sources (). Interestingly, MOP treatment recorded significantly lower fruit S concentration than control as observed for foliar S concentration. The reason for such reduced S content in MOP treatment was not clear. This could be due to either dilution effect or due to reduced S uptake because of competition between chloride and sulfate anions. This observation was also made by Pavuluri et al. (Citation2017) in corn in Tanzania and Mello et al. (Citation2018) in potato in Brazil.
These fruit nutrient concentrations coupled with foliar and yield data at Cerquilho confirmed that K, Mg, and S from PH were plant available and could improve the commercial yield of tomato under very low K conditions. The dry weight of fruits was not recorded in the current study. Treatment of PH should have enhanced fruit K, Ca, Mg, and S uptake than other treatments if we assume constant fruit moisture percentage across the treatments. These results were not unexpected since PH treatment supplied an extra number and quantity of secondary nutrients beyond the one supplied by MOP, SOP, and SOPM.
Postharvest residual soil nutrient analysis
At Monte Mor, significant differences to K application or K sources were not obtained for any parameters except soil K (Data not shown). Such lack of differences could be due to high initial soil nutrient values. Postharvest residual soil changes caused by treatments in the form of fertilizer addition could have been small, compared to initial soil nutrient parameters. Both PH and MOP resulted in significantly higher postharvest soil K than SOP, SOPM, and control.
However, postharvest soil changes were significant and interesting at Cerquilho. Potassium application resulted in decreased soil pH compared to non-application (). Significant interaction effects between the source and rate of K were observed for soil K, Ca, Mg, and S. Data were presented for main effects due to the absence of crisscross interactions (). The differences among sources were greater at higher K rates which could be expected due to varied and higher supply of secondary nutrients by each K source at higher K rates than at lower rates. Control resulted in declined postharvest soil K values than pretrial initial soil K values and this decline in soil K was not observed in other K supplied treatments. Application of MOP resulted in significantly higher postharvest soil K compared with PH. This could be due to lower marketable yield for MOP than PH. Such increased soil K values through MOP application were reported in other studies too (Tariq, Saeed, and Nasir Citation2011; Shaaban and Abou El-Nour Citation2012). Treatment of PH was on par with SOP and SOPM and for postharvest residual soil K. Treatment of PH enhanced postharvest soil Ca content than MOP, SOP, and SOPM.
Table 5. P values from analysis of variance (ANOVA) and least squares means of changes to soil nutrient concentrations (Pre-planting — Post-harvest) in response to different K sources and rates at Cerquilho, Brazil.
Due to the absence of calcium in their composition, MOP, SOP, and SOPM resulted in similar postharvest soil Ca at Cerquilho (). This higher postharvest soil Ca from PH could benefit the acidic soils of Brazil by ameliorating Al toxicity, increasing liming efficiency, and improving soil structure. It could ameliorate Na stress if similar enhanced postharvest soil Ca levels could be observed under saline conditions. For example, Ca application to the nutrient solution helped in reducing the salinity stress and improved plant growth, leaf number, and fruit weight in tomato in Iran (Lolaei Citation2012).
Potassium fertilizers containing Mg such as PH and SOPM significantly increased postharvest soil Mg compared to K sources not containing Mg such as SOP, MOP, and control () at Cerquilho. Latter three also resulted in significantly lower postharvest soil S values than SOPM and PH. This is expected due to a higher supply of S from SOPM and PH. Treatment of PH resulted in higher postharvest soil S values compared to SOPM due to higher S supply from PH treatment. For example, at 125 kg K2O ha−1 rate, PH supplied 170 kg S ha−1 compared to 0 kg from MOP, 40 kg from SOP, and 131 kg from SOPM. This higher postharvest soil S could leach out of the soil or available to the next crop depending on rainfall patterns. This illustrates the need for further research on appropriate PH usage especially in terms of rate and exploring its usage in the form of different blends.
Conclusions
Two rate response studies evaluated different K sources which supplied equal amounts of K but different amounts of secondary nutrients. Response to K was not observed at Monte Mor under medium soil K conditions for total and marketable yields and for most of the measured foliar, fruit, and soil nutrient concentrations. In contrast, under very low soil K conditions, K application enhanced total and marketable yields, fruit number and weight, fruit firmness and acidity, and foliar and fruit K concentrations. Potassium application through PH resulted in an extra 26 t ha−1 increased marketable yield over control and an extra 5 t ha−1 increased yield over MOP, SOP, and SOPM possibly due to its Ca content. Treatments of MOP, SOP, and SOPM produced similar marketable yield. Polyhalite application increased fruit firmness and fruit K and S concentrations than other treatments. We conclude the availability of K and S from PH to the tomato because PH application increased K and S concentrations both in foliage and fruits than MOP and SOP. Significant differences were not observed among any K sources for total fruit yield, fruit number, weight, and acidity. Treatment of PH enhanced postharvest residual soil Ca, Mg, and S than MOP, SOP, and SOPM in proportion to the supply of these nutrients from the above fertilizers. Availability of such postharvest residual soil nutrients to the next crops depend on the rainfall patterns before planting of succeeding crop. Determination of the optimum PH usage with other K2O sources requires further research to determine the benefit of its multi-nutrient composition. Depending on soil nutrient status and the cost of PH, tomato farmers of Brazil could consider PH as an option to meet crop K and secondary nutrient requirements.
Acknowledgments
We thank Robert Meakin and Francis J. Pierce for their guidance in designing the study and Sirius Minerals for funding the project.
Disclosure statement
No potential conflict of interest was reported by the authors.
Related Research Data
References
- Balliu, A., and V. Ibro. 2002. Influence of different levels of potassium fertilizers on growth, yield and ascorbic acid content of tomato fruit grown in non-heated greenhouse. Acta Horticulturae 579 (579):385–388. doi:10.17660/ActaHortic.2002.579.66.
- Barbarick, K. A. 1991. Polyhalite application to sorghum-sudangrass and leaching in soil columns. Soil Science 151 (2):159–166. doi:10.1097/00010694-199102000-00005.
- Bose, P., D. Sanyal, and K. Majumdar. 2006. Balancing potassium, sulphur and magnesium for tomato and chili grown on red lateritic soil. Better Crops 90:22–24. http://www.ipni.net/publication/bettercrops.nsf/0/5F2DF1493 D586B10852579800081DCE1/$FILE/Better%20Crops%202006-3%20p22.pdf
- Carvalho, C. R. L., D. M. Mantovani, P. R. N Carvalho, and R. M. Moraes. 1990. Chemical food analysis. Campinas: ITAL Library.
- Christou, M., Y. Dumas, A. Dimirkou, and Z. Vassiliou. 1999. Nutrient uptake by processing tomato in Greece. Acta Horticulturae 487 (487):219–223. doi:10.17660/ActaHortic.1999.487.30.
- Dekock, P. C., A. Hall, R. Boggie, and R. H. E. Inkson. 1982. The effect of water and form of nitrogen on the incidence of blossom-end rot in tomatoes. Journal of the Science of Food and Agriculture 33 (6):509–515. doi:10.1002/jsfa.2740330603.
- Dorais, M., A. Papadopoulos, and A. Gosselin. 2001. Greenhouse tomato fruit quality. Horticultural Reviews 26:239–350.
- Fayad, J. A., P. C. R. Fontes, A. A. Cardoso, F. L. Finger, and F. A. Ferreira. 2002. Absorption of nutrients by tomato grown in field and greenhouse conditions. Horticultura Brasileira 20 (1):90–94. doi:10.1590/S0102-05362002000100017.
- Fontes, P. C. R., R. A. Sampaio, and F. L. Finger. 2000. Fruit size, mineral composition and quality of trickle-irrigated tomatoes as affected by potassium rates. Pesquisa Agropecuária Brasileira 35 (1):21–25. doi:10.1590/S0100-204X2000000100003.
- Food and Agricultural Organization (FAO). 2014. FAOSTAT database. Rome, Italy. http://www.fao.org/faostat/en/#data (accessed July 25, 2016).
- Fraps, G. S., and H. Schmidt. 1932. Availability to plants of potash in polyhalite, Bulletin No. 449. College Station, TX: Texas Agricultural Experiment Station.
- Hampson, A. R. 1952. Measuring firmness of tomatoes in a breeding program. Proceedings of the American Society for Horticultural Science 60:425.
- Hao, X., and A. P. Papadopoulos. 2003. Effects of calcium and magnesium on growth, fruit yield and quality in a fall greenhouse tomato crop grown on rockwool. Canadian Journal of Plant Science 83 (4):903–912. doi:10.4141/P02-140.
- Hao, X., and A. P. Papadopoulos. 2004. Effects of calcium and magnesium on plant growth, biomass partitioning, and fruit yield of winter greenhouse tomato. HortScience 39:512–515.
- Ho, L. C., and P. J. White. 2005. A cellular hypothesis for the induction of blossom-end rot in tomato fruit. Annals of Botany 95 (4):571–581. doi:10.1093/aob/mci065.
- Brazilian Institute of Geography and Statistics (IBGE). 2016. Systematic survey of agricultural production: Monthly survey of precision and monitoring of agricultural crops. Rio de Janeiro.
- Imas, P. 1999. Quality aspects of K nutrition in horticultural crops. In Workshop on Recent Trends in Nutrition Management in Horticultural Crops. Dapoli, Maharashtra, India.
- IPNI. (2010a). Nutrient Source Specifics Series. No. 3. Potassium chloride. Ref. 10063. International Plant Nutrition Institute. http://www.ipni.net/publication/nss.nsf/0/8FBD66599EAB433F852579AF00741710/$FILE/NSS-03%20PotassiumChloride.pdf (accessed July 25, 2017).
- IPNI. (2010b). Nutrient Source Specifics Series. No. 5. Potassium sulfate, Ref. 10065. International Plant Nutrition Institute. http://www.ipni.net/publication/nss.nsf/0/ADD4AB8BDFABE40C852579AF007505D6/$FILE/NSS-05%20Potassium%20Sulfate.pdf (accessed July 25, 2017).
- IPNI. (2010c). Nutrient Source Specifics. Potassium magnesium sulfate: Langbeinite. Ref. 10066. International Plant Nutrition Institute. http://www.ipni.net/publication/nss.nsf/0/598016C0780C1B49852579AF007541F7/$FILE/NSS-06%20Langbeinite.pdf (accessed July 25, 2017).
- Kanai, S., K. Ohkura, J. J. Adu-Gyamfi, P. K. Mohapatra, N. T. Nguyen, H. Saneoka, and K. Fujita. 2007. Depression of sink activity precedes the inhibition of biomass production in tomato plants subjected to potassium deficiency stress. Journal of Experimental Botany 58 (11):2917–2928. doi:10.1093/jxb/erm149.
- Kemp, S. J., F. W. Smith, D. Wagner, I. Mounteney, C. P. Bell, C. J. Milne, C. J. B. Gowing, and T. L. Pottas. 2016. An improved approach to characterize potash-bearing evaporite deposits, evidenced in North Yorkshire, United Kingdom. Economic Geology 111 (3):719–742. doi:10.2113/econgeo.111.3.719.
- Li, S., and Y. Zhang. 2013. 4R potassium management in processing tomato production in Xinjiang. Better Crops 97:4–6.
- Locascio, S. J., G. J. Hochmuth, S. M. Olson, R. C. Hochmuth, A. A. Csizinszky, and K. D. Shuler. 1997. Potassium source and rate for polyethylene-mulched tomatoes. HortScience 32:1204–1207.
- Lolaei, A. 2012. Effect of calcium chloride on growth and yield of tomato under sodium chloride stress. Journal of Ornamental and Horticultural Plants 2:155–160.
- Malavolta, E., G. C. Vitti, and S. A. Oliveira. 1997. Avaliação do estado nutricional das plantas: Princípios e aplicações. 2nd ed. Piracicaba: Potafós.
- Marini, R. P. 2003. Approaches to analyzing experiments with factorial arrangements of treatments plus other treatments. HortScience 38:117–120.
- Marschner, P. 2011. Marschner’s mineral nutrition of higher plants. 3rd ed. London: Academic Press.
- Mello, S. C., F. J. Pierce, R. Tonhati, G. S. Almeida, D. D. Neto, and K. Pavuluri. 2018. Potato response to polyhalite as a K source fertilizer in Brazil: Yield and quality. HortScience 53 (3):373–379. doi:10.21273/HORTSCI12738-17.
- Pavuluri, K., Z. Malley, M. K. Mzimbiri, T. D. Lewis, and R. Meakin. 2017. Evaluation of polyhalite in comparison to muriate of potash for corn grain yield in the Southern Highlands of Tanzania. African Journal of Agronomy 5:325–332.
- Payne, R. W., D. A. Murray, S. A. Harding, D. B. Baird, and D. M. Soutar. 2009. Genstat for windows (Introduction). 12th ed. Hemel Hempstead: VSN International.
- Piepho, H. P., E. R. Williams, and M. Fleck. 2006. A note on the analysis of designed experiments with complex treatment structure. HortScience 41:446–452.
- Raij, B. V., H. Cantarella, J. Quaggio, and A. M. C. Furlani. 1996. Recommendations for fertilization and liming for the state of São Paulo. Campinas: Instituto Agronômico.
- Raij, B. V., J. C. Andrade, H. Cantarella, J. A. Quaggio. 2001. Chemical analysis for fertility evaluation of tropical soils. Campinas: Instituto Agronômico.
- Renato de Mello, P., and G. Caione. 2012. Plant analysis. In Soil fertility, ed. by R. N. Issaka, 115–134. New York, USA: Intech.
- Rawashdeh, R., E. Xavier-Oliveira, and P. Maxwell. 2016. The potash market and its future prospects. Resources Policy 47:154–163. doi:10.1016/j.resourpol.2016.01.011.
- Sanju, U. M., R. Dris, and B. Singh. 2003. Mineral nutrition of tomato. Food, Agriculture and Environment 1:176–183.
- Santos, B. M. 2013. Effects of preplant potassium sources and rates for tomato production. HortTechnology 23:449–52.
- Saure, M. C. 2001. Blossom-end rot of tomato (Lycopersicon esculentum Mill.) a calcium- or a stress-related disorder? Scientia Horticulturae 90 (3–4):193–208. doi:10.1016/S0304-4238(01)00227-8.
- Shaaban, S. H. A., and E. A. A. Abou El-Nour. 2012. Effect of different potassium sources on yield and nutrient uptake by flax (Linum usitatissimum L.) grown on loamy sand soil. Journal of Applied Sciences Research 8:1425–1429.
- Sirius Minerals. 2016. POLY4 brochure. http://siriusminerals.com/site/flexpaper/Publications/POLY4_brochure/docs/POLY4_brochure.pdf (accessed July 25, 2017).
- Tariq, M., A. Saeed, and M. Nasir. 2011. Effect of potassium rates and sources on the growth performance and on chloride accumulation of maize in two different textured soils of Haripur, Hazara division. Sarhad Journal of Agriculture 27:415–422.
- Taylor, M. D., and S. J. Locascio. 2004. Blossom-end rot: A calcium deficiency. Journal of Plant Nutrition 27 (1):123–139. doi:10.1081/PLN-120027551.
- Van Ploeg, D., and E. Heuvelink. 2005. Influence of sub-optimal temperature on tomato growth and yield: A review. The Journal of Horticultural Science and Biotechnology 80 (6):652–659. doi:10.1080/14620316.2005.11511994.
- White, P. J., and M. R. Broadley. 2001. Chloride in soils and its uptake and movement within the plant: A review. Annals of Botany 88 (6):967–988. doi:10.1006/anbo.2001.1540.
- Wien, H.C., 1997. The physiology of vegetable crops. Department of Fruit and Vegetable Science, Cornell University, Ithaca, NY: Cab International.
- Zehler, E., H. Kreipe, and P. A. Gething. 1981. Potassium sulphate and potassium chloride: Their influence on the yield and quality of cultivated plants. International Potash Institute, Bulletin No. 9: 108. Basel, Switzerland: IPI.