
 ?Mathematical formulae have been encoded as MathML and are displayed in this HTML version using MathJax in order to improve their display. Uncheck the box to turn MathJax off. This feature requires Javascript. Click on a formula to zoom.
Abstract
Balanced nutrient application is an important concern to minimize fertilizer use in crop culture. Field experiments were conducted during kharif 2017 and 2018 to find out the best level of NPK fertilizer for rice with two varieties of rice of same duration (130-135 days). Three grades of customized fertilizers (250, 350 and 450 kg ha−1) along with 100% RDF (Recommended dose of fertilizer) and absolute control constituted the treatment variables. The results revealed that the grades of customized fertilizer (CF) influenced the yield and uptake of nutrients. Application of CF @ 450 kg ha−1 was found to be significantly superior over absolute control and 100% RDF with respect to yield and uptake of nutrients, and found on par with all other grades of CF (250 and 350 kg ha−1). Applying 250 kg ha−1 of CF recorded higher agronomic efficiency (AE), apparent recovery efficiency (ARE) and partial factor productivity (PFP) for phosphorus (P) and potassium (K) but higher AEn, AREn and PFPn in 450 kg ha−1 of CF. The higher utilization efficiency of nitrogen (UEn) of 43.05%, phosphorus (UEp) of 181.88% and potassium (UEk) of 34.40% were recorded in 250 kg ha−1 of CF. The CF @ 450 kg ha−1 recorded higher nitrogen and phosphorus requirement (NR and PR) i.e., 2.65 and 0.61 kg’s, respectively. Whereas, potassium requirement (KR) was higher in 100% RDF. Higher response yard stick (RYS) of 5.33 was recorded in 250 kg ha−1 of CF compared to other grades of CF, 100% RDF and absolute control.
Introduction
Rice is grown in over hundred countries and is the primary food for half of the people in the world (Koumeleh et al. Citation2007). In 2017, global production of rice was more than 759.6 million tonnes (MT), of which 90% was recorded in Asia (FAOSTAT Citation2018). As global grain demand is projected to double by 2050, the challenge to achieve even higher rice production levels still remains. Fertilizer use is one of the major factors for the continuous increase in rice production; more than 20% of fertilizer nitrogen (N) produced worldwide is used in the rice fields of Asia. Irrigated and rainfed lowland rice systems account for 92% of total rice production and nutrients applied as fertilizers account for 20–25% of total production costs in these rice systems (Bijay and Vinod Citation2016). Of the total 186.67 MT fertilizer (N + P2O5 + K2O) consumed globally during 2016–17, 14.3% (24.7 MT) was used in rice fields (FAOSTAT Citation2018).
Literature on nutrient management in rice and different rice-based cropping systems has become available after the introduction of mineral fertilizers. The knowledge generated from these studies generally resulted in the evolution of nutrient management for rice in the form of blanket recommendations for small regions with similar climate and topography. By adopting these recommendations, although to variable extents in different rice-growing regions of the world, farmers have achieved varying levels of N, P and K use efficiency, which still need to be augmented further to meet the challenges of increasing rice production with reduced inputs of energy and minimal damage to the environment. Because of large field to field variability in available nutrient supply, efficient use of nutrients applied as fertilizers is not possible when broad-based blanket recommendations for fertilizers are used (Adhikari et al. Citation1999). Among many factors that influence fertilizer use efficiency, one potentially important factor is the uncertainty in deciding the amount of fertilizer nutrient to be applied in a given field (Lobell Citation2007). When blanket recommendations are followed, besides use of nutrients in excess of the requirement of the crop in many fields, another major reason of low fertilizer use efficiency is the inefficient split application of fertilizer. The strategies for fertilizer management must also be responsive to temporal variations in crop nutrient demand to achieve supply – demand synchrony (Ram et al. Citation2012). When fertilizer applications are not synchronized with crop demand, losses of nutrients from the soil – plant system are large, leading to low fertilizer use efficiency.
Customized fertilizers are multi-nutrient carrier designed to contain macro and micro nutrients. In other words customized fertilizer is a multi- nutrient carrier precisely tailored to meet specific basal nutritional needs of a crop (Majumdar and Prakash Citation2018). The technology used in manufacture of such fertilizers make them high quality so that all granular fertilizers are highly uniform in physical form and chemical composition. For ensuring homogeneous supply of nutrients to all plants it is necessary that these fertilizers are band placed at the time of sowing (Vikas and Singh Citation2015). Use of customized fertilizers promotes site specific nutrient management so as to achieve maximum use efficiency of applied nutrients in a cost effective manner (Kamble and Kathmale Citation2015). There are about 36 customized formulations approved by fertilizer control order in India (Majumdar and Prakash Citation2018). The customized fertilizer may include the combination of nutrients based on soil testing and requirement of a crop and the formulation may be of primary, secondary and micro nutrients. Innovative product like customized fertilizers specific to agro climatic conditions can be offered to the farmers to remediate nutrient deficiency particularly secondary and micronutrients for popularizing the concept (Jeevika and Sreya Citation2016). In this context, customized fertilizers could contribute promoting site specific nutrient management in order to achieve the maximum use efficiency of the applied nutrients in a cost-effective manner (Har Vir Singh et al. Citation2019).
Hence, judicious application of inorganic fertilizer is paramount important for yield enhancement of rice (Anamul Haque and Moynul Haque Citation2016). The existing fertilizer formulations for major nutrients in rice are proving to be sub-optimal for attaining productivity at higher levels and need a fresh look to revise them to an optimum and more balanced level. In view of the above, a study was conducted to know the effect of graded level of customized fertilizer on yield, nutrient requirement and nutrient use efficiency of rice (Oryza sativa L.).
Material and methods
Field experiments were conducted at Zonal Agricultural Research Station (ZARS), V. C. Farm, Mandya District, Karnataka state, India during kharif (September to November) 2017 and 2018 to study yield, nutrient uptake, nutrient requirement and nutrient use efficiency as influenced by graded levels of customized fertilizer (14:17:17) along with 100% RDF (125 kg N, 62.5 kg P2O5 and 62.5 kg K2O ha−1) and absolute control (No fertilizer) as check in rice cultivation. The study region comes under tropical climate condition and situated in the southern Dry Zone of Karnataka between 12° 34′ 23.2” to 12° 34′ 24.4” N latitude and 76° 49′ 37.1” to 76° 49′ 39.0” E longitude with an altitude of 695 m above mean sea level. The region receives on an average 700-800 mm rainfall annually. Before sowing, surface soil samples (0-15 cm depth) were collected using auger from various spots to form one composite soil sample for initial soil fertility evaluation and analyzed following the standard laboratory procedures (). The experimental soil was slightly alkaline in reaction with an electrical conductivity (1:2 soil: water) of 0.3 dS m−1, low in available nitrogen, high in available phosphorus and potassium.
Table 1. Initial soil properties of experimental site.
Rice varieties i.e., Thanu and MTU 1001 maturing at 130 − 135 days were raised during kharif 2017 and 2018, respectively. The experiment was laid out in randomized block design with three replications. Five treatments (T1: absolute control, T2: 100% recommended dose of fertilizer (125 kg N, 62.5 kg P2O5 and 62.5 kg K2O ha−1), T3: 250 kg ha−1 of customized fertilizer (CF), T4: 350 kg ha−1 of CF and T5: 450 kg ha−1 of CF) which comprised of three splitting of nitrogen as basal, at tillering and panicle initiation stage in different proportions and are furnished in . Phosphorus and potassium were applied in the form of super phosphate and muriate of potash, respectively and they were applied as basal dose as per the treatments fixed. All recommended cultural practices of rice production were adopted for the management of the experiment. At crop maturity, plants from the net area were harvested manually close to the ground surface. The harvested plants were sun dried in open air, above ground biomass yield weighed and then threshed and weighed to determine the grain yield for each treatment. The straw and grain samples were washed with distilled water to remove soil dirt and oven-dried at 70 °C to a constant weight. The samples were ground with a grinder and allowed to pass through a 2 mm sieve to prepare a sample of 10 g and nutrients were analyzed as per standard procedures. For nitrogen estimation, 0.5 grams of grain and straw samples were digested with concentrated sulfuric acid and digestion mixture (K2SO4: CuSO4.5H2O: Selenium in 100: 20: 1 proportion) till a green residue was obtained. The digested material was distilled by micro Kjeldhal distillation method. The liberated ammonia was trapped in boric acid (4%) and then nitrogen was estimated by titration against standard sulfuric acid (Piper Citation1966). For P and K, plant samples were digested using diacid (HNO3 + HClO4 at 10:4 ratio) digestion method and determined by vanodomolybdophosphoric yellow color method and flame photometry method, respectively (Piper Citation1966).Total nutrient uptake by the straw and grain was calculated by multiplying the nutrient concentrations with the respective straw and grain yield (kg ha−1). The total nutrient uptake by the whole plant was determined by summation of the respective grain and straw nutrient uptake. The different nutrient use efficiency, nutrient requirement, yield response and response yard stick were calculated from established formulae as below:
Table 2. Effect of levels of customized fertilizer on grain and straw yield of rice.
Nutrient use efficiency (NUE)
Grain yield increase in kg per kg nutrient applied is considered as nutrient use efficiency (Paul et al. Citation2015).
Agronomy efficiency (AE)
It is calculated in units of yield increase per unit of nutrient applied (Paul et al. Citation2015). It more closely reflects the direct production impact of an applied fertilizer and relates directly to economic return, EquationEquation (1)Equation (1)
Equation (1) .
Partial factor productivity (PFP)
It is a simple production efficiency expression, calculated in units of crop yield per unit of nutrient applied, EquationEquation (2)Equation (2)
Equation (2) (Paul et al. Citation2015).
Recovery efficiency (RE)
It is one of the more complex forms of NUE expressions and is most commonly defined as the difference in nutrient uptake in above-ground parts of the plant between the fertilized and unfertilized crop relative to the quantity of nutrient applied (Paul et al. Citation2015). It is often preferred NUE expression by scientists studying the nutrient response of the crop. Like AE, it can only be measured when a plot without nutrient has been implemented on the site, but in addition requires measurement of nutrient concentrations in the crop. Similar to AE, when calculated from annual response data, it will often underestimate long-term NUE, EquationEquation (3)Equation (3)
Equation (3) .
Internal utilization efficiency (IUE)
It is defined as the yield in relation to total nutrient uptake (Paul et al. Citation2015). It varies with genotype, environment and management. A very high IUE suggests deficiency of that nutrient. Low IUE suggests poor internal nutrient conversion due to other stresses (deficiencies of other nutrients, drought stress, heat stress, mineral toxicities, pests, etc.), EquationEquation (4)Equation (4)
Equation (4) .
Nutrient requirement (NR)
The nutrient efficiency of the hybrid rice crop can be calculated in the form of NPK nutrient required (NR) to produce a rice grain/straw by using the EquationEquation (5)Equation (5)
Equation (5) given by Paul et al. Citation2015.
Yield response (YR) and response yard stick (RYS)
Yield response is nothing but yield difference between treated plots and control plot. Response yard stick for each treatment was calculated by using the EquationEquation (6)Equation (6)
Equation (6) (Morteza, Alireza, and Shankar Citation2011).
Response yard stick is the ratio of yield response (kg ha−1) to total amount of N, P2O5 and K2O fertilizer nutrients applied (kg ha−1).
Equation (1)
Equation (1)
Equation (2)
Equation (2)
Equation (3)
Equation (3)
Equation (4)
Equation (4)
Equation (5)
Equation (5)
Equation (6)
Equation (6)
Where,
Y = yield of harvested portion of crop (kg ha−1) with nutrient applied; Y0 = yield with no nutrient applied (kg ha−1); F = amount of nutrient applied (kg ha−1); U = total nutrient uptake in aboveground crop biomass with nutrient applied (kg ha−1); U0 = nutrient uptake in aboveground crop biomass with no nutrient applied (kg ha−1);
Statistical analysis
The statistical analysis of the data was carried out by using standard statistical method of analysis of variance (Panse and Sukhatme Citation1985) and treatment means were compared using the Duncan’s multiple range test (DMRT) at P < 0.005 probability level.
Results
Graded levels of customized fertilizers on yield
The different graded levels of customized fertilizer exerted significant effect on pooled mean of both grain and straw yield (). Grain yield of rice increased over grades by gradual elevation of customized fertilizer. Nevertheless, higher grain yield (4788 kg ha−1) was produced when crop was fertilized with 450 kg ha−1 of CF which was statistically on par at 350 and 250 kg ha−1 of CF. The lower grain yield was recorded in absolute control treatment. There was significant increase in rice grain yield by 43.73 per cent with the application of 450 kg ha−1 of CF relative to the absolute control and RDF treatment. However, the magnitude of the per cent increase in grain yield over absolute control was highly dependent on the different levels of CF. It accounts to 39.07 per cent and 33.42 per cent at 350 and 250 kg ha−1 of CF applied treatments, respectively. The higher straw yield (6384 kg ha−1) was recorded when the crop was fertilized with 450 kg of CF ha−1 and it was on par with 350 kg CF ha−1 (6251 kg ha−1) followed by 250 kg ha−1 CF applied treatments. The lowest straw yield (4746 kg ha−1) was recorded in absolute control ().
In both years, grain and straw yield increased in all fertilized treatments and were significantly different among treatments. Nevertheless, higher grain yield in 2017 and 2018 of 4896 kg ha−1 and 4800 kg ha−1, respectively was recorded in treatments which received 350 kg ha−1 of CF and 450 kg ha−1 of CF, respectively. Similarly, straw yield was also higher in treatment which received 350 kg ha−1 of CF (5399 kg ha−1) and 450 kg ha−1 of CF (7563 kg ha−1) in 2017 and 2018, respectively, but found to be on par with each other.
Nutrient uptake by grain and straw
Nutrient uptake of rice was ascribed by grain and straw uptake of N, P and K under different levels of CF. The pooled data of two seasons presented in and revealed that application of different levels of CF had significant effect on the nutrient uptake by grain and straw of rice. Uptake of N, P and K by grain was high at higher dose of NPK applied i.e., 450 kg ha−1 of CF (65.12 kg ha−1, 18.24 kg ha−1 and 17.41 kg ha−1 NPK, respectively) and it was on par with 250 and 350 kg ha−1 of CF applied. Lower uptake of N, P and K by grain was noted at no fertilizer applied i.e., absolute control (41.79 kg ha−1, 9.78 kg ha−1, and 9.91 kg ha−1 of NPK, respectively). Higher uptake of N, P and K by straw of 60.12, 11.07 and 123.50 kg ha−1, respectively was recorded in treatment which received 450 kg ha−1 of CF.
Table 3. Effect of levels of customized fertilizer on uptake by rice grain.
Table 4. Effect of levels of customized fertilizer on uptake by rice straw.
Nutrient use efficiency
Agronomic efficiency of nitrogen (AEn) due to levels of CF varied from 11.65 kg grain yield per kg of N applied at 450 kg ha−1 of CF to 6.03 kg grain yield per kg of N applied at 100% RDF level (). Higher AEn might be because of higher dose of nutrients applied. Apparent recovery efficiency for nitrogen (AREn) in rice varied from 39.49 per cent at 450 kg ha−1 CF to 20.68 per cent at 250 kg ha−1 CF level. AREn of the rice (pooled mean of two seasons) increased with increasing levels of CF and lowest AREn (21.03%) was noted at 100% RDF treated treatment.
Table 5. Effect of levels of customized fertilizer on nutrient use efficiency of rice.
AEp was calculated as kg grain yield per kg of P2O5 applied and AREp was calculated as difference in nutrient uptake in above-ground parts of the plant between the fertilized and unfertilized crop relative to the quantity of nutrient applied. The results of this study indicated that the AEp and AREp were high with 250 kg ha−1 of CF compared to other levels of CF and further increase in NPK dose had declined AEp and AREp in rice (). AEp varied from 11.97 kg grain yield per kg of P2O5 applied at 100% RDF to 26.50 kg of grain yield per kg of P2O5 applied at 250 kg ha−1of CF applied treatment and AREp varied from 12.03 per cent to 24.52 per cent. Similar trend was followed for AEk and AREk of rice. AEk values obtained were same as AEp because of application of similar dose of P2O5 and K2O. AREk varied from 67.41 per cent to 115.23 per cent.
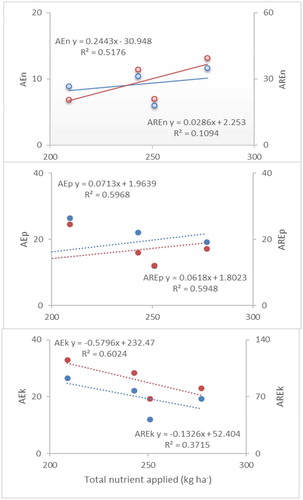
A positive quadratic association between nutrient use efficiency i.e., AE, ARE and total nutrient applied in rice was observed (). Total nutrient applied accounted to 10.94 per cent, 59.48 per cent and 37.15 percent of the variability of AREn, AREp and AREk, respectively and 51.76 per cent, 59.68 per cent and 37.15 per cent of the variability of AEn, AEp and AEk, respectively.
Figure 1. Relationship between AE, ARE of N, P and K and total nutrient applied.
Utilization efficiency of nutrients in rice indicates the yield in relation to total nutrient uptake. Utilization efficiency due to UEn, UEp and UEk was calculated by ratio of yield to uptake () and were higher with no nutrient applied (43.04%, 207.66% and 41.22%, respectively) than other treatments. Increase in levels decreased the utilization efficiency in rice (pooled mean of two seasons).
Partial factor productivity (PFP) is a production efficiency expression, calculated in units of crop yield per unit of nutrient applied (). It explains how productive rice cropping system in comparison to its nutrient input applied. PFPn was high with increased level of CF (450 kg ha−1 of CF) applied. But, PFPp and PFPk were noticed high at 250 kg ha−1 of CF and both recorded same i.e., 105.82 because of similar application rate P2O5 and K2O.
Nutrient requirement
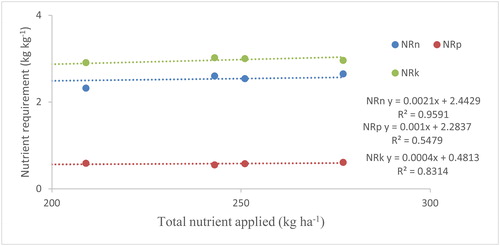
The individual nutrient requirement is the indirect method of calculating the nutrient use efficiency of the crop and it is nothing but nutrients required to produce kg of rice is presented in Table 6. Nitrogen required to produce kg of grain was higher (2.65 kg kg−1) in 450 kg ha−1 of CF followed by 2.60 and 2.54 kg kg−1 in 350 kg ha−1 of CF and 100% RDF applied, respectively. However, lower (2.32 kg kg−1) nitrogen requirement was recorded in both absolute control and 250 kg ha−1 of CF applied. Whereas, phosphorus requirement to produce a kg of grain was higher (0.61 kg kg−1) in 450 kg ha−1 of CF applied followed by 0.59 kg kg−1 in 250 kg ha−1 of CF. Potassium requirement (kg) to produce kg of grain was high (3.02 kg kg−1) with 350 kg ha−1 of CF applied followed by 3.00 kg kg−1 in 100% RDF. However, lower (2.43 kg kg−1) potassium requirement was recorded in absolute control. Nutrient requirement of rice increased linearly with the increase in nutrient applied (). Nutrient applied accounted for 95.91, 54.79 and 83.14 per cent of the variability in NRn, NRp and NRk, respectively.
Figure 2. Relationship between nutrient requirement and total nutrient applied.
Yield difference and response yard stick
Yield difference between fertilized plots and control plot represents the yield response of rice (Table 6). Higher yield difference of 1456.67 kg ha−1 was recorded with the application of CF @ 450 kg ha−1 and lower difference in yield was at 100% NPK (754.33 kg ha−1).
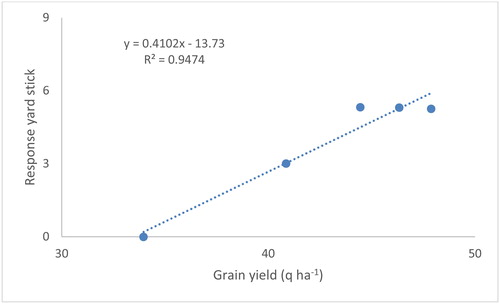
Response yard stick for each treatment was calculated by ratio of difference in fertilized plot yield and unfertilized plot (absolute control) yield to total nutrient applied (Table 6). Response yard stick of rice increased with elevated levels of CF and it varied from 3.01 to 5.33. However, there was no greater variation in response yard stick among all levels of CF applied treatments. Response yard stick had a significant linear association with grain yield (). Grain yield explained 94.74 per cent variability of the response yard stick.
Figure 3. Relationship between grain yield and response yard stick.
Discussion
Yield and nutrient uptake of rices
The increment of grain yield with higher nutrient levels might be due to efficient absorption of NPK and other nutrients which increased the production of the dry matter from source to sink (Ebaid and Ghanem Citation2000; Morteza, Alireza, and Shankar Citation2011). The role of nutrients in determining the amount of sunshine absorbed by green leaves of crops, the efficiency of conversion of sunshine to biomass, efficient partitioning of biomass into reproductive parts may be attributed to higher yield. Except absolute control and RDF applied treatment, all other treatments were on par with respect to grain yield. This may be due to continuous and gradual supply of nitrogen from CF to the plant to maintain greenness of leaves for longer period and there by increased the photosynthetic rate, greater dry matter accumulation and also more translocation of photosynthates toward sink. Differential rates and split application of nitrogen and basal application of phosphorus and potassium plays important role (Mannan et al. Citation2014; Rohit et al. Citation2017; Zelalem, Tilahun, and Dereje Citation2017). Shekhon, Kaur, and Singh (Citation2012) also reported that application of higher dose of customized fertilizer (67% CF) produced additional grain and straw yield of wheat. The lowest grain and straw yield was observed under treatment with no fertilizer i.e., absolute control.
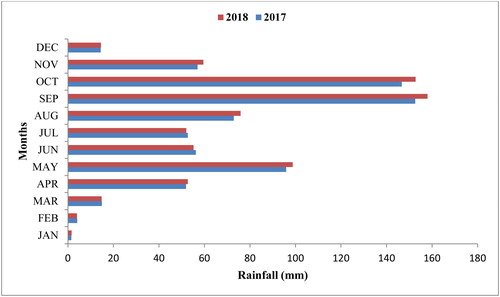
Higher variability was noticed in straw yield and it was highest in 2018 than 2017. Higher production of rice in 2018 was probably because of the higher rainfall and its distribution besides the highest mean value of temperature compared to 2017 () which resulted in increased photosynthetic rate, greater dry matter accumulation and also more translocation of photosynthates toward sink as noticed by René et al. (Citation2016).
Figure 4. Rainfall distribution at the experimental station during 2017 and 2018.
Increased nutrient uptake of rice with increased levels of CF may be due to buildup of soil fertility in terms of available N, P and K and also due to higher biological (straw + grain) yield. Pandey, Verma, and Tripathi (Citation2007) and Dwivedi, Meshram, and Pandey (Citation2014) also reported that application of high dose of customized fertilizer helps to provide essential nutrient to get the targeted yield. Nitrogen being a major nutrient, it plays a major role in uptake of nitrogen by rice (Ravi, Sonboir, and Chetna Citation2012). Though split application of nitrogen is not a main objective in this study, but it showed a major role. The application of fertilizers according to crop requirement might have reduced the loss of nutrients and increased the nutrient absorption consequently better utilization of applied nutrients leading to higher dry matter accumulation and there by higher nutrient uptake. Similar results were also reported by Bijay and Vinod (Citation2016); Zaidi, Tripathi, and Singh (Citation2007) and Fatehjeet Singh et al. (Citation2015).
Nutrient use efficiency of rice as influenced by levels of CF
The estimation of AEn and AREn in rice is crucially needed to assess the fate of applied nitrogen and their role in improving maximum economic yield through efficient absorption or utilization by the plant. The increasing trend of AEn and AREn with increasing CF reveals that rice plants are able to absorb or utilize N at higher rates or the rate of NPK uptake by plant can keep pace with the loss of nutrient. Both AEn and AREn increased with increasing dose of CF may be due to similar dose of N applied to all treatments and also continuous supply of nitrogen by basal and two splits, one each during tillering and grain filling stage (Ravi, Sonboir, and Chetna Citation2012). Recently, Bijay Singh et al. (Citation2015) found that high nitrogen use efficiency of transplanted rice can be achieved by applying a balanced amount of N fertilizer at transplanting, enough N fertilizer at active tillering stage, and an optical sensor-guided N fertilizer dose at tillering and panicle initiation stages of rice. Similar results have been reported by Anamul Haque and Moynul Haque (Citation2016).
AEp, AEk, AREp and AREk were recorded to be high with 250 kg ha−1 of CF and further increase in CF dose had declined AE and ARE of both P2O5 and K2O due to better availability of nutrients and concomitant utilization of nutrients by the rice crop with incremental levels of P2O5 and K2O. This is an indication of the fact that use efficiency (AEp, AEk, AREp and AREk) of the incremental doses is good at initial increments and shows the scope for increased levels of respective nutrients. Further, it might be due to phosphorus and potassium utilization patterns of higher magnitude besides exhibiting greater competition for nutrient absorption at the lowest dose of phosphorus application. Selvi et al. (Citation2003) observed greater phosphorus use efficiency in rice at lower dose of P2O5 and K2O level. Dakshina Murthy et al. (Citation2015) also explained Agronomic efficiency of N, P and K was progressively increased in rice with incremental doses of respective nutrients.
Partial factor productivity is a useful measure of nutrient use efficiency as it provides an integrative index that quantifies total economic output relative to the utilization of all nutrient resources in the system (Fatehjeet et al. Citation2015). PFP of phosphorus and potassium declined steadily with successive increase in levels of CF. This was obvious as the agronomic and recovery efficiency of phosphorus and potassium could not increase in tune with rate of CF application following the law of diminishing return and low phosphorus utilization efficiency which resulted in lower partial factor productivity (Panda Citation2002). Increased PFP due to balanced application of nutrients, increased nutrient uptake and utilization of indigenous nutrients, and by increasing the efficiency with which applied nutrients are taken up by the crop and utilized to produce grain (Singh, Kumar, and Pal Citation2008).
Nutrient requirement, yield difference and response yard stick
Nutrient use efficiency by the crop can be decided by working out the nutrient requirement (NR). Nutrient required (N, P2O5 and K2O) to produce a kg of grain was followed the order of K > N > P. The efficiency of the nutrient is considered when it produces the maximum quantity of the plant biomass yield with minimum quantity of nutrient. Higher nutrient requirement might be due to higher utilization of nutrients by the crop and balanced nutrient application like nitrogen as both basal and split, and P2O5 and K2O as basal only. Higher uptake of nutrients also the reason for higher nutrient requirement (Yadav Citation2003). Higher yield response may be due to effective utilization of NPK nutrients and better uptake of nutrients in these treatments. The higher response yard stick was noticed with the application of 250 kg ha−1 of CF which might be due to balanced application of nutrients and increased solubility of nutrients (Amanullah Citation2009).
Conclusion
From the results, it may be concluded that yield, nutrient uptake, nutrient requirement and nutrient use efficiency of the rice were significantly influenced by levels of CF. Although yield of the rice crop increased with increased levels of CF, the grain and straw yield was higher with 450 kg ha−1 of CF and was on par with 250 and 350 kg ha−1 of CF. Consecutively, the highest grain and straw uptake of nutrients was recorded with the application of 450 kg ha−1. Higher use efficiency of nutrients was recorded in the order of 250, 350 and 450 kg ha−1of CF and lower in 100% RDF. Response yard stick was high (5.33) at 250 kg ha−1 of CF and low (3.01) at 100% NPK applied. Hence, 250 kg ha−1of CF can be considered as the best NPK level for rice cropping compared to other levels and can help in improving the formulation for site specific, balanced fertilizer management strategies in rice. Such nutrient management strategy will be more advantageous compared to conventional, blanket and imbalanced fertilizer recommendation.
Acknowledgments
We are thankful to the SABIC Research and Technology Pvt. Ltd., Bengaluru for providing funds to conduct this field study.
References
- Adhikari, C., K. F. Bronson, G. M. Panuallah, A. P. Regmi, P. K. Saha, A. Dobermann, D. C. Olk, P. R. Hobbs, and E. Pasuquin. 1999. On-farm N supply and N nutrition in the rice-wheat system of Nepal and Bangladesh. Field Crops Research 64 (3):273–86. doi: https://doi.org/10.1016/S0378-4290.(99)00063-5.
- Amanullah. 2009. Partial factor productivity, agronomic efficiency, and economic analyses of maize in wheat-maize cropping system in Pakistan. Department of Agronomy, NWFP Agricultural University Selected Paper prepared for presentation at the Southern Agricultural Economics Association Annual Meetings, January 31–February 3, Atlanta, Georgia.
- Anamul Haque, M. D., and M. Moynul Haque. 2016. Growth, yield and nitrogen use Efficiency of new rice variety under variable nitrogen rates. American Journal of Plant Sciences 7 (3):612–22. doi: https://doi.org/10.4236/ajps.2016.73054.
- Bijay, S., and S. Vinod. 2016. Advances in nutrient management in rice cultivation. In Book chapter. New Delhi: Indian Agricultural Research Institute. doi: https://doi.org/http://dx.doi.org/10.19103/AS.2016.0003.
- Black, C. A. 1965. Methods of soil analysis part II. In Chemical and microbial properties No.9 in the series of agronomy. Maadison, WI: American Society of Agronomy.
- Dakshina Murthy, K. M., A. Upendra Rao, D. Vijay, and T. V. Sridhar. 2015. Effect of levels of nitrogen, phosphorus and potassium on performance of rice. Indian Journal of Agricultural Research 49 (1):83–7. doi: https://doi.org/10.5958/0976-058X.2015.00012.8.
- Dwivedi, S. K., M. R. Meshram, and N. Pandey. 2014. Response of customized fertilizer on wheat (Triticum Aestivum) under Chattisgarh Condition. The Bioscan 9 (4):1509–12.
- Ebaid, R. A., and S. A. Ghanem. 2000. Productivity of Giza 177 rice variety grown after different winter crops and fertilized with different nitrogen levels. Egyptian Journal of Agricultural Research 78:717–31.
- FAOSTAT. 2018. http://faostat3.fao.org/download/Q/QC/E.
- Fatehjeet, S., J. S. Kang, S. Avtar, and S. Thakar. 2015. Nutrient uptake, nutrient availability and quality parameters of mechanically transplanted rice (Oryza sativa L.) under split doses of nitrogen. Agricultural Science Digest - A Research Journal 35 (2):95–100. doi: https://doi.org/10.5958/0976-0547.2015.00035.X.
- Har Vir Singh, M. L. Dotaniya, R. L. Choudhary, M. D. Meena, and M. K. Meena. 2019. Customized fertilizers: Key for higher crop productivity. Soil Health: Technological Interventions, 2(1), 9–11. doi: https://doi.org/10.1080/03650340.2011.557368.
- Jackson, M. L. 1973. Soil chemical analysis. New Delhi: Prentice Hall of India Pvt. Ltd.
- Jeevika, K., and P. Sreya. 2016. Customized fertilizer: The fertilizers best management practices, Krishisewa, KAU College of agriculture, Thiruvananthapuram.
- Kamble, B. M., and D. K. Kathmale. 2015. Effect of different levels of customized fertilizer on soil nutrient availability, yield and economics of onion. Journal of Applied and Natural Science 7 (2):817–21. doi: https://doi.org/10.31018/jans.v7i2.688.
- Koumeleh, A. S., P. Sharmila, C. D. Uprety, and P. P. Saradhi. 2007. Impact of elevated CO2 on nutrient uptake of rice cultivars. (Oryza sativa L.). Indian Journal of Crop Sciences 2:87–90.
- Lindsay, W. L., and W. A. Norvell. 1978. Development of a DTPA soil test for zinc, iron, manganese and copper. Soil Science Society of America Journal 42 (3):421–8. doi: https://doi.org/10.2136/sssaj1978.03615995004200030009x.
- Lobell, D. B. 2007. The cost of uncertainty for nitrogen fertilizer management: A sensitivity analysis. Field Crops Research 100 (2-3):210–7. doi: https://doi.org/10.1016/j.fcr.2006.07.007.
- Majumdar, S., and N. B. Prakash. 2018. Prospects of customised fertilizers in Indian agriculture. Current Science 115 (2):242–8. doi: https://doi.org/10.18520/cs/v115/i2/242-248.
- Mannan, M. A., M. S. U. Bhuiya, M. I. M. Akhand, and M. M. Saman. 2014. Growth and yield of basmati and traditional aromatic rice as influenced by water stress and nitrogen level. Journal of Science Foundation 10 (2):52–62. doi: https://doi.org/10.3329/jsf.v10i2.17958.
- Morteza, S., N. Alireza, and L. L. Shankar. 2011. Effect of organic fertilizer on growth and yield components in rice (Oryza sativa L). Journal of Agricultural Science 3:217–24. doi: https://doi.org/10.5539/jas.v3n3p217.
- Panda, B. B. 2002. Influence of phosphate solubilizing and mobilizing micro-organisms on phosphorus use efficiency in wheat using 32P as a tracer. Ph.D. Thesis, IARI, New Delhi.
- Pandey, N., A. K. A. Verma, and R. S. Tripathi. 2007. Integrated nutrient management in transplanted hybrid rice (Oryza sativa). Indian Journal of Agronomy 52 (l):40–2.
- Panse, V. G., and P. V. Sukhatme. 1985. Statistical methods for agricultural workers. Book Review (pp. 87–9). New Delhi: Indian Council of Agricultural Research Publication.
- Paul, E. F., B. Tom, B. Frank, and G. Fernando. 2015. Nutrient/fertilizer use efficiency: Measurement, current situation and trends. In Chapter: 1 (pp. 1–26). US: International Plant Nutrition Institute.
- Piper, C. S. 1966. Soil and plant analysis. Bombay: Hans Publications.
- Ram, A., P. W. Suhas, L. S. Kanwar, P. Singh, S. R. Dhaka, and B. L. Dhaka. 2012. Recent approaches in nitrogen management for sustainable agricultural production and eco-safety. Archives of Agronomy and Soil Science 58 (9):1033–60. doi: https://doi.org/10.1080/03650340.2011.557368.
- Ravi, S. K., H. L. Sonboir, and S. Chetna. 2012. Effect of nitrogen levels and splitting on nutrient uptake and soil fertility status in pre-monsoon established rice (Oryza sativa L.). Journal of Pharmacognosy and Phytochemistry, 16(1), 19–22.
- René, N. K., B. Koné, K. K. Firmin, Z. Florant, T. M. Joachim, Y.-K. Albert, D. A. Emanuel, and K. Daouda. 2016. Variations of rainfall and air temperature affecting rainfed rice growth and yield in a Guinea Savanna zone. Journal of Agriculture and Environmental Sciences 5 (1):65–77. doi: https://doi.org/10.15640/jaes.v5n1a7.
- Rohit, K., S. Adesh, K. S. Dinesh, and U. P. Shahi. 2017. Optimization of nitrogen splitting for improving the yield and nitrogen use efficiency in rice (oryza sativa L.) under western plain zone of Utter Pradesh. International Journal of Chemical Studies 5 (6):95–100.
- Selvi, D., S. Mahima Raja, P. Santhy, and B. Rajkannan. 2003. Influence of integrated nutrient management on crop yield, P uptake and available P status of soil in a rice based cropping system. Oryza 40 (3-4):65–9.
- Shekhon, B. S., S. Kaur, and P. Singh. 2012. Evaluation of a customized fertilizer on wheat. Indian Journal of Ecology 39 (1):71–5.
- Singh, F., R. Kumar, and S. Pal. 2008. Integrated nutrient management in rice-wheat cropping system for sustainable productivity. Journal of the Indian Society of Soil Science 56 (2):205–8.
- Singh, B., V. Singh, J. Purba, R. K. Sharma, M. L. Jat, and Y. Singh. 2015. Site-specic nitrogen management in irrigated transplanted rice (Oryza sativa) using an optical sensor. Precision Agriculture 16:455–75. doi: https://doi.org/10.1007/s11119-015-9389-6.
- Subbiah, B. V., and G. L. Asija. 1956. A rapid procedure for estimation of available nitrogen in soils. Current Science 28 (8):259–60.
- Vikas, K., and K. V. Singh. 2015. A study on customized fertilizers on paddy. Agriways 3 (2):89–94.
- Yadav, R. L. 2003. Assessing on-farm efficiency and economics of fertilizer N, P and K in rice wheat systems of India. Field Crops Research 18:39–51. doi: https://doi.org/10.1016/S0378-4290(02)00198-3.
- Zaidi, S. F. A., H. P. Tripathi, and B. Singh. 2007. Effect of N application timings on nitrogen use efficiency of rice. Crop Production Oryza 44 (3):243–6.
- Zelalem, T., T. Tilahun, and A. Dereje. 2017. Effects of time of nitrogen fertilizer application on the growth and productivity of rice (Oryza Sativa L.) in Fogera Plain, North Western Ethiopia. International Journal of Research Studies in Agricultural Sciences 3 (9):36–44. doi: https://doi.org/10.20431/2454-6224.0309006.