
Abstract
The upper Paleocene to lower Eocene Margaret Formation exposed at Stenkul Fiord on southern Ellesmere Island, Nunavut, Canada, represents a nearly continuous terrestrial succession of microfossil-rich clastic sediments and coal. These strata were deposited at a time of extensive tectonic activity associated with Eurekan deformation. The precise chronology of the Eurekan deformation is poorly known. Prior studies at Stenkul Fiord provided a stratigraphic overview and relative age estimates for exposed strata but lack the absolute age control required to investigate the timing of deformation events. Strata at Stenkul Fiord preserve evidence of Arctic forests that may have grown during hyperthermal events that characterized the Paleogene, namely, the Paleocene-Eocene Thermal Maximum (PETM) and Eocene Thermal Maximum 2 (ETM2). A quantitative palynological approach is herein used to define a new higher-resolution biostratigraphic framework for the Margaret Formation strata at Stenkul Fiord. This resulting improved biostratigraphic framework is integrated with new absolute age control of 53.7 ± 0.06 Ma provided by U-Pb ID-TIMS of zircon preserved in an ash bed within the studied succession. Nine pollen zones are defined based on cluster analysis, NMDS ordination, first- and last occurrences of taxa, and angiosperm pollen taxa diversity (H′). The presence of thermophilic pollen taxa at Stenkul Fiord provides evidence of climates related to the globally warm climates during the early Paleogene.
1. Introduction
The Canadian Arctic Archipelago and Greenland drifted apart as a result of the Eurekan Orogeny during the Late Cretaceous to Miocene (). The Eurekan deformation (von Gosen et al. Citation2012; Piepjohn et al. Citation2016) was a pan-arctic event that coincided with the emplacement of several mantle plumes originating beneath west Greenland (Harrison et al. Citation1999) and formed extensive deformation zones (Thorsteinsson and Tozer Citation1970; Balkwill Citation1978; Okulitch and Trettin Citation1991; Piepjohn et al. Citation2016; Gion et al. Citation2017). Counter-clockwise and northward movement of the Greenland plate and simultaneous seafloor spreading occurred in the Labrador Sea, Baffin Bay, and North Atlantic (Ricketts Citation1986; Riediger and Bustin Citation1987; Harrison et al. Citation1999). Tectonics associated with Eurekan deformation resulted in uplift that created the Cornwall and Princess Margaret arches and segmented the Carboniferous-Paleogene Sverdrup Basin into several sub-basins, including the Strand Fiord and the Remus sub-basins (Miall Citation1986), which accommodated thick deposits of terrestrial clastic sediments of the Eureka Sound Group (Riediger and Bustin Citation1987). Precise ages of Eurekan deformation events are poorly known, as is the temporal succession of activation of folding and faulting, as well as reactivation of previous deformation associated with the Ellesmerian Orogeny (Piepjohn et al. Citation2016). A more precise relative and absolute chronology is needed to determine the tectonic evolution of the eastern Canadian Arctic Archipelago during the Cenozoic (von Gosen et al. 2019).
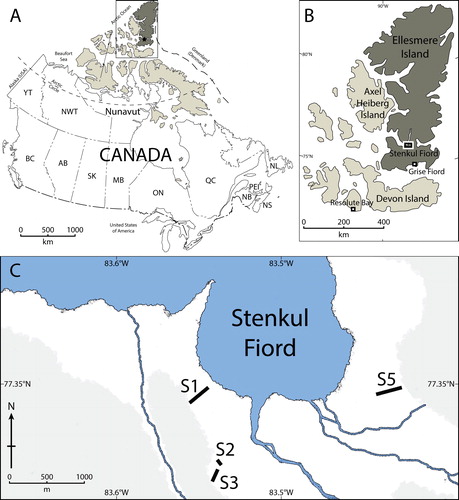
Figure 1. (A) Map of Canada showing the Canadian Arctic Archipelago (beige) and Ellesmere Island (brown). (B) Closer view of Ellesmere Island showing the location of Stenkul Fiord. Modified from Atlas of Canada. (C) Outline of the southern shore of Stenkul Fiord. The black lines and numbers show measured and sampled sections. The grey shading shows topographic elevation >100 m above sea level, interpreted from satellite imagery. Source: Contains information licensed under the Open Government Licence – Canada.
During the late Paleocene to early Eocene, concurrent with Eurekan deformation, global temperatures had become substantially warmer than the already warm conditions of the Late Cretaceous. The Arctic was ice free and inhabited by a diverse flora and fauna associated today with subtropical environments, such as palms and mangroves, also including plants of mixed conifer-broadleaf rain forests, and animals like brontotheres, Coryphodon, crocodiles, primates, tapirs, and turtles (Zachos et al. Citation2008; Sluijs et al. Citation2009; Eberle and Greenwood Citation2012; Suan et al. Citation2017; West et al. Citation2019; Willard et al. Citation2019).
The early Eocene was punctuated by several transient short-term episodes of global warming, referred to as hyperthermals, that were superimposed over a gradual long-term warming trend. These hyperthermals were caused by pulses of carbon, released into the global exogenic carbon pool (Lourens et al. Citation2005; Zachos et al. Citation2005; Lauretano et al. Citation2015; Jones et al. Citation2019). Two prominent hyperthermals were the Paleocene-Eocene Thermal Maximum (PETM) and the Eocene Thermal Maximum 2 (ETM2), radiometrically dated from ash layers and orbitally tuned marine sediments (McInerney and Wing Citation2011; Westerhold et al. Citation2009; Westerhold et al. Citation2017). The PETM occurred ∼55.93–55.749 Ma (Westerhold et al. Citation2017; Westerhold et al. Citation2018), during which Arctic Ocean temperatures increased 5–8 °C and air temperatures increased by 2–3.5 °C to a mean annual temperature of 13–21 °C (Kennett and Stott Citation1991; Koch et al. Citation1992; Zachos et al. Citation2001; Sluijs et al. 2006; Weijers et al. Citation2007; McInerney and Wing Citation2011; Eldrett et al. Citation2014; Willard et al. Citation2019). The ETM2 at ∼54.05–53.95 Ma and its associated climatic changes in the Arctic were similar to those of the PETM; temperatures increased and climate was humid (Sluijs et al. Citation2009; Suan et al. Citation2017; Westerhold et al. Citation2017; Willard et al. Citation2019). Arctic sea surface temperatures increased by 3–5 °C (Sluijs et al. Citation2009; Schoon et al. Citation2011).
The late Paleocene to middle Eocene (ca. 57–38 Ma) sediments on Ellesmere and Axel Heiberg islands, part of the Canadian Arctic Archipelago, Nunavut, Canada (), preserve fossil evidence of past terrestrial environments, such as in situ fossil tree trunks, leaves, seeds, and pollen and spores (Eberle and Greenwood Citation2012; West et al. Citation2019). These fossils indicate that during non-hyperthermal conditions of the early Paleogene, the Arctic supported lush swamp and forest communities composed of conifers such as redwoods and cedars (Cupressaceae, e.g. Metasequoia, Chamaecyparis). Members of the Pinaceae (e.g. Larix, Picea, Pinus, Tsuga) were also common, and a diverse dicotyledonous angiosperm flora with alder and/or birch (Alnus and Betula spp.), linden (Tilia spp.) and other deciduous broadleaf trees were also important (Hills and Ogilvie Citation1970; Kalgutkar and McIntyre Citation1991; Frederiksen et al. Citation1994; Greenwood and Basinger Citation1994; McIver and Basinger Citation1999; Greenwood et al. Citation2010; Eberle and Greenwood Citation2012; Suan et al. Citation2017; Willard et al. Citation2019; West et al. Citation2019). During the PETM and ETM2 hyperthermal events, Arctic vegetation was characterized by broadleaf-forests and coniferous swamp forests that notably included thermophilic elements such as palms (Arecaceae) and mangroves (Avicennia sp.) (Weijers et al. Citation2007; Sluijs et al. Citation2009; Suan et al. Citation2017; Salpin et al. 2019; Willard et al. Citation2019; Suc et al. Citation2020). In the Beaufort-Mackenzie Basin region of the Canadian Arctic, the stratigraphic position of the base of the PETM hyperthermal was determined using carbon isotope stratigraphy in marine sediments (McNeil and Parsons Citation2013). The base of the PETM in the Beaufort-Mackenzie Basin is also characterized by the introduction of novel pollen taxa, the presence of thermophilic pollen such as Platycaryapollenites spp. and Tilia spp., and the occurrence of the dinoflagellate cyst Apectodinium augustum (McNeil and Parsons Citation2013). Another study of the Beaufort-Mackenzie Basin region determined the presence of Avicennia stratigraphically below the ETM2 (Salpin et al. 2019).
The palynoflora preserved in the sediments recovered from the Lomonosov Ridge shows notable responses of the floral assemblage to early Eocene hyperthermals—there are numerous first occurrences of pollen and spore taxa during the PETM and ETM2, including palms (Willard et al. Citation2019) and Avicennia (Suc et al. Citation2020). On Faddeevsky Island, New Siberian Islands, Russia, the PETM was identified using carbon isotope stratigraphy, and is associated with increases in abundance of taxodioid Cupressaceae (aff. Metasequoia or Taxodium), palm, and Avicennia pollen, as well as high kaolinite content (Suan et al. Citation2017). The geologically rapid onset of the PETM and ETM2, identified in marine sediments preserved on the Lomonosov Ridge (Pagani et al. Citation2006; Sluijs et al. Citation2009; Willard et al. Citation2019; Suc et al. Citation2020), and manifestations of their abrupt warming on regional vegetation composition provides an important datum for chronostratigraphic correlation and biostratigraphic age control (McNeil and Parsons Citation2013).
1.1. Stenkul Fiord
At Stenkul Fiord on southern Ellesmere Island (; 77.35°N, 83.5°W), the exposed upper Paleocene to lower Eocene Margaret Formation () is composed of nearly continuous deposits of clastic sediment and coal (; Riediger and Bustin Citation1987; Eberle and Greenwood Citation2012; Reinhardt et al. Citation2013; Reinhardt et al. Citation2017) that are rich in pollen and spores (Kalkreuth et al. Citation1996; Harrington et al. Citation2012). Strata are interpreted as proximal delta-front to delta-plain deposits and feature fining upward cycles of interbedded sandstones, mudstones, and lignitic coals (Miall Citation1984; Miall Citation1986; Ricketts Citation1986; Riediger and Bustin Citation1987; Kalkreuth et al. Citation1998). As part of the Eureka Sound Group, the Margaret Formation at Stenkul Fiord was deposited in the Remus Basin, a sub-basin of the larger Sverdrup Basin that formed in the early Paleogene during Eurekan deformation (Miall Citation1986). There is pronounced tectonic deformation of these strata associated with Eurekan deformation, seen as folding, reverse-, normal-, and strike-slip faulting (; Piepjohn et al. Citation2016; Reinhardt et al. Citation2017; von Gosen et al. 2019).
Figure 2. Early Paleogene lithostratigraphic chart showing the chronostratigraphic positions (coloured horizontal bars) of early Eocene hyperthermals at Stenkul Fiord and Split Lake. The Graybullian, which is mentioned in this study, is a substage of the Wasatchian stage and falls within the early Eocene. The sampled sections column shows preliminary stratigraphic placement of four sampled sections and the volcanic ash layer MA-1. Modified from West et al. (Citation2019).
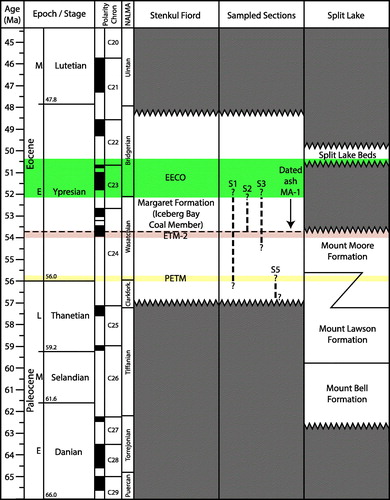
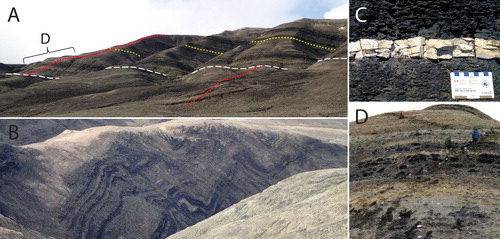
Figure 3. (A) Exposed strata of the Margaret Formation at Stenkul Fiord. The red dotted line shows the sampled path, which is offset along the white sand marker bed (white dashed line). The yellow dashed line shows the approximate stratigraphic placement of the dated volcanic ash layer MA-1. (B) Folded strata near S3 at Stenkul Fiord. (C) Volcanic ash layer MA-3 at the base of S2. (D) Exposed strata at S1 and sampled path indicated by small white sample bags and exposed fresh sediment. Persons for scale. Location of shown sediments in (D) are indicated in (A) by the bracketed D.
Sediments at Stenkul Fiord may preserve the remains of Arctic forests that grew during the PETM and ETM2 and possibly smaller hyperthermals such as the I1 (Reinhardt et al. Citation2019), calibrated to 53.665 Ma by Westerhold et al. (Citation2017). The I1 hyperthermal has not previously been reported in terrestrial Arctic sediments. The pronounced climatic changes associated with the PETM and the ETM2 hyperthermals are expected to have affected the vegetation at Stenkul Fiord and other high northern latitude locations where taxa may have been living at or near ecological tolerances due to the duration of the polar night. Floral responses to climatic changes are archived in pollen and spore assemblages preserved in strata during deposition. Detailed sampling of terrestrial sediments has previously been performed at Stenkul Fiord at a resolution high enough to allow an observation of floral changes in response to environmental changes of the hyperthermals (cf. Kalkreuth et al. Citation1996; Harrington et al. Citation2012). However, the previous palynological analyses could at the time not be integrated with absolute time. Recently, a well-constrained radiometrically dated ash layer was identified at Stenkul Fiord (von Gosen et al. 2019), providing much-needed absolute age control.
The objectives of this study are to evaluate compositional changes of floral assemblages in response to early Eocene hyperthermal intervals to produce a precise quantitative pollen zonation scheme for Stenkul Fiord that can be applied at a local, regional, and pan-hemispheric scale. The radiometrically dated volcanic ash (MA-1; von Gosen et al. 2019) provides an absolute age that strengthens the stratigraphic framework of this study. A fine-resolution pollen zonation scheme, as presented here, will refine correlation of stratigraphic sequences of existing litho- and biostratigraphy and will provide a palynostratigraphic framework to impart insight into the chronology of the Eurekan deformation events and to evaluate floral responses to early Eocene hyperthermals.
1.2. Stratigraphy of Stenkul Fiord
Studies of the depositional environment at Stenkul Fiord by Riediger and Bustin (Citation1987) established a detailed lithostratigraphy for the region. Biostratigraphic age control was provided primarily by determination of Eocene-aged invertebrates (Riediger and Bustin Citation1987). Rare dinoflagellate cysts did not provide age control (McIntyre Citation1994). McIntyre (Citation1994) established a late Paleocene to early Eocene age for the Stenkul Fiord strata using biostratigraphic ages of pollen and spores, which Kalkreuth et al. (Citation1996) subsequently used in their study. Harrington et al. (Citation2012) conducted an additional palynological study of Stenkul Fiord but assigned an early Eocene age based on the composition of the vertebrate fauna found in local sandstone units using the North American Land Mammal Age (NALMA) scheme of Woodburne (Citation2004). The vertebrate fauna indicates an early Eocene age of 53.0 to 54.5 Ma (Wasatchian – Graybullian NALMA) (Eberle and Greenwood Citation2012; Harrington et al. Citation2012; Eberle and Eberth Citation2015; West et al. Citation2015). At the time studies such as those by Kalkreuth et al. (Citation1996) and Harrington et al. (Citation2012) were conducted, radiometric ages for these sediments were unavailable and thus could not be integrated with absolute ages, therefore providing only relative ages.
Pollen zonation of the Canadian Arctic by Harrison et al. (Citation1999) was based on data from the Beaufort-Mackenzie Basin and Axel Heiberg Island by Sweet et al. (Citation1989) and D.J. Mclntyre (in Dixon Citation1996). For the latest Paleocene (∼57 Ma) into the middle Eocene (∼41 Ma). Three pollen zones were recognized: the Pistillipollenites mcgregorii zone, Aquilapollenites tumanganicus zone, and the Juglans sp.–Tilia sp.–Ilex sp. zone, defined by first appearances of these taxa (Harrison et al. Citation1999). Two of these genera, Juglans and Tilia, occur frequently at Stenkul Fiord and provide a late Paleocene to early Eocene age of local sediments (McIntyre Citation1994; Kalkreuth et al. Citation1996; Harrington et al. Citation2012). This pollen zonation scheme can herein be refined using higher density sampling and integration of results from U-Pb radiometric ages of an ash layer (von Gosen et al. 2019).
The exposed Margaret Formation at Stenkul Fiord () consists of four sedimentary units separated by unconformities and/or disconformities (von Gosen et al. 2019). The lowermost Unit 1 is latest Paleocene-early Eocene age, units 2 and 3 are early Eocene age, and the uppermost Unit 4 may be of middle Eocene age (von Gosen et al. 2019). Relative ages of the sedimentary units were determined primarily using multiple U-Pb radiometric ages (ID-TIMS) recovered from zircons preserved within a laterally extensive ash layer (; Reinhardt et al. Citation2013; Reinhardt et al. Citation2017; von Gosen et al. 2019). The ash layer, named MA-1, occurs stratigraphically near the unconformity between units 2 and 3, and provided an age of 53.7 ± 0.06 Ma (von Gosen et al. 2019).
2. Materials and methods
This study is based on material collected at Stenkul Fiord, Ellesmere Island, Nunavut, Canada, in July 2017 () as part of a joint German-Canadian expedition (Circum-Arctic Structural Events 19 – CASE 19) co-led by the German Federal Institute for Geosciences and Natural Resources (BGR) and the Geological Survey of Canada (GSC). A total of four sections (S1, S2, S3, S5; and ) were chosen to capture the longest possible continuous stratigraphic succession. Sections were also chosen where volcanic ash layers were preserved and based on uncertainties of stratigraphic placement of sections found along the main W-E valley to refine interpretation of the stratigraphy and its deformation (see von Gosen et al. 2019). The exposure at S1 faces NE, on a slope towards the fiord ( and ). S1 sediments, however, have been affected by syn-sedimentary deformation (von Gosen et al. 2019). S2 was measured and sampled on the limb of an anticline fold on the north side of the main W-E valley, opposite to S3 within the hinge of an anticline fold on the south side of the main W-E valley (von Gosen et al. 2019). S5 faces W towards the fiord, opposite to S1, and is outside the studied area of von Gosen et al. (2019). The east side near S5 is likely offset to the western area around S1, S2, and S3 by a larger fault or set of faults (Riediger and Bustin Citation1987). However, sedimentation between eastern and western strata may also have been continuous and the bedding planes were subsequently tilted instead of faulted (West et al. Citation2015). At S5, field observations suggest the strata are undeformed but likely were also affected by syn-sedimentary deformation.
Ninety-six samples were collected from outcropping exposures of the Margaret Formation for palynological analyses. Approximately 100 g of organic-rich material (mostly coal) were collected from sediments, where present. Collections were made at every successive thin (<0.5 m) organic-rich layer, the bottom and top of thicker layers (0.5 m up to 1 m), and every 1–1.5 m for layers thicker than 1 m. Material from rare mudstone was also collected, representing 7 out of the 96 samples collected (marked in and Supplementary Data Figures A1–A4).
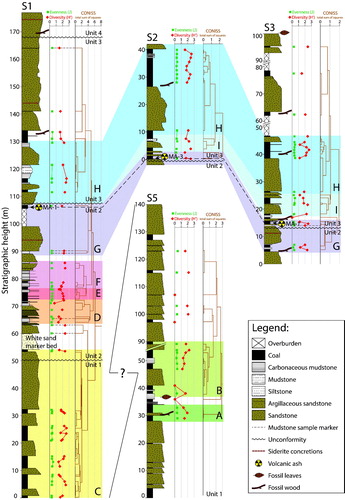
Figure 4. Lithostratigraphy of correlated measured sections (S5, S1, S2, and S3) at Stenkul Fiord with superimposed pollen zones (zones A–I). Units 1–4 of von Gosen et al. (2019) are shown, separated by unconformities, as well as the dated volcanic ash layers (MA-1 and MA-3). The green graph shows Pielou’s species evenness (J), the red graph shows the Shannon-Wiener diversity index (H′) calculated from the angiosperm pollen sum only, because changes in the relative abundance of angiosperms are sensitive to environmental change (Nichols and Ott Citation1978). The orange graph shows the clustering of CONISS cluster analysis. These data points indicate stratigraphic locations of all sampled strata. The brown dashed lines connecting data points of J, H′, and CONISS clusters indicate the 7 mudstone samples. The stratigraphic placement of S5 below S1 is currently uncertain and is shown by a question mark.
The organic-rich material collected at Stenkul Fiord was prepared by Global Geolab Limited, Alberta, Canada, to isolate palynomorphs following standard techniques (Faegri and Iversen Citation1964; Ediger Citation1986; Traverse Citation2007), including washing, acid digestion with hydrochloric and hydrofluoric acids, oxidation with Schulze’s solution, staining with Safranin O, and then residues were mounted using liquid bioplastic. Samples were sieved at 150 µm to remove large particles. All microscope slides are currently on loan from the Government of Nunavut and are stored at the Geological Survey of Canada, Calgary, Alberta. Curation, preparation, and specimen numbers are shown in Supplementary Data Table A1.
Identification and enumeration of palynomorphs were conducted using an Olympus BX-51 microscope equipped with an Olympus SC100 camera at 40x magnification and at 100x magnification under oil immersion. A list of identified pollen and spore taxa and their taxonomic authorities are shown in Supplementary Data Table A2. Quantitative analyses are based on minimum counts of 300 or more pollen and spore grains from obligately terrestrial plants (Supplementary Data Figures A5–A8). The slides were subsequently scanned for taxa not encountered during initial counts that may be biostratigraphically important (e.g. Harrington et al. Citation2005). Preparations with poorly preserved palynomorphs were also scanned where counting was not possible. Thermal Alteration Index of palynomorphs was assessed on kerogen (unoxidized) slides and is 2-, indicating minor thermal alteration (Pearson Citation1984).
Lithostratigraphic column reconstructions ( and Supplementary Data Figures A1–A4) were prepared using Adobe® Illustrator and the FGDC Digital Cartographic Standard for Geologic Map Symbolization plug-in (U.S. Geological Survey Citation2006). Lithostratigraphic correlation of sections () containing the dated volcanic ash layer was done primarily in the field, based on prior understanding of the lithology of Stenkul Fiord with the assistance of a map derived from a high-resolution satellite image, aerial photographs, and the known age of the volcanic ash layer MA-1 (Reinhardt et al. Citation2017; von Gosen et al. 2019).
Microsoft® Excel was used to plot raw abundances of palynomorphs as range diagrams, showing first occurrences (FOs) and last occurrences (LOs) of taxa for each section (Supplementary Data ). A range chart showing key pollen taxa for all four sections () was produced with Adobe® Illustrator. The stratigraphic distribution of the relative abundance of pollen and spore taxa is shown for each of the measured sections and plotted using TiliaView (Grimm Citation1993) and is shown in Supplementary Data Figures A9–A12. Sample grouping was performed using stratigraphically constrained cluster analysis (CONISS) on square root transformed relative abundance data (Grimm Citation1987) and is shown with the lithostratigraphy in , as well as in the appendix (Supplementary Data Figures A9–A12). All taxa with a relative abundance of 3% or greater per sample were included in the CONISS analysis included as recommended by Grimm (Citation1987), but with aquatic taxa (Sparganiaceaepollenites reticulus and Graminidites sp.) and the bisaccates Piceaepollenites sp. and Pinuspollenites sp. removed. This treatment reflects that pollen derived from Pinus or Picea ancestors, such as Piceapollenites and Pinuspollenites, likely originated from long distance transport (Mudie and McCarthy Citation1994) and that these taxa can be notoriously overrepresented in modern pollen spectra. Pollen from obligately aquatic plants are excluded as they represent a local signal (Traverse Citation2007). Shannon Diversity Index (H′) and Pielou’s species evenness (J) were computed in R (R Development Core Team Citation2018) and the RStudio (RStudio Team Citation2016) software extension, using the vegan package (Oksanen et al. Citation2007). Only the angiosperm-sum H′ and J values are displayed in as changes in the relative abundance of angiosperms are of particular interest as they are sensitive to environmental change (Nichols and Ott Citation1978). Diversity (H′) and evenness (J) values for angiosperm pollen taxa are shown in Supplementary Data Table A3.
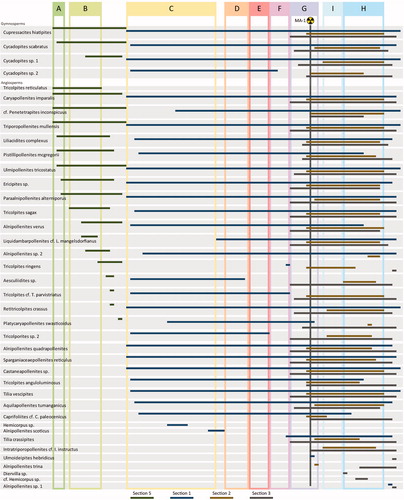
Figure 5. Range diagram of key gymnosperm and angiosperm pollen taxa for each section shown in different colours. Palynomorph taxa have been sorted by their first occurrences. Pollen zones are superimposed for relative time control. The stratigraphic location of the volcanic ash MA-1 is shown by the trefoil, providing a temporal reference point of ∼53.7 Ma (von Gosen et al. 2019).
Non-metric multidimensional scaling (NMDS), regarded as one of the most robust unconstrained ordination methods in community ecology (Minchin Citation1987), was performed using the vegan package (Oksanen et al. Citation2007) in R (R Development Core Team Citation2018). As a non-parametric ordination technique, NMDS employs ranked distances to assess the similarity between samples. Samples that plot close to each other are similar in composition. The relative abundance of pollen and spores from samples across all four sections were included. This analysis was performed in two dimensions and employed the Bray-Curtis distance metric. Runs were repeated until a convergent solution was reached. Within-sample normal confidence ellipses with a t-distribution at 95% (Fox and Weisberg Citation2011) were added for each of the pollen zones to simplify the illustration of NMDS results ().
Figure 6. NMDS analysis of samples from all sections at Stenkul Fiord, separated by colour according to the pollen zones. Confidence ellipses have been superimposed to show how well the clusters for each pollen zone have been constrained and the degree of compositional variance within a pollen zone.
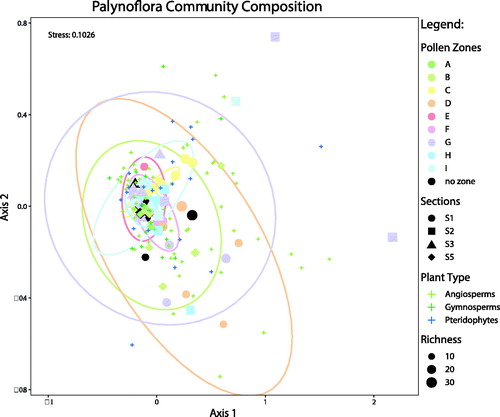
Plate 1. Important Margaret Formation angiosperm pollen taxa. Given are the sample number, GSC curation number (C-number), GSC Calgary Palynology Laboratory preparation number (P-number), GSC Specimen numbers (pending), and England Finder coordinates. Scale bars = 10 µm. 1. Alnipollenites verus (Potonié) Potonié 1934, 17GTA141, C-626943 P5371-136, L30/1. 2. Alnipollenites trina (Stanley) Norton in Norton and Hall 1969, 17GTA049, C-625845 P5371-29, N44/4. 3. Castaneapollenites sp. Raatz 1938, 17GTA038, C-625834 P5371-18, V45/2. 4. Aquilapollenites tumanganicus Bolotnikova 1973, 17GTA013, C-625826 P5371-10, E35. 5. Diervilla sp. Kalkreuth et al. 1993, 17GTA045, C-625841 P5371-25, C34/4. 6. Erdtmanipollis procumbentiformis (Samoilovitch) Krutzsch 1966, 17GTA135, C-626937 P5371-130, G35/3. 7. cf. Aesculiidites sp. Elsik 1968, 17GTA004, C-625817 P5371-1, L45. 8. Caprifoliites cf. C. paleocenicus (Wodehouse) Pocknall and Nichols 1996, 17GTA038, C-625834 P5371-18, P41/3. 9. Siltaria hanleyi (Traverse) Pocknall and Nichols 1996, 17GTA005, C-625818 P5371-2, U31/1. 10. cf. Bombacacidites sp. Couper 1960, 17GTA037, C-625833 P5371-17, X45. 11. Liquidambarpollenites cf. L. mangelsdorfianus (Traverse) Potonié 1960, 17GTA074, C-626894 P5371-71, Q40/4. 12. Caryapollenites imparalis Nichols and Ott 1978, 17GTA053, C-625849 P5371-33, V37/2. 13. Platycaryapollenites swasticoidus Elsik 1974, 17GTA056, C-625852 P5371-36, S39. 14. Tilia crassipites Wodehouse 1933, 17GTA056, C-625852 P5371-36, U-39/2. 15. Tilia vescipites Wodehouse 1933, 17GTA073, C-626893 P5371-70, Q42. 16. Ericipites sp. Wodehouse 1933, 17GTA066, C-626885 P5371-62, V26/2. 17. Liliacidites complexus (Stanley) Leffingwell 1971, 17GTA045, C-625841 P5371-25, L45. 18. Ulmipollenites krempii (Anderson) Frederiksen 1979, 17GTA062, C-626881 P5371-58, J42/4. 19. Ulmipollenites tricostatus (Anderson) Farabee and Canright 1986, 17GTA073, C-626893 P5371-70, Q45/4. 20. Ulmoideipites hebridicus (Simpson) Sweet 1986, 17GTA073, C-626893 P5371-70, K39/1. 21. Tricolpites ringens Ward 1986, 17GTA056, C-625852 P5371-36, S35/4. 22. Pistillipollenites mcgregorii Rouse 1962, 17GTA057, C-626876 P5371-53, H36/1. 23. Sparganiaceaepollenites reticulus (Doktorowicz-Hrebnicka 1960) Krutzsch and Vanhoorne 1977, 17GTA005, C-625818 P5371-2, T40. 24. Paraalnipollenites alterniporus (Simpson) Srivastava 1975, 17GTA133, C-626935 P5371-128, R29/3. 25. Triporopollenites mullensis (Simpson) Rouse and Srivastava 1972, 17GTA033, C-625829 P5371-13, V35. 26. Tricolpites anguloluminosus Anderson 1960, 17GTA004, C-625817 P5371-1, O42/1. 27. Tricolpites reticulatus Cookson 1947, 17GTA073, C-626893 P5371-70, W46/3. 28. Tricolpites sagax Norris 1967, 17GTA013, C-625826 P5371-10, L30/2. 29. Retitricolpites crassus Samoilovitch 1965, 17GTA005, C-625818 P5371-2, Q33/2. 30. Echitricolpites supraechinatus Pocknall and Nichols 1996, 17GTA063, C-626882 P5371-59, M35/1.
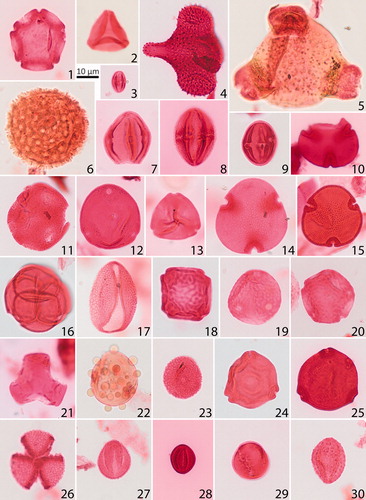
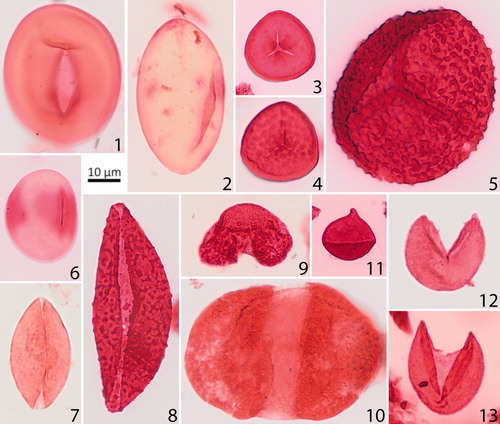
Plate 2. Important Margaret Formation gymnosperm pollen and pteridophyte spore taxa. Given are the sample number, GSC curation number (C-number), GSC Calgary Palynology Laboratory preparation number (P-number), and England Finder coordinates. Scale bars = 10 µm. 1. Laevigatosporites cf. L. pseudodiscordatus (Krutzsch) Krutzsch and Vanhoorne 1977, 17GTA057, C-626876 P5371-53, J45/1. 2. Ovoidites elongatus (Hunger) Krutzsch 1959, 17GTA009, C-625822 P5371-6, L34/1. 3. Stereisporites antiquasporites (Wilson and Webster) Dettmann 1963, 17GTA033, C-625829 P5371-13, R37. 4. Stereigranisporis regius (Drozhastichich) Ravn and Witzke 1995, 17GTA062, C-626881 P5371-58, L33/1. 5. Baculatisporites primarius (Wolff 1933) Thomson and Pflug 1953, 17GTA070, C-626889 P5371-66, G43/1. 6. Laevigatosporites haardti (Potonié & Venitz) Thomson and Pflug 1953, 17GTA011, C-625824 P5371-8, J45-1. 7. Cycadopites scabratus Wodehouse 1933, 17GTA135, C-626937 P5371-130, D35/1. 8. Cycadopites sp. Wodehouse 1933, 17GTA006, C-625819 P5371-3, D38/1. 9. Pinuspollenites sp. Erdtman 1943, 17GTA056, C-625852 P5371-36, W35/1. 10. Cathayapollenites sp. Sivak 1976, 17GTA068, C-626887 P5371-64, O41/4. 11. Sequoiapollenites paleocenicus Stanley 1965, 17GTA044, C-625840 P5371-24, M33/1. 12. Cupressacites hiatipites (Wodehouse 1933) Krutzsch 1971, 17GTA027, C-626438 P5371-49, V45. 13. Cupressacites hiatipites (Wodehouse 1933) Krutzsch 1971, 17GTA056, C-6258, 52 P5371-36, N45/3.
3. Results
3.1. Lithostratigraphy
For this study, the four stratigraphic sections were placed within the regional map and structural interpretation of von Gosen et al. (2019) () and are referred to the lithostratigraphic framework of Riediger and Bustin (Citation1987) where possible (Supplementary Data ). References to the lithostratigraphic members of Riediger and Bustin (Citation1987) are given for the pollen zones (see below). The area southeast of Stenkul Fiord () consists of four informal lithostratigraphic units within the Margaret Formation (von Gosen et al. 2019). Sections 1, 2, and 3 occur within the study area of von Gosen et al. (2019) and can be placed within their stratigraphic interpretation. Section 5 does not fall within their mapped area and its stratigraphic placement is inferred, based on findings of previous studies. Riediger and Bustin (Citation1987) assumed a late Paleocene age because the area around S5 is likely offset by a fault. West et al. (Citation2015) also refer to the east side of Stenkul Fiord to be of late Paleocene age; they assume continued sediment accumulation of strata well into the early Eocene, which today are preserved on the west side of Stenkul Fiord. Section 5 (S5; 140 m height) occurs within Member 2 of Riediger and Bustin’s (Citation1987) lithostratigraphy (). Therefore, S5 may be an older part of Unit 1 (von Gosen et al. 2019). This section is made up of mainly fining-upward massive sandstones interbedded with coals. The lowermost part of Section 1 (S1; 177 m total height) falls within sedimentary Unit 1 (von Gosen et al. 2019). These sediments are still described as Member 2 by Riediger and Bustin (Citation1987) (). Here, multiple intervals of fining-upward and poorly lithified sandstones are interbedded with coals. A visually inconspicuous unconformity, originally identified from satellite imagery (von Gosen et al. 2019), within a sandstone separates Unit 1 from Unit 2. Near the base of Unit 2 in S1, a white quartz sandstone horizon (Harrington et al. Citation2012; Reinhardt et al. Citation2013; von Gosen et al. 2019) stands out in a lithology of mainly dark-coloured rock (). This single horizon was described as Member 3 by Riediger and Bustin (Citation1987) because it was interpreted to represent a marine transgression (Supplementary Data Figure A2). Above the white sandstone in Unit 2, moving into Member 4 of Riediger and Bustin (Citation1987), a series of once again terrestrial interbedded mudstones and coal seams are overlain by thick sandstones and some covered intervals (Supplementary Data ). Beginning at the middle of Unit 2, deformation is seen as folding, reverse-, normal-, and strike-slip faulting (von Gosen et al. 2019).
The upper part of Unit 2 can also be observed at the base of Section 3 (S3; 100 m height). Unit 2 is separated from Unit 3 by another unconformity. The base of Section 2 (S2; 42 m in height) sits on top of this unconformity. Near the top of Unit 2 in S1, a thin volcanic ash layer MA-1 occurs (von Gosen et al. 2019), which is dated to 53.7 ± 0.06 Ma using U/Pb absolute ages from zircons found within the ash. S2 and S3, however, each contain a volcanic ash layer at the base of Unit 3 and above the unconformity. At S2, the volcanic ash layer MA-3 occurs (), which is assumed based on its stratigraphic position to be only slightly younger than MA-1 (von Gosen et al. 2019). At S3, volcanic ash layer MA-1 is found again. Unit 3 consists of some interbedded coals, mudstones, and siltstones, but is dominated by massive sandstones and some covered intervals near the top. Deformation of the Margaret Formation strata extends until the top of Unit 3 (von Gosen et al. 2019).
The boundary between units 3 and 4 cannot be directly observed in the massive sandstones of S1 and S3 but was also identified and mapped with help of satellite imagery (von Gosen et al. 2019). The area around S2 and S3 was not visited as part of Riediger and Bustin’s (Citation1987) lithostratigraphic study but likely fits into their Member 4 (Supplementary Data ).
3.2. Palynology
The Stenkul Fiord palynoflora is comprised of 107 taxa identified in preparations from samples collected from the four sections (Supplementary Data Table A1). Angiosperms are particularly ecologically sensitive to climate changes and evolved rapidly during the early Paleogene (Nichols and Ott Citation1978). Many fossil angiosperm pollen taxa have short stratigraphic ranges and are therefore biostratigraphically useful (Faegri and Iversen Citation1964; Nichols and Ott Citation1978; Punt et al. Citation2007; Traverse Citation2007). The results of the Stenkul Fiord palynological analysis therefore focus almost exclusively on angiosperm pollen taxa and a single gymnosperm taxon, Cupressacites hiatipites, due to observed shifts in its relative abundance at key stratigraphic intervals of the Margaret Formation at Stenkul Fiord. Most other gymnosperm pollen taxa and pteridophyte spore taxa are long-ranging and do not contribute to the interpretation of the palynostratigraphy. Shannon Diversity Index (H′) and Pielou’s evenness (J) calculated using angiosperms only are shown with the lithostratigraphy in .
Notable and common angiosperm pollen taxa are shown in Plate 1, pteridophyte spores and gymnosperm pollen are shown in Plate 2. Supplementary Data Table A2 shows a list of the encountered taxa and shows a range chart for key pollen taxa arranged by first occurrences (FOs) and last occurrences (LOs). shows the results of the CONISS cluster analysis for all sections. Parts of the stratigraphy that are not assigned to any pollen zones are poorly preserved samples with low palynomorph counts, and were thus not placed into the well-defined clusters by CONISS cluster analysis.
Nine informal pollen zones () are defined here for the Margaret Formation at Stenkul Fiord from oldest to youngest, based primarily on stratigraphically constrained cluster analysis. Pollen zones were selected and correlated between sections based on quantitative analyses of observed palynomorphs (FOs and LOs) and diversity (H′) and evenness measurements (J) of angiosperm pollen taxa. The pollen zones were subsequently tested with NMDS ordinance analysis ().
The oldest section, S5, contains a lower angiosperm pollen taxa diversity (H′) compared to all other sections, but the diversity is higher within pollen zones A and B at ∼30 m and 45–90 m (). No pollen zones were assigned to the upper part of this section because preparations contained poorly preserved and few palynomorphs. At the base, S1 immediately begins with higher angiosperm pollen taxa diversity (H′) in zone C ( and Supplementary Data Figure A6), which decreases soon after at ∼55 m, but immediately recovers to higher levels until the top of the section. CONISS cluster analysis determined well-defined clusters for the six pollen zones (C–H) in S1 (). The shorter sedimentary succession S2 shows an angiosperm pollen taxa diversity (H′) similar to the upper part of S1 throughout ( and Supplementary Data Figure A7) and, based on cluster analysis, contains two pollen zones also found in S1 (G & H) and another pollen zone not observed in S1 (pollen zone I; ). The last section, S3, also contains the same three pollen zones (G, H, & I) as S2 and shows similarly higher angiosperm pollen taxa diversity (H′) as S2 ( and Supplementary Data Figure A8). The top of S3 was not assigned to a pollen zone because sampling resolution was low due to the presence of thick sandstones.
The ordination technique NMDS was carried out to assess compositional variation between palynological samples and pollen zones through time (). The composition of all pollen zones identified by CONISS is relatively similar overall; the analysis does not expose certain pollen zones that are composed of a unique palynoflora compared to other pollen zones. Some pollen zones, including zones C, E, and F form the best-constrained clusters, indicating lower compositional variation within each pollen zone. However, pollen zones such as A, D, and G produce larger, poorly constrained clusters, indicating greater compositional variation within each pollen zone. The results of NMDS ordinance therefore provide a deeper look into the character of the vegetation that is represented by each pollen zone idenfitied with CONISS cluster analysis.
3.3. Pollen zone A
This zone occurs in the lower half of S5 ( Supplementary Data Figures A5 and A9), which is part of the lower Unit 1 of von Gosen et al. (2019) and Member 2 of Riediger and Bustin (Citation1987) (Supplementary Data ). This zone is part of a well-defined cluster and contains an angiosperm pollen diversity (H′) that is similar throughout S5 (∼1.6). NMDS ordinance of this pollen zone provides a poorly constrained cluster, indicating greater compositional variation between samples (). First occurrences of palynomorphs do occur in zone A () but this zone sits at the base of S5 and older sediments were not sampled. A single grain of Pistillipollenites mcgregorii pollen was observed in zone A and average relative abundances of Cupressacites hiatipites pollen in this pollen zone are high (∼78%). The dominant angiosperm pollen taxa in pollen zone A are long-ranging types, including Triporopollenites mullensis and cf. Penetetrapites inconspicuous (Plates 1 and 2).
3.4. Pollen zone B
Zone B occurs in the middle part of S5 as a well-defined cluster ( Supplementary Data Figures A5 and A9) also within the lower Unit 1 of von Gosen et al. (2019) and Member 2 of Riediger and Bustin (Citation1987) (Supplementary Data Figure A1). Angiosperm pollen diversity (H′) remains near ∼1.6. NMDS ordinance of this pollen zone could not provide a confidence ellipse for this pollen zone due to insufficient data, but samples do not appear to be closely related, also indicating greater compositional variation between samples (). Several FOs occur in this zone, including pollen of Alnipollenites sp., Liquidambarpollenites sp., Tricolpites sagax, and T. ringens (). The most common angiosperm pollen taxa are Caryapollenites imparalis and Triporopollenites mullensis. Average relative abundances of C. hiatipites pollen in this pollen zone decrease to ∼67%.
3.5. Pollen zone C
This zone, at the base of S1, is found at the top of Unit 1 and at the base of Unit 2 of von Gosen et al. (2019) ( Supplementary Data Figures A6 and A10). Riediger and Bustin (Citation1987) place this part of the section into the very top of their Member 2 (Supplementary Data ). Samples occur in a well-defined cluster and angiosperm diversity (H′) is higher than in S5 (∼2). NMDS ordinance of this pollen zone provides the most closely constrained cluster, indicating lowest compositional variation between samples relative to all other pollen zones (). First occurrences of pollen taxa include Aquilapollenites tumanganicus, Caprifoliites cf. C. paleocenicus, Castaneapollenites sp., Tilia vescipites, and Tricolpites anguloluminosus (). Retitricolpites crassus and Pistillipollenites mcgregorii pollen occur in higher abundances than in S5. Very low counts of Platycaryapollenites swasticoidus are observed in this zone; this palynomorph is not seen in older sediments, except near the top of S5. The zone C interval shows reduced relative abundances of C. hiatipites pollen (∼73%) compared to zones A and B. All FO pollen taxa in this zone persist throughout Units 2 and 3.
3.6. Pollen zone D
Zone D occurs below the middle part of S1 and in the lower Unit 2 of von Gosen et al. (2019) and Member 4 of Riediger and Bustin (Citation1987) ( Supplementary Data Figures A2, A6, and A10). The samples however do not occur in a well-defined cluster, compared to previous zones. Additionally, NMDS ordinance of this pollen zone provides a poorly constrained cluster, indicating greater compositional variation between samples (). The angiosperm diversity (H′) is lower (∼1.6) than underlying zone C. Zone D contains lower average relative abundances of C. hiatipites pollen (∼57%) and notably higher quantities of Liliacidites complexus, Sparganiaceaepollenites reticulus, and Ulmipollenites tricostatus pollen, relative to bounding strata.
3.7. Pollen zone E
Zone E is also found in the lower Unit 2 of von Gosen et al. (2019) and Member 4 of Riediger and Bustin (Citation1987) ( Supplementary Data Figures A2, A6, and A10). This zone is characterized by a better-defined cluster and angiosperm diversity (H′) is higher (∼1.9) than in the previous zone. NMDS ordinance of this pollen zone provides a well-constrained cluster, indicating lower compositional variation between samples (). Average relative abundances of C. hiatipites pollen are higher than in the bounding strata (∼79%). Castaneapollenites sp. and Tricolporites sp. 2 pollen are more abundant in this zone.
3.8. Pollen zone F
Zone F is also found in the middle part of S1, in the lower Unit 2 of von Gosen et al. (2019), and Member 4 of Riediger and Bustin (Citation1987) ( Supplementary Data Figures A2, A6, and A10). Samples occur in a better-defined cluster than preceding zones, but angiosperm diversity (H′) remains stable near ∼1.9. NMDS ordinance of this pollen zone provides a well-constrained cluster similar to pollen zone E, also indicating lower compositional variation between samples (). Higher abundances of Tricolpites cf. C. parvistriatus and Ulmipollenites tricostatus pollen occur along with a slightly lower average relative abundance of C. hiatipites pollen (∼72%) in this pollen zone. An important FO is pollen of Tilia crassipites ().
3.9. Pollen zone G
Zone G occurs immediately below the unconformity between Unit 2 and Unit 3 in S1 and above the unconformity near the bases of S2 and S3 (von Gosen et al. 2019). In the scheme of Riediger and Bustin (Citation1987), this zone still belongs to Member 4 ( Supplementary Data Figures A2–A4, A6–A8, and A10–A12). Deposited within this zone are the volcanic ash layers, which were described by von Gosen et al. (2019). One of these ash layers (MA-1 at S1 and S3) was dated to 53.7 ± 0.06 Ma (ID-TIMS U-Pb of zircon). The ash layers act as correlation points for zone G in S1, S2, and S3 as the layers are readily visible in outcrop. Cluster analysis results in a less well-defined cluster for S1 but much better-defined clusters in S2 and S3 (). Angiosperm diversity (H′) is higher than in strata below (∼2.1) but remains lower in S2 and S3 (∼1.9 for both). NMDS ordinance of this pollen zone provides a poorly constrained cluster, indicating higher compositional variation between samples (). Two of the three samples of this pollen zone originate from mudstones, but this lithofacies variation is unlikely to affect the floral spectra. Pollen of Aquilapollenites tumanganicus, Ericipites sp., Tricolpites sagax, Ulmipollenites tricostatus are the most abundant angiosperm taxa in S1. In S2 and S3, Pistillipollenites mcgregorii and Sparganiaceaepollenites reticulus are the most abundant pollen taxa, as well as Ulmipollenites tricostatus in S2. First occurrences include the pollen taxa Alnipollenites trina, Intratriporopollenites cf. I. instructus, and Ulmoideipites hebridicus (). Many angiosperm pollen taxa from zone A reappear, including Aesculiidites sp., Caprifoliites cf. C. paleocenicus, and Retitricolpites crassus. There is a decrease in the average relative abundance in this pollen zone of C. hiatipites pollen in S1 (∼51%) and S2 (∼34%) but not in S3 (∼77%).
3.10. Pollen zone H
Zone H occurs immediately above the unconformity between Unit 2 and Unit 3 of von Gosen et al. (2019) in S1 but occurs higher in S2 and S3, ranging to the top of S2 . This zone also occurs in Member 4 (Riediger and Bustin Citation1987) ( Supplementary Data Figures A2–A4, A6–A8, and A10–A12). In S1, S2, and S3, this zone occurs in a well-defined cluster and angiosperm diversity (H′) remains higher (∼2.3, ∼2.1, and ∼2.0, respectively). NMDS ordinance of this pollen zone provides a very well-constrained cluster, indicating low compositional variation between samples (). Average relative abundances of C. hiatipites pollen increase to ∼79% in S1, ∼72% in S2, and ∼84% in S3. Abundances of Liliacidites complexus and Cycadopites sp. pollen increase, and Pistillipollenites mcgregorii pollen abundances are higher, except for S1. Pollen of Hemicorpus sp., which previously only occurred in zone C, reoccurs here. Diervilla sp. pollen only occurs in this zone ().
3.11. Pollen zone I
Zone I is observed only in S2 and S3, where it occurs between zones G and H in the lower parts of the section ( Supplementary Data Figures A2–A4, A6–A8, and A10–A12). Zone I occurs in well-defined clusters in S2 and S3 and angiosperm diversity (H′) remains higher (2.1 and 1.9, respectively), though is lower than in the surrounding zones. NMDS ordinance of this pollen zone provides a poorly constrained cluster, indicating higher compositional variation between samples (). Average relative abundances of C. hiatipites (∼52% in S2, and ∼82% in S3) increase relative to pollen zone G but are slightly lower than zone H. Pollen of Aquilapollenites tumanganicus, Pistillipollenites mcgregorii, and Sparganiaceaepollenites reticulus, are most abundant.
3.12. Pteridophyte spores and gymnosperm pollen
The most common pteridophyte spore taxa (Plate 2) include Baculatisporites primarius, Laevigatosporites haardti, Laevigatosporites pseudodiscordatus, and Ovoidites elongatus. Similar to pteridophyte spores, the gymnosperm pollen taxa are mostly long-ranging. The most common gymnosperm pollen taxa include Cathayapollenites sp., Cycadopites scabratus, Pinuspollenites sp., and Cupressacites hiatipites ().
4. Discussion
The new pollen zonation presented here provides a robust biostratigraphy whereby parts of the lithology of Stenkul Fiord may be calibrated to the absolute time scale from the dated volcanic ash layer MA-1 (; von Gosen et al. 2019). The palynoflora at Stenkul Fiord shows compositional changes through time with unique floral signatures that are constrained to a few metres of stratigraphy. CONISS cluster analysis recognized a total of nine pollen zones that are used to create the biostratigraphic framework and to correlate three separate sections to each other ().
The volcanic ash layer MA-1, dated at ∼53.7 ± 0.06 Ma (von Gosen et al. 2019), found in S1 and S3 allows those sections to be confidently correlated to one another (). Volcanic ash layer MA-3, found in S2, is reported to be of a similar age as MA-1, near 53.7 Ma, but was likely deposited soon after MA-1 (von Gosen et al. 2019). For this part of the section in S2 and S3, CONISS cluster analysis produced a pollen zone (G; ) that is similar in floral composition between the two sections and plots as a well-constrained cluster in NMDS analysis (). This indicates a higher degree of relatedness between the sampled layers of all sections within pollen zone G, and effectively volcanic ash layers MA-1 and MA-3, allowing S2 to tentatively be correlated with S1 and S3 until the age of the ash layer is confirmed. S5, however, does not contain a volcanic ash layer, its floral composition does not correlate to the other sections, and some key thermophilic pollen taxa are not observed (). This supports previous assumptions that the east side of Stenkul Fiord is of late Paleocene age (Riediger and Bustin Citation1987; West et al. Citation2015; von Gosen et al. 2019).
Palynofloral compositions vary laterally at Stenkul Fiord and not all taxa found in one section were observed in other sections (). However, some indicator taxa remain present across sections, and compositions are sufficiently consistent so that pollen zones can be traced laterally ( and ). Pollen zones G and H can be traced for more than a kilometre in three separate sections (S1, S2, and S3). In the middle Eocene Buchanan Lake flora on Axel Heiberg Island, two macrofloras at the same stratigraphic level but separated laterally by more than a kilometre, showed almost identical compositions (McIver and Basinger Citation1999). The palynofacies of the Margaret Formation at Stenkul Fiord can therefore likely be applied to other Arctic localities as well.
This study sampled mostly coals, with a few exceptions (n = 7 out of 96 samples), thus limiting potential influence of lithofacies variation on the palynoflora. In the preparations from the 7 mudstone samples, the absence of dinoflagellate cysts and marine algae combined with the presence of leaf mats in several of the mudstone units at Stenkul Fiord (West et al. Citation2019, Citation2020) indicate that the mudstone samples were not deposited in offshore environments; instead these rocks are interpreted as being deposited in quiescent fluvio-lacustrine and overbank deposits within a delta-plain (West et al. Citation2019, Citation2020). Some sorting from riverine input in the delta-plain environment could have occurred, but would affect mostly delta-front deposits, rather than the quiescent settings where sediments accumulate in overbank and other similar fluvio-lacustrine environments. In the instance of riverine sorting, relatively heavy spores can be preferentially deposited near the river mouth, while other forms (e.g. bisaccates) are transported further offshore due to their buoyancy in water, as well as aerial transport. However, marine sediments remain useful for reconstruction of terrestrial vegetation, and are broadly representative of onshore source areas (McCarthy and Mudie Citation1998 and references therein). In the Stenkul Fiord material, bisaccate pollen is minimal (∼2%) and instead Cupressaceae-Taxaceae pollen represents the majority of the spectra in the Stenkul Fiord material (∼72%). Cupressaceae-Taxaceae pollen is generally proportionally representative of terrestrial density of parent plants, even in marine settings (Mudie and McCarthy Citation2006).
A few thermophilic pollen taxa are present in the Margaret Formation pollen assemblage and indicate the possible presence of the PETM at the base of Unit 1 within pollen zone C at Stenkul Fiord. As in the earliest Eocene sediments of the Beaufort-Mackenzie Basin (McNeil and Parsons Citation2013), Platycaryapollenites and Tilia first occur in this assemblage near the top of S5 and in pollen zone C (), respectively. On the Lomonosov Ridge Platycaryapollenites were also first seen during the PETM (Willard et al. Citation2019). Additionally, at Stenkul Fiord, two taxa of Cycadopites sp. occur in the uppermost S5 and another taxon of Cycadopites appears in the lowermost S1 (). Beginning in pollen zone C, angiosperm pollen taxa diversity is slightly higher relative to the previous pollen zones A and B (). Previous studies have documented increases in angiosperm diversity during early Eocene hyperthermals, for example, in the mid-latitude Bighorn Basin (Wing et al. Citation2005; Wing and Currano Citation2013). Similar diversity increases also occurred at high northern latitudes (Suan et al. Citation2017; Salpin et al. 2019; Willard et al. Citation2019). The flora at Stenkul Fiord may have responded to the warming of the early Eocene hyperthermals in a similar manner. NMDS ordination shows a well-constrained cluster of samples for zone C, indicating a uniform thermophilic floral composition during this time (). It is therefore possible that this part of the Margaret Formation within pollen zone C at Stenkul Fiord may capture the PETM hyperthermal, or parts of it.
Similar to pollen zone C, zones E and F exhibit slightly higher diversity () and a more uniform floral composition compared to zone D (). The thermophilic taxa in pollen zones E and F, which were first seen in zone C, continue to be present here (). Their stratigraphic and temporal proximity to the younger volcanic ash layer MA-1 () suggest that the ETM2 hyperthermal may also be captured at Stenkul Fiord in sediments within or near pollen zones E and F. As indicated by the age of the volcanic ash layer MA-1 of ∼53.7 Ma, the top of pollen zone G, preserved in the uppermost Unit 2 of S1 and at the base of Unit 3 in S2 and S3, may include the smaller I1 hyperthermal that occurred near 53.665 Ma (Westerhold et al. Citation2017). Palynofloral diversity in pollen zone G is similar to zones E and F and a few FOs are seen here ( and ). NMDS ordination, however, provides a loose cluster of samples for zone G, indicating that even though the hyperthermal event I1 occurred during the deposition of pollen zone G, it may not be captured at Stenkul Fiord or only constitute a small part of zone G near MA-1 ().
Relative abundances of Cupressacites hiatipites pollen slightly increase in and just below pollen zone C and within pollen zone E near the possible PETM and early ETM2 hyperthermals, relative to the already high abundances in the bounding pollen zones (Supplementary Data Figures A9 and A10). High relative abundances of C. hiatipites throughout Margaret Formation strata were also previously reported at Stenkul Fiord by McIntyre (Citation1994). The increase in relative abundance of this pollen type is an important factor in this study that helps to define pollen zones between sections. On the Lomonosov Ridge, relative abundances of this taxon were observed to increase during the body and recovery of the PETM (Willard et al. Citation2019). On the New Siberian Islands, Cupressaceae pollen are reported to have dominated during the onset and body of the PETM (Suan et al. Citation2017). On the Lomonosov Ridge, Cupressaceae pollen dominated again during the ETM2 (Willard et al. Citation2019). This indicates a strong presence of coal-forming swamps at Stenkul Fiord that were dominated by taxodiaceous Cupressaceae (cf. Eberle and Greenwood Citation2012; Suan et al Citation2017; Willard et al. Citation2019).
5. Conclusions
The sequence of structural Eurekan deformation manifested at Stenkul Fiord and starting in the middle of Unit 2 until the end of Unit 3 of von Gosen et al. (2019), may soon be interpreted in future studies that can employ the palynostratigraphy presented herein and a dated volcanic ash horizon. This is the first study in the Canadian Arctic that employs insights of thermophilic hyperthermal-indicative pollen flora assemblages to establish a biostratigraphic framework of the late Paleocene-early Eocene interval. The biostratigraphic framework defines nine informal pollen assemblage zones which are confidently correlated between sections mainly through the volcanic ash layers MA-1 and MA-3, CONISS cluster analysis (), NMDS analysis (), stratigraphic occurrences of angiosperm pollen taxa (), and finally angiosperm diversity, and evenness (). Lateral continuity of pollen zones at Stenkul Fiord indicates that this palynostratigraphic framework, in association with other studies of early Eocene Arctic floras, may be applied throughout contemporaneous sites within the Arctic. Arctic environments show similar floral compositions at the same stratigraphic levels (e.g. McIver and Basinger Citation1999) and similar indicator taxa, such as Tilia and Platycaryapollenites, even across large distances. This study is in agreement with previous studies of the Arctic that show vegetational responses to early Eocene hyperthermals (e.g. Sluijs et al. Citation2009; McNeil and Parsons Citation2013; Suan et al. Citation2017; Salpin et al. 2019; Willard et al. Citation2019; Suc et al. Citation2020).
Future studies may rely on this framework, integrated with the new structural geological perspectives by von Gosen et al. (2019) and a carbon isotope chemostratigraphy, to interpret the interplay between sedimentation and Eurekan deformation and to determine the tectonic evolution in this part of the Canadian Arctic Archipelago. The results of this study suggest that strata at Stenkul Fiord contain evidence of early Eocene hyperthermals, such as the PETM, ETM2, and possibly even the smaller I1. Based on the geochronology (U-Pb TIMS) of the ash bed preserved in the Stenkul Fiord succession, it is certain that the succession was deposited contemporaneous with a time of known hyperthermal events, broadly speaking. But since the effects of hyperthermals on the vegetation record in high latitude North America are not yet clear, this study may in the future be part of the first attempt to evaluate a terrestrial signature from an Arctic terrestrial archive. This high-latitude record is ideally positioned to do so: in high northern latitudes where many taxa are likely living near their ecological optima and tolerance limits, climatic changes are expected to elicit an ecological response. However, this palynological record does not document profound vegetation change. Future studies with greater sampling resolution in different locations at Stenkul Fiord coupled with the results of additional climatic and ecological analyses may be able to address this question. Our stratigraphy offers the first high northern latitude terrestrial record. As such, should the PETM and ETM2 hyperthermals in fact be captured at Stenkul Fiord, the biostratrigraphic framework of this study will provide an excellent point of orientation for future efforts.
Supplemental Material
Download PDF (618 KB)Supplemental Material
Download PDF (652.9 KB)Supplemental Material
Download PDF (688.3 KB)Supplemental Material
Download PDF (750.9 KB)Supplemental Material
Download PDF (602.2 KB)Supplemental Material
Download PDF (578.3 KB)Supplemental Material
Download PDF (969.2 KB)Supplemental Material
Download PDF (763.4 KB)Supplemental Material
Download JPEG Image (487.2 KB)
Supplemental Material
Download JPEG Image (322.2 KB)
Supplemental Material
Download JPEG Image (907.4 KB)
Supplemental Material
Download JPEG Image (435.4 KB)
Supplemental Material
Download MS Word (55.3 KB)Acknowledgements
This research forms part of a Master of Science thesis by Markus Sudermann. We thank fellow CASE-19 Arctic expeditioners for their assistance during the 2017 summer field season on Ellesmere Island, including Florian Schroll from Munich, Bavaria, Germany, and Tom Kiguktak from Grise Fiord, NU, Canada. The material collected for this study occurred under Paleontological Permit Number 2017-03 P Class 2 issued by the Government of Nunavut to Jennifer M. Galloway. Thanks to Russ Harms at Global Geolab Limited, Alberta, Canada for the preparation of palynology slides. We are thankful to the Palaeontology and Collections Section at the GSC in Calgary for support for sample management and sample co-ordination. We also thank Guy Harrington and two anonymous reviewers for their constructive criticisms, and helpful comments from James Riding, that contributed to a greatly improved article.
Disclosure statement
No potential conflict of interest was reported by the authors.
Data availability statement
The data that support the findings of this study are openly available in Mendeley Data at http://dx.doi.org/10.17632/zsh9d3zmpt.2.
Additional information
Funding
Notes on contributors

Markus Sudermann
MARKUS SUDERMANN completed this work while a graduate student at Brandon University, in Canada. He has a MSc (Environmental and Life Sciences) and a BSc (Hons) Geology from Brandon University. For his MSc he studied the palynology of early Eocene terrestrial sediments from southern Ellesmere Island in the Canadian Arctic, with the summer 2017 field season spent at Stenkul Fiord, Ellesmere Island. His work focused on palynostratigraphy and changes to high latitude palynofloras in response to rapid climate change caused by hyperthermals such as the Paleocene-Eocene Thermal Maximum and the Eocene Thermal Maximum 2.

Jennifer M. Galloway
JENNIFER M. GALLOWAY is a Research Scientist with the Geological Survey of Canada and at the time of writing this paper was an associate professor at the Aarhus Institute of Advanced Studies at Aarhus University, Denmark. Her work uses palynology, often integrated with geochemistry and other geological methods, to better understand the role of climate change on terrestrial, lacustrine, and marine ecosystems on various time scales.
David R. Greenwood
DAVID R. GREENWOOD is a professor in the Department of Biology at Brandon University in Canada. His PhD is from the University of Adelaide, and he held prior academic positions in Fiji and at Victoria University in Melbourne (Australia) prior to moving to Canada in 2004. His research uses field census-collected macroflora and multiproxy approaches to analyse plant fossil assemblages, principally leaf fossils but also fossil pollen and spores, to reconstruct mid-Cretaceous to Neogene terrestrial vegetation and climates of Australia and Canada, with a focus on intervals of global climate warmth such as the Eocene.
Christopher K. West
CHRISTOPHER K. WEST is a postdoctoral fellow in the Department of Earth and Atmospheric Sciences at the University of Alberta. He completed in 2019 a PhD in paleobotany and geology at the University of Saskatchewan supervised by David Greenwood and James F. Basinger. His doctoral research focused on reconstructing late Paleocene and early Eocene paleoclimate and paleoenvironments, and taxonomic analysis of these macrofloras from Ellesmere Island, Nunavut, Canada. His research is broadly focused on reconstructing ancient climates and ecosystems using plant fossils to understand the larger scale interactions between forest ecosystems and the biotic and abiotic factors that shape them. Christopher West is also interested in investigating the deep time evolutionary and paleobiogeographic pathways that have led to the development of our modern forest ecosystems.
Lutz Reinhardt
LUTZ REINHARDT is a sedimentologist at the Bundesanstalt für Geowissenschaften and Rohstoffe / Federal Institute for Geosciences and Natural Resources (BGR) in Hannover, Germany. His work within BGR's Circum-Arctic Structural Events (CASE) research program uses geochemistry and geochronological approaches to enhance understanding of stratigraphy in Paleogene and Cretaceous deposits. Lutz Reinhardt has a PhD in sedimentology from the University of Cologne.
Related Research Data
References
- Balkwill HR. 1978. Evolution of the Sverdrup Basin. Arctic Canada. American Association of Petroleum Geologists Bulletin. 62:1004–1028.
- Denis EH, Pedentchouk N, Schouten S, Pagani M, Freeman KH. 2017. Fire and ecosystem change in the Arctic across the Paleocene–Eocene Thermal Maximum. Earth and Planetary Science Letters. 467:149–156.
- Dixon J. 1996. Geological atlas of the Beaufort-Mackenzie area. Ottawa (ON): Geological Survey of Canada, Miscellaneous Report 59.
- Eberle JJ, Eberth DA. 2015. Additions to the Eocene Perissodactyla of the Margaret Formation, Eureka Sound Group, Ellesmere Island, Arctic Canada. Canadian Journal of Earth Sciences. 52(2):123–133.
- Eberle JJ, Greenwood DR. 2012. Life at the top of the greenhouse Eocene world – a review of the Eocene flora and vertebrate fauna from Canada’s High Arctic. Geological Society of America Bulletin. 124(1-2):3–23.
- Ediger VS. 1986. Sieving techniques in palynological sample processing with special reference to the MRA System. Micropaleontology. 32(3):256–270.
- Eldrett JS, Greenwood DR, Polling M, Brinkhuis H, Sluijs A. 2014. A seasonality trigger for carbon injection at the Paleocene-Eocene Thermal Maximum. Climate of the Past. 10(2):759–769.
- Faegri K, Iversen J. 1964. Textbook of pollen analysis. Copenhagen (Denmark): Munksgaard.
- Fox J, and Weisberg S. 2011. Multivariate linear models in R. An R companion to applied regression. Los Angeles (CA): Thousand Oaks.
- Frederiksen NO, Edwards LE, Fouch TD, Carter LD, Collett TS. 1994. Palynomorph biostratigraphy of Eocene samples from the Sagavanirktok Formation at Franklin Bluffs, North Slope of Alaska. U.S. Geological Survey Open-File Report, 94–653, p. 32.
- Gion AM, Williams SE, Müller RD. 2017. A reconstruction of the Eurekan Orogeny incorporating deformation constraints. Tectonics. 36(2):304–320.
- von Gosen W, Piepjohn K, Reinhardt L. 2012. Polyphase Eurekan deformation along the Vendom Fiord Fault Zone on south Ellesmere Island (Canadian Arctic) and its possible relation to the Wegener Fault. Zeitschrift Der Deutschen Gesellschaft Für Geowissenschaften. 163(3):261–282.
- von Gosen W, Reinhardt L, Piepjohn K, Schmitz MD. 2019. Paleogene sedimentation and Eurekan deformation in the Stenkul Fiord area of southeastern Ellesmere Island (Canadian Arctic): Evidence for a polyphase history. In: Piepjohn K, Strauss JV, Reinhardt L, McClelland WC, editors. Circum-Arctic structural events: tectonic evolution of the Arctic margins and trans-Arctic links with adjacent orogens. Geological Society of America Special Paper 541. Boulder (CO): Geological Society of America. p. 1–24.
- Greenwood DR, Basinger JF. 1994. The Paleoecology of high-latitude Eocene swamp forests from Axel-Heiberg Island. Review of Palaeobotany and Palynology. 81(1):83–97.
- Greenwood DR, Basinger JF, Smith RY. 2010. How wet was the Arctic Eocene rain forest? Estimates of precipitation from Paleogene Arctic macrofloras. Geology. 38(1):15–18.
- Grimm E. 1987. Constrained cluster analysis by the method of incremental sum of squares. Computers & Geosciences. 13(1):13–35.
- Grimm E. 1993. TILIA: a pollen program for analysis and display. Springfield: Illinois State Museum.
- Harrington GJ, Clechenko ER, Kelly DC. 2005. Palynology and organic-carbon isotope ratios across a terrestrial Palaeocene/Eocene boundary section in the Williston Basin, North Dakota, USA. Palaeogeography, Palaeoclimatology, Palaeoecology. 226(3-4):214–232.
- Harrington GJ, Eberle J, Le-Page BA, Dawson M, Hutchison JH. 2012. Arctic plant diversity in the Early Eocene greenhouse. Proceedings of the Royal Society B: Biological Sciences. 279(1733):1515–1521.
- Harrison JC, Mayr U, McNeil DH, Sweet AR, McIntyre DJ, Eberle JJ, Harington CR, Chalmers JA, Dam G, Nøhr-Hansen H. 1999. Correlation of Cenozoic sequences of the Canadian Arctic region and Greenland; implications for the tectonic history of northern North America. Bulletin of Canadian Petroleum Geology. 47:223–254.
- Hills LV, Ogilvie RT. 1970. Picea banksii n. sp. Beaufort Formation (Tertiary), northwestern Banks Island, Arctic Canada. Canadian Journal of Botany. 48(3):457–464.
- Jones MT, Percival LME, Stokke EW, Frieling J, Mather TA, Riber L, Schubert BA, Schultz B, Tegner C, Planke S, et al. 2019. Mercury anomalies across the Palaeocene–Eocene Thermal Maximum. Climate of the Past. 15(1):217–236.
- Kalgutkar RM, McIntyre DJ. 1991. Helicosporous fungi and Early Eocene pollen, Eureka Sound Group, Axel Heiberg Island, Northwest territories. Canadian Journal of Earth Sciences. 28(3):364–371.
- Kalkreuth WD, Keuser C, Fowler M, Li M, McIntyre DJ, Puttman W, Richardson R. 1998. The petrology, organic geochemistry and palynology of Tertiary age Eurekan Sound Group coals. Organic Geochemistry. 29(1-3):799–809.
- Kalkreuth WD, Riediger CL, McIntyre DJ, Richardson RJH, Fowler MG, Marchioni D. 1996. Petrological, palynological and geochemical characteristics of Eureka Sound Group coals (Stenkul Fiord, southern Ellesmere Island, Arctic Canada). International Journal of Coal Geology. 30(1-2):151–182.
- Kennett JP, Stott LD. 1991. Abrupt deep-sea warming, palaeoceanographic changes and benthic extinctions at the end of the Palaeocene. Nature. 353(6341):225–229.
- Koch PL, Zachos JC, Gingerich PD. 1992. Correlation between isotope records in marine and continental carbon reservoirs near the Palaeocene/Eocene boundary. Nature. 358(6384):319–322.
- Lauretano V, Littler K, Polling M, Zachos JC, Lourens LJ. 2015. Frequency, magnitude and character of hyperthermal events at the onset of the Early Eocene climatic optimum. Climate of the Past. 11(10):1313–1324.
- Lourens LJ, Sluijs A, Kroon D, Zachos JC, Thomas E, Röhl U, Bowles J, Raffi I. 2005. Astronomical pacing of late Palaeocene to early Eocene global warming events. Nature. 435(7045):1083–1087.
- McCarthy FMG, Mudie PJ. 1998. Oceanic pollen transport and pollen: dinocyst ratios as markers of late Cenozoic sea level change and sediment transport. Palaeogeography, Palaeoclimatology, Palaeoecology. 138(1-4):187–206.
- McInerney FA, Wing SL. 2011. The Paleocene-Eocene Thermal Maximum: a perturbation of carbon cycle, climate, and biosphere with implications for the future. Annual Review of Earth and Planetary Sciences. 39(1):489–516.
- McIntyre DJ. 1994. Palynology of twenty six samples from Eureka Sound Group Coal Measures, Stenkul Fiord, Ellesmere Island (NTS 49 D/5). Paleontological Report 14. DJM-1994. Calgary (Canada): Geological Survey of Canada.
- McIver EE, Basinger JF. 1999. Early Tertiary floral evolution in the Canadian High Arctic. Annals of the Missouri Botanical Garden. 86(2):523–545.
- McNeil DH, Parsons MG. 2013. The Paleocene-Eocene Thermal Maximum in the Arctic Beaufort–Mackenzie Basin — palynomorphs, carbon isotopes and benthic foraminiferal turnover. Bulletin of Canadian Petroleum Geology. 61(2):157–186.
- Miall AD. 1984. Variations in fluvial style in the lower Cenozoic synorogenic sediments of the Canadian Arctic Islands. Sedimentary Geology. 38(1-4):499–523.
- Miall AD. 1986. The Eureka Sound Group (Upper Cretaceous-Oligocene). Canadian Arctic Islands. Bulletin of Canadian Petroleum Geology. 34:240–270.
- Minchin PR. 1987. An evaluation of the relative robustness of techniques for ecological ordination. Vegetatio. 69:89–107.
- Mudie PJ, McCarthy FMG. 1994. Late Quaternary pollen transport processes, western North Atlantic: data from box models, cross-margin and N-S transects. Marine Geology. 118(1-2):79–105.
- Mudie PJ, McCarthy FMG. 2006. Marine palynology: potentials for onshore offshore correlations of Pleistocene Holocene records. Transactions of the Royal Society of South Africa. 61(2):139–157.
- Nichols DJ, Ott HL. 1978. Biostratigraphy and evolution of the Momipites-Caryapollenites Lineage in the Early Tertiary in the Wind River Basin. Palynology. 2(1):93–112.
- Oksanen J, Kindt R, Legendre P, O’Hara B, Simpson GL, Solymos P, Stevens MHH, Wagner H. 2007. The vegan package. Community Ecology Package. 10:631–637.
- Okulitch AV, Trettin HP. 1991. Late Cretaceous to Early Tertiary deformation, Arctic Islands. In: Trettin HP, editor. Geology of the Innuitian Orogen and Arctic platform of Canada and Greenland. Geological Survey of Canada. Vol. 3; p. 469–489.
- Pagani M, Pedentchouk N, Huber M, Sluijs A, Schouten S, Brinkhuis H, Damsté JSS, Dickens GR, Backman J, Clemens S, et al. 2006. Arctic hydrology during global warming at the Palaeocene/Eocene Thermal Maximum. Nature. 442(7103):671–675.
- Pearson DL. 1984. Pollen/spore color “Standard.” Phillips Petroleum Company exploration projects section; p. 1-2.
- Piepjohn K, von Gosen W, Tessensohn F. 2016. The Eurekan deformation in the Arctic: an outline. Journal of the Geological Society. 173(6):1007–1024.
- Punt W, Hoen PP, Blackmore S, Nilsson S, Le Thomas A. 2007. Glossary of pollen and spore terminology. Review of Palaeobotany and Palynology. 143(1-2):1–81.
- R Development Core Team. 2018. R: A language and environment for statistical computing. Vienna (Austria): R Foundation for Statistical Computing. [accessed 2019 Aug 12]. https://www.R-project.org/.
- Reinhardt L, Estrada S, Andruleit H, Dohrmann R, Piepjohn K, von Gosen W, Davis DW, Davis B. 2013. Altered volcanic ashes in Palaeocene and Eocene sediments of the Eureka Sound Group (Ellesmere Island, Nunavut, Arctic Canada) [Alterierte vulkanische Aschenlagen in paläozänen und eozänen Sedimenten der Eureka-Sound-Gruppe (Ellesmere- Insel, Nunavut, Kanada]. Zeitschrift der Deutschen Gesellschaft für Geowissenschaften, 164: 131–147.
- Reinhardt L, von Gosen W, Piepjohn K, Lückge A, Schmitz MD. 2017. The Eocene Thermal Maximum 2 (ETM-2) in a terrestrial section of the High Arctic: identification by U-Pb zircon ages of volcanic ashes and carbon isotope records of coal and amber (Stenkul Fiord, Ellesmere Island, Canada). Geophysical Research Abstracts EGU General Assembly. 19:2017–8145.
- Reinhardt L, Lückge A, Galloway JM, Sudermann M, West CK, Dolezych M, Schmitz MD, von Gosen W. 2019. Early Eocene hyperthermals recorded in terrestrial sediments of the Canadian Arctic (Stenkul Fiord, Ellesmere Island, Nunavut: evidence from new carbon isotope data. In European Geosciences Union General Assembly, Vienna, Austria, session SSP2.2/CL1.36, 2019–10018.
- Ricketts BD. 1986. New Formations in the Eureka Sound Group, Canadian Arctic Islands. In: Current Research Part B / Recherches En Cours Partie B. Geological Survey of Canada, Paper no. 86-1B; p. 363–374.
- Riediger CL, Bustin RM. 1987. The Eureka Sound Formation, Southern Ellesmere Island. Bulletin of Canadian Petroleum Geology. 35:123–142.
- RStudio Team. 2016. RStudio: integrated development for R. Boston, MA: RStudio Inc.
- Salpin M, Schnyder J, Baudin F, Suan G, Suc JP, Popescu S-M, Fauquette S, Reinhardt L, Schmitz MD, Labrousse L. 2019. Evidence for subtropical warmth in the Canadian Arctic (Beaufort-Mackenzie, Northwest Territories, Canada) during the early Eocene. In: Piepjohn K, Strauss JV, Reinhardt L, McClelland WC, editors. Circum-Arctic structural events: tectonic evolution of the Arctic Margins and trans-Arctic links with adjacent orogens. Geological Society of America Special Paper 541. Boulder (CO): Geological Society of America; p. 1–28.
- Schoon PL, Sluijs A, Sinninghe Damsté JS, Schouten S. 2011. Stable carbon isotope patterns of marine biomarker lipids in the Arctic Ocean during Eocene Thermal Maximum 2. Paleoceanography. 26, PA3215. doi:10.1029/2010PA002028
- Sluijs A, Schouten S, Donders TH, Schoon PL, Röhl U, Reichart G-J, Sangiorgi F, Kim J-H, Sinninghe Damsté JS, Brinkhuis H. 2009. Warm and wet conditions in the Arctic region during Eocene Thermal Maximum 2. Nature Geoscience. 2(11):777–780.
- Sluijs A, Schouten S, Pagani M, Woltering M, Brinkhuis H, Damsté JSS, Dickens GR, Huber M, Reichart GJ, Stein R, et al. 2006. Subtropical Arctic Ocean temperatures during the Palaeocene/Eocene thermal maximum. Nature. 441(7093):610–613.
- Suan G, Popescu SM, Suc JP, Schnyder J, Fauquette S, Baudin F, Yoon D, Piepjohn K, Sobolev NN, Labrousse L. 2017. Subtropical climate conditions and mangrove growth in Arctic Siberia during the early Eocene. Geology. 45(6):539–542.
- Suc JP, Fauquette S, Popescu SM, Robin C. 2020. Subtropical mangrove and evergreen forest reveal Paleogene terrestrial climate and physiography at the North Pole. Palaeogeography, Palaeoclimatology, Palaeoecology. 551:109755.
- Sweet AR, Ricketts BD, Cameron AR, Norris DK. 1989. An integrated analysis of the Brackett Coal Basin, Northwest Territories. Current Research Part G, Frontier Geoscience Program, Arctic Canada/Recherches En Cours Partie G, Programme Géoscientifiques des Régions Pionnières, Région Arctique Du Canada; by Geological Survey of Canada; Geological Survey of Canada, Paper no. 89-1G; p. 85-99.
- Thorsteinsson H and, Tozer ET. 1970. Geology of the Arctic Archipelago. In: Douglas RJW, editor. Geology and economic minerals of Canada. Ottawa (ON): Geological Survey of Canada, Economic Report no. 1. p. 547–590.
- Traverse A. 2007. Paleopalynology. 2nd ed. Dordrecht: Springer.
- U.S. Geological Survey. 2006. FGDC digital cartographic standard for geologic map symbolization (PostScript implementation). Reston (VA): U.S. Geological Survey Techniques and Methods. 11-A2; p. 1-263.
- Weijers JWH, Schouten S, Sluijs A, Brinkhuis H, Sinninghe Damsté JS. 2007. Warm arctic continents during the Palaeocene-Eocene thermal maximum. Earth and Planetary Science Letters. 261(1-2):230–238.
- West CK, Greenwood DR, Basinger JF. 2015. Was the Arctic Eocene “rainforest” monsoonal? Estimates of seasonal precipitation from early Eocene megafloras from Ellesmere Island. Earth and Planetary Science Letters. 427:18–30.
- West CK, Greenwood DR, Basinger JF. 2019. The late Paleocene to early Eocene Arctic megaflora of Ellesmere and Axel Heiberg islands, Nunavut, Canada. Palaeontographica Abteilung B. 300 (1-6):47–117.
- West CK, Greenwood DR, Reichgelt T, Lowe AJ, Vachon JM, Basinger JF. 2020. Paleobotanical proxies for early Eocene climates and ecosystems in northern North America from middle to high latitudes. Climate of the Past. 16(4):1387–1410.
- Westerhold T, Röhl U, Frederichs T, Agnini C, Raffi I, Zachos JC, Wilkens RH. 2017. Astronomical calibration of the Ypresian timescale: implications for seafloor spreading rates and the chaotic behavior of the solar system? Climate of the Past. 13(9):1129–1152.
- Westerhold T, Röhl U, McCarren HK, Zachos JC. 2009. Latest on the absolute age of the Paleocene-Eocene Thermal Maximum (PETM): new insights from exact stratigraphic position of key ash layers +19 and -17. Earth and Planetary Science Letters. 287(3-4):412–419.
- Westerhold T, Röhl U, Wilkens RH, Gingerich PD, Clyde WC, Wing SL, Bowen GJ, Kraus MJ. 2018. Synchronizing early Eocene deep-sea and continental records - cyclostratigraphic age models for the Bighorn Basin Coring Project drill cores. Climate of the Past. 14(3):303–319.
- Willard DA, Donders TH, Reichgelt T, Greenwood DR, Sangiorgi F, Peterse F, Nierop KGJ, Frieling J, Schouten S, Sluijs A. 2019. Arctic vegetation, temperature, and hydrology during Early Eocene transient global warming events. Global and Planetary Change. 178:139–152.
- Wing SL, Currano ED. 2013. Plant response to a global greenhouse event 56 million years ago. American Journal of Botany. 100(7):1234–1254.
- Wing SL, Harrington GJ, Smith FA, Bloch JI, Boyer DM, Freeman KH. 2005. Transient floral change and rapid global warming at the Paleocene-Eocene boundary. Science. 310(5750):993–996.
- Woodburne MO. 2004. Late Cretaceous and Cenozoic mammals of North America: biostratigraphy and geochronology. Chichester (NY): Columbia University Press.
- Zachos J, Pagani M, Sloan LC, Thomas E, Billups K. 2001. Trends, rhythms, and aberrations in global climate 65 Ma to present. Science. 292(5517):686–693.
- Zachos JC, Dickens GR, Zeebe RE. 2008. An early Cenozoic perspective on greenhouse warming and carbon-cycle dynamics. Nature. 451(7176):279–283.
- Zachos JC, Röhl U, Schellenberg SA, Sluijs A, Hodell DA, Kelly DC, Thomas E, Nicolo M, Raffi I, Lourens LJ, et al. 2005. Rapid acidification of the ocean during the Paleocene-Eocene Thermal Maximum. Science. 308(5728):1611–1616.