
Abstract
Colour is commonly used as an initial proxy for the determination of botanical origin for pollen pellets collected by honeybees. However, individuals with Colour Vision Deficiency (colour blindness) will struggle with this determination. Here we present a simple and reproducible technique to enable inclusive participation of all individuals in the determination of pollen pellet colour. The proposed method makes use of colour determination applications on smartphones and is therefore appropriate to use in large scale citizen science projects. We also highlight the need to think inclusively when reporting and presenting colour-based research findings in melissopalynology and honeybee research.
1. Introduction
The western honey bee (Apis mellifera) uses plant pollen as an important nutritional source for amino acids, fats, minerals, proteins, starch, sterol and vitamins (Brodschneider et al. Citation2018). The nutritional quality of pollen pellets is dependent on the botanical origin of the pollen (Manning Citation2001). In certain circumstances the foraging on one abundant plant is known to have detrimental impacts on the hive, such as Zea mays (Di Pasquale et al. Citation2016). Therefore, understanding where a colony is collecting pollen from and the diversity of sources can provide insight into the nutritional health of that colony. One of the first determinations of botanical origin for pollen pellets is by using colour and this is routinely used by beekeepers to understand the foraging of their colonies (Kirk Citation1994; Conti et al. Citation2016; Brodschneider et al. Citation2021; Campos et al. Citation2021).
Colour of pollen pellets has previously been determined by eye (Kirk Citation1994; Brodschneider et al. Citation2021), by experienced expert eye (Conti et al. Citation2016) or using specialist equipment (Sipos et al. Citation2020). However, specialist equipment almost always comes with a prohibitive price tag, especially if work is being done on a tight budget or aims to include a large number of citizen scientists (Brodschneider et al. Citation2021). Using individuals’ perception (Brodschneider et al. Citation2021), printed colour palettes (Conti et al. Citation2016) or the commonly used pollen pellet colour charts assumes everyone can see colour in the same way (Kirk Citation2006). Congenital Colour Vision Deficiency (CVD; commonly referred to as colour blindness) is a surprisingly common disability, with up to 9% of males and 2% of females having some form of CVD (Barry et al. Citation2017; Burggraaff et al. Citation2021). CVD has been shown to have a significant impact on an individual’s quality of life and, more specifically to the subject of this manuscript, abilities to participate in scientific research (Barry et al. Citation2017; Burggraaff et al. Citation2021). This brief communication reports a readily accessible and relatively inexpensive method to help standardise colour determination of bee products and enables the participation of CVD individuals.
2. Methods
Pollen samples from two different hives were collected from May to October 2021 as part of a project to determine the foraging patterns of Apis mellifera in urban and rural settings around Newcastle upon Tyne, UK. One hive is in a sheltered city centre location, close to parks and residential gardens, and the second hive is located in the countryside, roughly 18 kms west of Newcastle Upon Tyne, on a former airfield that is partially reforested and surrounded by farmland. The full details and results of this project will be the subject of another paper, whilst this one focuses on disseminating a method for inclusive colour determination and reporting of these findings. Corbicular pollen samples were collected by applying a pollen trap (Abelo Universal Pollen Trap) to the entrance to the hive and leaving for 1-hour, this allowed collection of a representative mix of pollen pellets without risking colony health and anxiety of the beekeeper. The pellets were stored at 4 °C, ready for sorting and processing.
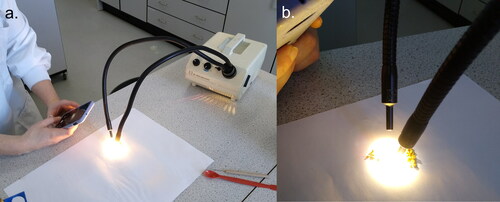
A well-lit work area was prepared by positioning two LCD fibre optic lights (LED, desk lamps etc. also work) around a sheet of matte white paper (). Four different smartphone colour detection applications, hereafter referred to as ‘apps’ were tested (Color Grab [App 1], Colour Picker [App 2], Color Name [App 3], RGB Detector [App 4]) and comparison was made between iOS and Android operating systems. The colour detection apps were then used to measure the RGB (red:green:blue) value of the work area and the lighting was adjusted until this was white (255:255:255). Ensuring the work area is registering as white in the smartphone app for each working period should facilitate comparison between multiple working periods. Samples were then placed onto the work area and sorted systematically into groups of matching colour, shape and size (Sipos et al. Citation2020; Campos et al. Citation2021). Colour is frequently the first initial sorting criteria (Campos et al. Citation2021) and could be supported by the smartphone colour detection app for individuals with CVD. The RGB value of each group (or individual pellet) from a sample was then determined and recorded. This stage of the method is open to replication to determine any variation in colour within and between grouped pellets.
Figure 1. Workspace set up (a) showing the lit area of matte white paper used as a stage (b) for measuring the RGB values of pollen pellets.
A small number of each pollen pellet group (up to three pellets) were disaggregated in boiling water, dehydrated using glacial acetic acid and then processed using acetolysis (a 9:1 ratio of acetic anhydride and sulphuric acid) for three minutes to remove all extraneous cellulose and non-sporopollenin material, leaving only the exine walls of the pollen present for identification (Lau et al. Citation2018; Riding Citation2021). Processed samples were stored in water with copper sulphate (approximately 10% concentration) to prevent fungal growth. Processed pollen was identified and counted using a Leica DM 500 microscope. Identification was supported by a variety of literature, the Northumbria University Pollen Reference Collection and the online resources: Global Pollen Project (Martin and Harvey Citation2017) and PalDat (Citation2021). A total of 500 pollen grains were counted for each sample following Lau et al. (Citation2018). A non-Metric Multidimensional Scaling (nMDS) was used to ordinate the pollen data to investigate the relationship between colour and pollen content. The pollen data was treated with a Bray-Curtis dissimilarity and ordinated in an nMDS in PRIMER6 (Clarke and Gorley Citation2006).
3. Results
The 20 pellet colours presented to illustrate this CVD appropriate technique come from 251 individual pellets representing both the main pollen type being collected by the bees on that collection date and rare pollen types foraged upon (). The colours range from dark brown (RGB: 99,84,59) to creamy-yellow (RGB: 251,221,51) showing variation between pollen types and within the same pollen type (). For example, Epilobium angustifolium ranges from dark to light brown, which is not related to the proportion of Epilobium angustifolium pollen present (; ). At a family level of identification, pellets composed primarily of Rosaceae pollen range from Brown (RGB: 197,175,87) to Yellow (RGB: 225,195,37). Colour can also be independent of the dominant pollen type present. For example, the colour yellow is reported for pollen pellets composed of a Rosaceae/Brassica sp mix, Brassica sp., Acer campestre, Chicoroideae, Vicia sp. and Hedera helix (; ). This disconnect from a one-to-one relationship between colour and dominant pollen type is highlighted by the nMDS ordination ().
Figure 2. Projected RGB colours of pellet types grouped by dominant pollen type present. For numbers of each pellet colour, date of collection, RGB values and full pollen content, please see .
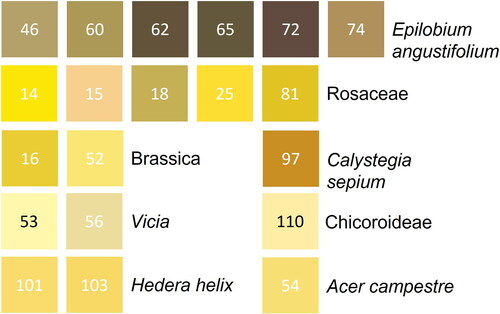
Figure 3. Projected RGB colours ordinated by pollen count data in a 2D nMDS. Numbers next to points refer to Pellet group lab codes ().
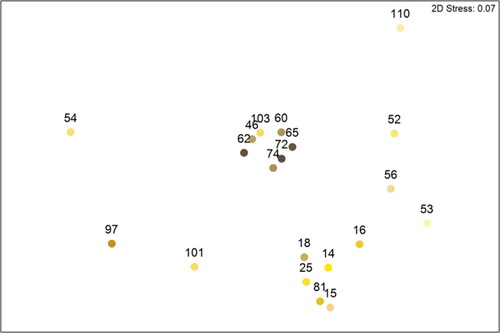
Table 1. Full details of the 20 different pollen pellet colour groups produced after sorting the 251 Apis mellifera pellets. Presentation of pollen data follows the frequency classifications of Louveaux et al. (Citation1978), with only the % value of the dominant pollen type presented.
To highlight the variation in colour identification between someone with CVD and ‘normal’ vision the pollen pellet colours were subjected to a CVD simulator (). For an individual who has Protanopia (red-blind CVD), the most obvious difference is the lack of red tones (). This is best exemplified by pollen pellet 15, for non-CVD individuals it appears as a light pink () and a noticeably different pale brown for those with CVD (). There are also noticeable differences in pollen pellets 72 (brown to grey) and 97 (brown to green), whereas some pellets appear duller (14, 46 and 53), darker (62 and 101) or similar (). It is also worth noting that there was disagreement between the non-CVD authors (the CVD author stayed out of this) of the paper over the differences in , adding further weight for the need to standardise how we collect and present colour data in honeybee research. With an aim to standardise how we collect and present colour data, comparisons across smartphone operating systems and apps shows considerable variation in shades of projected colour from detected RGB values (; Supplementary information). Whilst there is comparability between some of these (), there are examples of operating system bias () and consistent app difference (App 2). The comparability of App 4 between operating systems () shows that if an app was prescribed to citizen science participants, consistent results could be generated.
Figure 4. The same pellet colours displayed in and presented in in non-CVD (a) and Protanopia (red-blind) CVD (b). Image b. was generated with a CVD simulator (https://www.color-blindness.com/coblis-color-blindness-simulator/) and will appear identical to image a. if you have CVD.
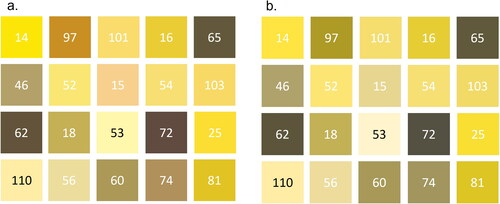
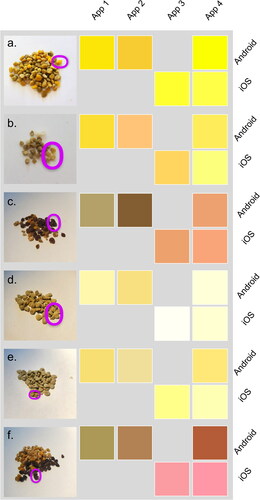
Figure 5. A comparison of RGB colour projections for six pollen pellet groups produced by Android and iOS operating systems (rows) for four apps (columns). Photos of pollen pellets collected from beehives have the measured pollen pellet circled in pink for visual comparison to smartphone detected RGB projections. Pellet group lab code 14 (a), 25 (b), 46 (c), 53 (d), 54 (e) and 60 (f). App names can be found in the methods section and pollen analysis details can be seen in .
4. Discussion and considerations
The colour of pollen pellets is routinely used as a proxy for botanical or genetic analysis to infer the origin of the pollen (e.g. Conti et al. Citation2016). However, the human eye cannot differentiate the full diversity of the colours collected and so colours are simplified into broad categories (Brodschneider Citation2018; Kirk Citation2018; Brodschneider et al. Citation2021). This has known limitations for experienced workers (Kirk Citation2006, Citation2018; van der Steen and Brodschneider Citation2014), but also presents an additional challenge for individuals with CVD. Our proposed method for colour determination provides the opportunity for a relatively inexpensive, reproducible and inclusive data collection and reporting. With an estimated six billion smartphones on Earth (Price et al. Citation2018), their use in science and to engage citizen scientists is increasingly routine, including in the use of cameras and RGB spectrums (Yang et al. Citation2018; Malthus et al. Citation2020). An awareness of how widespread CVD is and the implications for this on science communication and in citizen science data collection is also emerging (Burggraaff et al. Citation2021).
As well as providing an inclusive means for CVD individuals to engage with the colour determination of pollen pellets, our proposed method offers a degree of reproducibility between multiple participants (achieved by ensuring the work area is sufficiently lit to register as white on the smartphone) and could be applied to large citizen science projects with relative ease (Brodschneider et al. Citation2021). Inter-smartphone variation would certainly be a consideration in these projects and it would be prudent to have participants supply the make, model and operating system version as part of a project’s metadata. The choice of colour determination app can subtly modify the measurements (). Therefore, it should also be prescribed to study participants, of if this is not possible then it should be recorded in the metadata to enable any anomalies to be easily identified. In studying water quality and reflectance, it was found that there were no major deviations between smartphone operating systems, but that unexplainable behaviour in one particular brand could lead to low or zero values in the blue band (Yang et al. Citation2018; Malthus et al. Citation2020). This behaviour was also occasionally observed in our results as well (). Burggraaff et al. (Citation2021) also suggest participants are made aware of the data-biasing implications of CVD during any training or induction activities. However, this does require the individual to know that they have CVD. As it is an inherited disability and not a life-threatening condition, individuals born with CVD may not be aware they have it (Maule and Featonby Citation2016). The use of RGB values from a smartphone removes the two assumptions that (1) everyone can see the same colours and (2) those who have CVD know that they do. The data generated, whilst substantially more detailed than traditional colour determinations of pollen pellets (), can then be grouped and simplified in a consistent manner during the analysis stage.
Whilst we were unable to show that variation on the RGB bands was due to increasing mixing within a pollen pellet (), this does raise an interesting potential for RGB values to be used to determine increased dilution of a dominant pollen type with other pollen varieties. Using the cut-off 10% value presented by Brodschneider et al. (2018), half of the Epilobium angustifolium pollen pellets analysed in our study to demonstrate this RGB method were mixed pellets of the M-type. M-type mixed pellets are blended mixes of two, or multiple, pollen types that appear to be a homogenous pellet (Brodschneider et al. 2018). M-type mixed pellets have been estimated to make up around 40% of the pellets foraged by Apis mellifera (Betts Citation1920; Brodschneider et al. 2018) and this creates complexity when using colour to determine botanical origin. Our results do not show an apparent clear signal of shifting RGB away from a pure Epilobium angustifolium pollen pellet as the secondary pollen type was only identified to a family level (; ). It may therefore be that the Epilobium angustifolium pellets were mixed with different Boraginaceae species and a larger and more systematic study would identify a pattern in the RGB values based on increased dilution of the dominant pollen type by a second species. Alternatively, the colour variation could be related to relative dryness of pellets, but Salonen et al. (Citation2021) also found colour variation in pollen pellets of Epilobium angustifolium. This implies that palynological analysis is essential to the correct identification of pollen pellets (Conti et al. Citation2016) given that colour intra-taxonomic variation was observed in this study () and others (Salonen et al. Citation2021).
Mixed pollen pellets also present a limitation of the method of colour determination advocated herein. Specifically, the segregated (S-type) mixed pellets that are defined as having distinct segments of colour (Brodschneider et al. 2018). We found having two, or more, sections of distinct colour on a small object creates a challenge for a typical smartphone camera to register the distinction. This can be circumvented by manual separation of the segments, although this requires precise separation to avoid leaving residual portions adhering to separated segments. Whilst M-type mixed pellets have been estimated to account for around 40% of all pellets, S-type pellets are much rarer (Brodschneider et al. 2018). Betts (Citation1935) reported observing 76 S-type pellets from 3500+ loads examined over a five-year period (around 2%).
5. Wider applications and recommendations
The proposed methods to more inclusively document the colour of pollen pellets in melissopalynology is not the first use of RGB in palynology and is not restricted to pollen pellet colour. RGB values are integral to the Palynomorph Darkness Index (Goodhue and Clayton Citation2010) and shifts in the red value have been shown to indicate reworked pollen and spores (Strother et al. Citation2017). Colour is a basic descriptive feature in many branches of palynology: sediments (e.g. Riding Citation2021; Kroeck et al. Citation2021), honey (e.g. Terrab et al. Citation2022) and palynomorphs (e.g. Gibson and Bodman Citation2021) have all had their colour reported in recent palynological literature. Much has been written on the need for graphs and maps to be CVD friendly in scientific publishing (e.g. Allred et al. Citation2014; Frane Citation2015; De Paor et al. Citation2017). Ensuring this accessibility through the scientific process, from observation to reporting, is equally important. Simple technological means (as advocated in this paper) for CVD and people with visual impairments to understand observations of colour would go a long way to increasing inclusivity (De Paor et al. Citation2017).
Whilst we will not demand all colours ever mentioned in the palynological literature be accompanied by CVD friendly data, we reiterate the encouragement to consider those who see things differently proposed by De Paor et al. (Citation2017). Returning to the focus of this paper, we would make the following recommendations for those wanting to use pollen pellet colour as a proxy for botanical origin (with or without palynological ground truthing). Firstly, choose a colour determination app (one that works across platforms is ideal) to avoid inter-app variation. Secondly, make sure those measuring the colour are aware that white should register as 255:255:255. It would be beneficial for them to record the values that a white piece of paper registers as so that it is possible to correct any measured values, when white is not 255:255:255. Third, collecting data on phone type would enable any patterns of errors to be identified in colour determination. Finally, reporting RGB data to enable all end-users of the research access (e.g. Conti et al. Citation2016). Multiple studies, including ours, have highlighted the occasional inconsistency between the perceived relationship of pollen pellet colour and botanical origin (Conti et al. Citation2016; Salonen et al. Citation2021). Therefore, when time and funding facilitate it, a trial period to match pollen pellet colours to actual palynological content should be considered essential before collecting larger datasets purely based on pollen pellet colour.
6. Summary
We present a simple method to enable individuals with CVD to be included in pollen pellet research, when colour is an important variable to measure, with minimal biasing of findings. As with all pollen pellet analysis, lighting is key, and we suggest setting a working area to detect white on the smartphone. For citizen science based projects it is recommended that an app is prescribed to avoid inter-app uncertainty. It is also important to consider how we, as a scientific community, present colour to our readers and audiences. One great benefit of modern publishing is the opportunity to include extensive supplementary information or links to stable data repositories, we would encourage the inclusion of RGB (or other standardised colour coding) tables with studies where colour is a critical variable to the interpretation of the results.
Supplementary.xlsx
Download MS Excel (19.5 KB)Acknowledgements
The British Beekeepers Association is gratefully thanked for funding towards the research projects that this method was developed during. S. Hornby is grateful to the Natural Environment Research Council ONEPlanet doctoral training programme for her research internship funding. J. Benn thanks Northumbria University for his NU:Opportunities placement funding. B. Keating of the Tyneside Beekeepers Association is thanked for providing access to beehives and for collecting samples from one of the hives. Cushman and Wakefield and all the staff at the Premier Inn Newcastle City Centre (The Gate) hotel are thanked for facilitating access to one of the beehives.
Disclosure statement
No potential conflict of interest was reported by the authors.
Additional information
Notes on contributors
Sarah Hornby
SARAH HORNBY is a third year Earth Science student at Newcastle University, she is interested in a career in research, with plans to study a Masters in an Environmental Science field after she graduates summer 2022.

Jonty Benn
JONTY BENN is a final year BSc Environmental Science student at Northumbria University. He is using Palynology in his dissertation looking at honeybee foraging of Himalayan Balsam.
Rinke Vinkenoog
RINKE VINKENOOG is a Senior Lecturer in applied biology at Northumbria University. He studies pollination ecology in the Northeast of England and occasionally further afield.

Shannon Goldberg
SHANNON GOLDBERG is a Masters graduate from Newcastle University in Ecology and Wildlife Conservation. She researches plant-pollinator interactions to aid projects in boosting biodiversity in urban environments.

Matthew J. Pound
MATTHEW POUND is an Associate Professor in physical geography at Northumbria University. His research uses palynology to answer questions relating to environmental and climatic change.
References
- Allred SC, Schreiner WJ, Smithies O. 2014. Colour blindness: still too many red-green figures. Nature. 510(7505):340–340.
- Barry JA, Mollan S, Burdon MA, Jenkins M, Denniston AK. 2017. Development and validation of a questionnaire assessing the quality of life impact of Colour Blindness (CBQoL). BMC Ophthalmology. 17(1):7.
- Betts AD. 1920. The constancy of the pollen-collecting bee. Bee World. 2(1-4):10–11.
- Betts AD. 1935. The constancy of the pollen-collecting bee. Bee World. 16:111–113.
- Brodschneider R. 2018. The colour of pollen. Bee World. 95(3):73–73.
- Brodschneider R, Gratzer K, Heigl H, Auer W, Moosbeckhofer R, Crailsheim K. 2018. What we can (or cannot) learn from multifloral pollen pellets. Bee World. 95:78–80.
- Brodschneider R, Kalcher-Sommersguter E, Kuchling S, Dietemann V, Gray A, Božič J, Briedis A, Carreck NL, Chlebo R, Crailsheim K, et al. 2021. CSI pollen: diversity of honey bee collected pollen studied by citizen scientists. Insects. 12(11):987.
- Burggraaff O, Panchagnula S, Snik F. 2021. Citizen science with colour blindness: a case study on the Forel-Ule scale. PLoS One. 16(4):e0249755.
- Campos MG, Anjos O, Chica M, Campoy P, Nozkova J, Almaraz-Abarca N, Barreto LMRC, Nordi JC, Estevinho LM, Pascoal A, et al. 2021. Standard methods for pollen research. Journal of Apicultural Research. 60(4):1–109.
- Clarke KR, Gorley RN. 2006. PRIMER v6: user manual/Tutorial Plymouth routine in multivariate ecological research. Plymouth (UK): PRIMER-E.
- Conti I, Medrzycki P, Grillenzoni FV, Corvucci F, Tosi S, Malagnini V, Spinella M, Mariotti MG. 2016. Floral diversity of pollen collected by honey bees (Apis mellifera L.): validation of the chromatic assessment method. Journal of Apicultural Science. 60(2):209–212.
- De Paor D, Karabinos P, Dickens G, Atchison C. 2017. Color vision deficiency and the geosciences. GSA Today. 27:42–43.
- Di Pasquale G, Alaux C, Le Conte Y, Odoux JF, Pioz M, Vaissière BE, Belzunces LP, Decourtye A. 2016. Variations in the availability of pollen resources affect honey bee health. PLoS One. 11(9):e0162818.
- Frane A. 2015. A call for considering color vision deficiency when creating graphics for psychology reports. The Journal of General Psychology. 142(3):194–211.
- Gibson ME, Bodman DJ. 2021. Evaporite palynology: a case study of the Permian (Lopingian) Zechstein Sea. Journal of the Geological Society. 178(6):jgs2020-174.
- Goodhue R, Clayton G. 2010. Palynomorph Darkness Index (PDI) – a new technique for assessing thermal maturity. Palynology. 34(2):147–156.
- Kirk WDJ. 1994. Recording the colours of pollen loads. Bee World. 75(4):169–180.
- Kirk WDJ. 2006. A colour guide to pollen loads of the honey bee. 2nd ed. Cardiff (UK): International Bee Research Association.
- Kirk WDJ. 2018. The colours of pollen available to honey bees through the year. Bee World. 95(3):74–77.
- Kroeck DM, Eriksson ME, Lindskog A, Munnecke A, Dubois M, Régnier S, Servais T. 2021. Morphological variability of peteinoid acritarchs from the Middle Ordovician of Öland, Sweden, and implications for acritarch classification. Palynology. 45(4):705–715.
- Lau P, Bryant V, Rangel J. 2018. Determining the minimum number of pollen grains needed for accurate honey bee (Apis mellifera) colony pellet analysis. Palynology. 42(1):36–42.
- Louveaux J, Maurizio A, Vorwohl G. 1978. Methods of melissopalynology. Bee World. 59(4):139–157.
- Malthus TJ, Ohmsen R, Woerd HJ. 2020. An evaluation of citizen science smartphone apps for inland water quality assessment. Remote Sensing. 12(10):1578.
- Manning R. 2001. Fatty acids in pollen: a review of their importance for honey bees. Bee World. 82(2):60–75.
- Martin AC, Harvey WJ. 2017. The Global Pollen Project: a new tool for pollen identification and the dissemination of physical reference collections. Methods in Ecology and Evolution. 8(7):892–897.
- Maule L, Featonby D. 2016. Colour vision deficiency and physics teaching. Physics Education. 51(3):035005.
- PalDat. 2021. PalDat – a palynological database (2000 onwards); [accessed 2021 Sep 30]. www.paldat.org.
- Price C, Maor R, Shachaf H. 2018. Using smartphones for monitoring atmospheric tides. Journal of Atmospheric and Solar-Terrestrial Physics. 174:1–4.
- Riding JB. 2021. A guide to preparation protocols in palynology. Palynology. 45(sup1):1–110.
- Salonen A, Lavola A, Virjamo V, Julkunen-Tiitto R. 2021. Protein and phenolic content and antioxidant capacity of honey bee-collected unifloral pollen pellets from Finland. Journal of Apicultural Research. 60(5):744–750.
- Sipos L, Végh R, Bodor Z, Zaukuu JLZ, Hitka G, Bázár G, Kovacs Z. 2020. Classification of bee pollen and prediction of sensory and colorimetric attributes – a sensometric fusion approach by e-nose, e-tongue and NIR. Sensors. 20(23):6768.
- Strother SL, Salzmann U, Sangiorgi F, Bijl PK, Pross J, Escutia C, Salabarnada A, Pound MJ, Voss J, Woodward J. 2017. A new quantitative approach to identify reworking in Eocene to Miocene pollen records from offshore Antarctica using red fluorescence and digital imaging. Biogeosciences. 14(8):2089–2100.
- Terrab A, Moujanni A, Essamadi AK, Hernanz D, Díez MJ, Berjano R. 2022. A palynological and geographical characterization of labeled resin spurge honey: Euphorbia resinifera. Palynology. 46(1):1–10.
- van der Steen JS, Brodschneider R. 2014. Public participation in bee science: C.S.I. pollen. Bee World. 91(1):25–27.
- Yang Y, Cowen LL, Costa M. 2018. Is ocean reflectance acquired by citizen scientists robust for science applications? Remote Sensing. 10(6):835.