
 ?Mathematical formulae have been encoded as MathML and are displayed in this HTML version using MathJax in order to improve their display. Uncheck the box to turn MathJax off. This feature requires Javascript. Click on a formula to zoom.
ABSTRACT
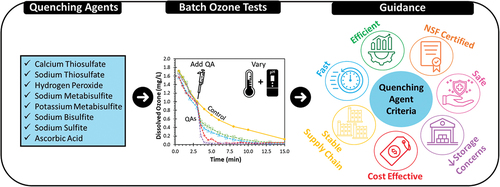
Quenching of excess aqueous ozone (O3) residual is needed to avoid off-gassing and oxidative damage to downstream components. Eight quenching agents (QAs), calcium thiosulfate (Ca-Thio), sodium bisulfite (Na-Bi), hydrogen peroxide (H2O2), sodium thiosulfate (Na-Thio), sodium metabisulfite (Na-Metabi), potassium metabisulfite (K-Metabi), sodium sulfite (Na-S), and ascorbic acid (AscAcid) were tested at varying pHs (7.5, 7.9, and 8.5) and temperatures (4°C, 15°C, and 23°C). Temperature had significant effects on initial quenching (≤30 s), with less occurring at 4°C than 23°C; but with extended contact time this trend reversed. Quenching efficiency was not substantially affected by pH. Ca-Thio and Na-Thio were inefficient but quick, had lower mass requirements, and minimal handling concerns. Na-Metabi, Na-Bi, and Na-S were quick and efficient, but K-Metabi was the only QA that quenched (26–31%) less O3 than stoichiometry at all conditions. These sulfite-based QAs had more handling concerns and greater mass requirements. H2O2 was slower than other QAs but 2–9× quicker than predicted by rate coefficients and efficient when given longer contact time (≤5 min). H2O2 had some handling concerns but the lowest mass requirements (assuming 5 min contact time) and creates desirable AOP conditions. AscAcid consistently quenched (22–113%) more O3 than the stoichiometric ratio but had higher mass requirements, except in colder temperatures. Hydrodynamics, QA-diffuser design, and supply chain were also important considerations.
Graphical abstract
Introduction
Ozonation is an effective oxidation process utilized by drinking and wastewater treatment plants for contaminant degradation and pathogen inactivation. Water quality goals are achieved by creating a dissolved ozone (O3) residual in water, which then passes through a baffled O3 contactor to achieve a target O3 exposure (CT). Under conditions where excess dissolved O3 (DO3) residual is present in the contactor effluent, an O3 quenching agent (QA) is applied to prevent downstream off-gassing (e.g., protect worker safety) and to safeguard equipment (e.g., rubber o-rings, pumps) from oxidative damage (Bromley and Wert Citation2002; Cataldo Citation2019; Langlais, Reckhow and Brink Citation2019; Schulz Citation2014). The QA is typically applied in at least one chamber prior to the ozonated water exiting the contactor to allow sufficient contact time for hydraulic mixing and complete DO3 residual quenching. In most treatment facilities, a chemical feed system for quenching DO3 residual is considered a standard part of the O3 system design. Drinking water treatment plants targeting disinfection often require quenching of excess DO3 residual during certain water quality conditions (e.g., low temperature, low dissolved organic carbon (DOC) concentration, low pH). Wastewater treatment plants often have greater DOC concentrations and temperature that accelerate O3 decomposition and are less likely to require QA addition.
The selection of an O3 QA is determined by several factors related to system design and operation. The chemical reaction kinetics of the QA are a primary consideration with respect to stoichiometry (i.e., low mass/molar ratio), rapid reaction time (i.e., O3 reaction rate constant), minimal secondary reactions (i.e., downstream oxidant demand, disinfection product formation), and need for additional advanced oxidation process (AOP) conditions. Chemical feed system design considerations may include QA stability (e.g., non-reactive, nonvolatile, low freezing point), material compatibility (e.g., storage tank, feed pumps, delivery lines), and application point (e.g., contactor location, diffuser design, mixing efficiency). Material handling and employee safety considerations (e.g., nontoxic, nonflammable, non-corrosive) are also factored into QA selection (K. L. Rakness Citation2005; Richey et al. Citation2000). Practical considerations may include product purity (i.e., NSF 60 certification), product availability (i.e., delivery frequency, supplier location), and cost (Richey et al. Citation2000).
Calcium thiosulfate (Ca-Thio), sodium bisulfite (Na-Bi), and hydrogen peroxide (H2O2) are the most common O3 QAs used at water treatment facilities, according to a survey of O3 application literature and conference proceedings (Bromley and Wert Citation2002; Mazloum et al. Citation2004; Mitra et al. Citation2017; Neemann et al. Citation2001; K. L. Rakness Citation2005; E. C. Wert et al. Citation2016; Richey et al. Citation2000; Schulz Citation2014; Soucie, Sheen and Madura Citation2001). Little is documented on historical O3 quenching, but based on the survey, prior to the early 2000s, H2O2 appeared to be most frequently used for O3 quenching. References to the use of Ca-Thio as a QA were observed more broadly after 2000; the same year a patent application for the use of Ca-Thio was submitted to the US Patent Office by Ag Formulators Inc (Bromley and Wert Citation2002; Holbrook Citation2005; Mazloum et al. Citation2004; Mitra et al. Citation2017; Neemann et al. Citation2001; K. L. Rakness Citation2005; E. C. Wert et al. Citation2016; Richey et al. Citation2000; Schulz Citation2014; Soucie, Sheen and Madura Citation2001). Since the early 2000s, trends in quenching have largely not changed, despite documented limitations of the three common QAs (Hojjatie and Abrams Citation2006; Holbrook Citation2005). H2O2 has been characterized as slow, unstable (e.g., reactive, degrades), the most expensive, and requires special handling and storage (e.g., storage in stainless steel, corrosive). The additional benefit of H2O2, when added to O3, is it’s an AOP which degrade taste & odor compounds and micropollutants (Bromley and Wert Citation2002; K. L. Rakness Citation2005). Na-Bi off-gases sulfur dioxide and thus requires a special scrubbing and ventilation system, as well as insulation to avoid elevated temperatures (K. L. Rakness Citation2005; Richey et al. Citation2000). Additionally, Na-Bi is subject to crystallization at temperatures below 15°C (60℉) and requires tight temperature controls in most environments (K. L. Rakness Citation2005; Richey et al. Citation2000). Ca-Thio has shown low efficiency, calcium deposits/blockages in feed lines have been noted, and there may be concerns about use restrictions and supply due to the existing patent (Bromley and Wert Citation2002; Holbrook Citation2005; K. L. Rakness Citation2005). Overall, Ca-Thio has less stability and handling considerations compared to the other common QAs (Bromley and Wert Citation2002; K. L. Rakness Citation2005). Both Ca-Thio and Na-Bi have also been effectively applied for dechlorination (Bedner, MacCrehan and Helz Citation2004; MacCrehan, Bedner and Helz Citation2005). There are other common dechlorination reagents that are reductants, which have yet to be assessed for O3 quenching. Given the limitations with the three common QAs, these unevaluated reducing agents may pose an opportunity to expand the chemical alternatives for O3 quenching.
Although this study focuses on O3 quenching for treatment process control, most studies in the literature focus on selection of QA for sample collection. The most relevant takeaways from these studies are summarized in the supplemental information (Text S1 and Table S1). When O3 quenching is performed at full-scale (flows on the order of mgd), quenching efficiency can affect the applied dosing requirements, dosing system design, and required infrastructure. Accounting for quenching efficiency under the range of expected water quality conditions is important to ensure the quenching system design is adequate and to prevent over- or underdosing of QA (Bromley and Wert Citation2002). Overdosing of a QA can result in increased dosing requirements for downstream oxidants (e.g., chlorine used as a secondary disinfectant), to overcome the oxidant demand from the excess QA (Bouland, Duguet and Montiel Citation2004; Mazloum et al. Citation2004; Richey et al. Citation2000). Underdosing of a QA can result in O3 off-gassing and degradation of equipment downstream (Bromley and Wert Citation2002). During application, online monitoring downstream of the quenching application point is not always effective for pacing QA dosing, assessing quenching performance, and preventing over/underdosing. If monitoring is performed, online oxidation-reduction potential (ORP) is typically used, but has been evaluated with varied results (Muri Citation2006; Muri Citation2008). In some installations, DO3 residual probes are used near the effluent chambers/channels, but they are not always sensitive enough, with typical detection limits in the range of 0.1 to 0.2 mg/L. If the O3 process effluent stream is not well mixed, a single point measurement, whether ORP or DO3 may not effectively reveal residual O3 in the effluent prior to exiting the contactor.
Water quality conditions can have a direct impact on QA performance. Temperature affects chemical reaction kinetics. Several studies have shown that O3 decay rate, which is primarily driven by reactions between O3 and natural organic matter (NOM), increases substantially with increasing temperature (Elovitz, von Gunten and Kaiser Citation2000; Shin, Hidayat and Lee Citation2016). It would follow that QAs, with reaction rate constants similar to O3 reactive NOM fractions (e.g., Group I compounds kO3 >106 M−1s−1) (Lee et al. Citation2013) would similarly have accelerated reactions with O3 due to increased temperature, and slower reactions with lowered temperature. Speciation of QAs and other water matrix components (e.g., NOM) may be dependent on pH and can affect the reactions that occur and their kinetics (kO3). For example, O3 decay has been shown to increase with pH due to the deprotonation of NOM, which increases electrophilic O3 decomposition (Elovitz, von Gunten and Kaiser Citation2000). The magnitude of pH’s effect on O3 reaction rate constants varies widely depending on the functional groups of the reactant (e.g., QA) being protonated/deprotonated (von Sonntag and von Gunten Citation2015). Efficiency and rate of O3 quenching reactions may be affected by pH due to changes in the direct reaction with O3, as well as changes in secondary reactions (von Sonntag and von Gunten Citation2015). Despite the importance of quenching, there are currently no practical, comprehensive guidelines in the peer-reviewed literature for dosing O3 QAs, and there is limited quantitative characterization of how these water quality and hydrodynamic factors may influence the efficiency and rate of quenching reactions. In highly regarded water treatment fundamental and O3-specific textbooks, little if anything is mentioned about the need to quench residual O3, quenching chemistry, nor guidance on how to design a quenching process at the end of ozonation (Benjamin and Lawler Citation2013; Crittenden et al. Citation2012; Langlais, Reckhow and Brink Citation2019; K. L. Rakness). Rakness provides the most explicit guidance on O3 quenching, discussing the use of Na-Bi, Ca-Thio, and H2O2. The guidance, however, is still vague. For example, it is suggested that site-specific factors will affect quenching but generally dosing ≥10% excess of QA is recommended, and that H2O2 may take ≥3–5 min to react (K. L. Rakness Citation2005).
The lack of peer-reviewed information regarding QA efficiency has led many utilities and consultants to rely on theoretical stoichiometry or generic dosing charts from chemical manufacturers for ranges of water temperatures and pH, with little information on how the guidance was produced (e.g., water quality and hydrodynamic conditions). Accordingly, the main goal of this study was to provide quantitative guidelines for quenching O3 with the three commonly used QAs (Ca-Thio, Na-Bi, H2O2). Sodium metabisulfite (Na-Metabi), potassium metabisulfite (K-Metabi), ascorbic acid (AscAcid), sodium sulfite (Na-S), and sodium thiosulfate (Na-Thio) are reducing agents used to quench other oxidants (e.g., chlorine) and were also included in the systematic evaluation for O3 quenching. The specific objectives of this work were to (1) determine the mass and molar ratios of quenched O3 to applied QA (qO3:QA) under ambient conditions in Colorado River water (CRW) and compare to the theoretical stoichiometry ((qO3:QA)th), (2) determine the effect of temperature and pH on O3 quenching efficiency, (3) use computational fluid dynamics to demonstrate the effect of QA diffuser design and contactor hydraulics on quenching efficacy at full-scale, and (4) provide practical guidelines and information for O3 quenching applications.
Materials and methods
Terminology
Key experimental and theoretical terms used through the manuscript are defined in .
Table 1. Key terms used throughout the manuscript and their definitions.
QA selection and reagents
QAs were selected based on their reaction rates with O3 and hydroxyl radicals. Most QAs are reductants that participate in a redox reaction by donating electrons to an oxidant (Kristiana et al. Citation2014; Langlais, Reckhow and Brink Citation2019). As shown in , O3 gains two electrons from the QA during the quenching reactions. The theoretical ratio of quenched O3 to applied QA (qO3:QA)th was calculated from the stoichiometric equations (). Under ideal conditions, the (qO3:QA)th of the QAs evaluated in this study are expected to have molar ratios between 1:1 and 4:1 and mass ratios between 1:0.35 and 1:3.59 (). With the exception of H2O2, all quenching agents are Group I compounds, with O3 reaction rate constants (kO3) in the range of 106 to 108 M−1s−1 () (Lee et al. Citation2013); meaning that under ideal conditions, quenching will occur on the order of seconds or faster (K. L. Rakness Citation2005).
Table 2. Key theoretical values associated with O3 and QA reactions, including theoretical quenched ozone to QA ratios (qO3:QA)th, chemical formula and molar mass of each QA represented as the parent compound and as the active compound, theoretical O3 + QA reaction rate constants (kO3), hydroxyl radical reaction rate constants (kOH•), and half reactions and overall quenching redox reactions.
Calcium thiosulfate was obtained from Best Sulfur Products (Fresno, CA) as Captor 30% w/v. Sodium thiosulfate (CAS: 7772-98-7), hydrogen peroxide (7722-84-1), ascorbic acid (50-81-7), sodium sulfite (7757-83-7), sodium bisulfite (7631-90-5), sodium metabisulfite (7681-57-4), and potassium metabisulfite (16731-55-8) were all obtained from Fisher and were anhydrous and of Certified ACS reagent grade or higher. Quenching reagents were volumetrically diluted in ultrapure water (>17 MΩ cm) to produce QA stocks in the 0.3 to 2.0 mg/mL concentration range.
Batch ozonation and quenching experiments
All experiments were performed using Colorado River water (CRW), collected from a raw water sample tap at the Alfred Merritt Smith Water Treatment Facility (AMSWTF), whose intake is in Lake Mead (Boulder City, Nevada). The CRW was characterized by pH (7.9), turbidity (0.6 NTU), conductivity (850–980 µS/cm), total alkalinity (140–144 mg/L as CaCO3), and TOC (2.4–2.6 mg/L) and was stored at 4°C until use. To adjust water temperature, water was placed in refrigeration at 4 or 15°C overnight until immediately before use or left at ambient room temperature overnight for 23°C conditions. Water temperature was checked before and at the end of each experiment to ensure temperature did not substantially change (±2℃), and when necessary, the batch reactor was chilled to maintain temperature. Sodium hydroxide and hydrochloric acid were used to adjust pH of water samples, as appropriate. The pH of water was measured before and after experiments (including after addition of quenching agent) and pH did not change substantially (<0.5) in any of the experiments.
Batch ozonation methods were used to prepare ozonated samples (Hoigné and Bader Citation1994; Wert et al. Citation2011). Briefly, gaseous O3 (260–280 g/Nm3, (Cataldo Citation2019)) was generated via a Plasma Block (PlasmaTechnics, Racine, WI) fed by high-purity oxygen. The O3 gas was diffused in a 4 L reactor containing chilled (4°C) ultrapure water to produce a high concentration O3 stock (60–100 mg/L as DO3). The O3 stock concentration used to spike samples was measured for each batch of samples, and concentration varied by up to 5%. O3 stock was spiked into 1 L stirred batch reactors containing CRW to achieve an initial O3 concentration of 2.5–3.5 mg/L (target level depending on water quality condition being tested). Due to variation in O3 stock the applied ozone dose varied slightly from sample to sample; for each condition, the applied O3 dose of quenching experiment samples were within <1–12% of the applied O3 dose of the corresponding control experiment. The effects of this variability in applied O3 dose on O3 decay and quenching ratio results were evaluated and were found not to be substantial. Control experiments (no QA added) at the different temperatures and pHs were conducted in this manner and immediately prior to and on the same day as corresponding quenching experiments. Quenching experiments were conducted similar to control experiments, except quenching agent was spiked into the ozonated sample at a time point (1.5–5 mins) selected to target when DO3 was 0.6–1.0 mg/L. The volume of QA spiked into the sample was based on stoichiometry, targeted at quenching 25% of the expected O3 residual at that time point, which was based on control tests. The volume of QA stock spiked was generally low (<0.5% total reactor volume) and thus did not have a measurable dilution effect on ozone residual. A subset of experiments spiking QAs at different applied ratios (e.g., 25% vs. 50% of the stoichiometric ratio) were conducted. Insignificant differences were observed in most cases and thus experiments discussed throughout the manuscript were conducted at the lower applied QA ratio (25%) condition. For further discussion see Supplemental Information Text S2, Figure S1.
DO3 residuals were measured using the indigo trisulfonate method (Standard Method 4500-O3) (APHA; AWWA; WEF Citation1998; K. L. Rakness et al. Citation2010) at 30s after O3 spiking and subsequently at 30 s to 1 min intervals until complete O3 depletion (<0.02 mg/L DO3). The QA was spiked immediately after a DO3 residual measurement, and DO3 was measured again 30s after QA was spiked and then every 30 s–1 min until DO3 was depleted.
Data analysis
The theoretical O3 quenched to QA (qO3:QA)th values are derived from stoichiometry as described in a previous section. The theoretical time to quenching completion (qTimeth) was found by kinetic modeling at standard conditions, further described in the Supplemental Information, Text S3 and Table S2.
Derivation of key experimental values are summarized by , which describes three example outcomes in terms of efficiency and quenching speed. Change in O3 residual (∆[O3]) over each time interval during control and quenching experiments was determined using Equationequation 1[1]
[1] and defined as the decrease in the O3 residual from time point 1 (e.g., 30 s) to time point 2 (e.g., 1 min).
Figure 1. Graphical (top row) and tabular (bottom row) examples of how the quenched ozone (qO3) was determined, for use in subsequent ratio calculations (qO3:QA)exp, and identification of key quenching timepoints (qTimeexp) on experimental ozone decay curves (i.e., ozone residual measurements overtime). Three example outcomes are shown where (a) calcium thiosulfate was a fast (i.e., qTimeexp-max ≤30s) and inefficent QA (i.e., (qO3:QA)exp-max <85% of the (qO3:QA)th), (b) sodium metabisulfite was a fast (i.e., qTimeexp-stoi ≤30s) and efficent QA (i.e., (qO3:QA)exp-max within ± 15% of the (qO3:QA)th), and (c) ascorbic acid was a fast (i.e., qTimeexp-stoi ≤30s) and greater than ideal (i.e., (qO3:QA)exp-max >; (qO3:QA)th by more than 15%) QA. Each graph shows results from both a control test (purple points) and an experimental test with quenching (green points). Note, the x-axis starts at 2 minutes and that time point zero (t0) is when the QA is added, in these examples at 3 minutes. The calculations for determining the qO3 and its relation to the theoretical stoichiometry ((qO3:QA)th) are given below each graph. The quenching time where (qO3:QA)th was achieved is noted as qTimeexp-stoi and the time to reach quenching completion is noted as qTimeexp-max.
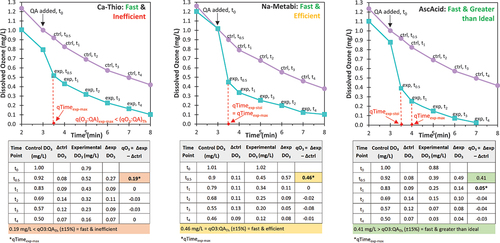
In the control samples, the decrease in DO3 residual is due to O3 reacting with DOC and other water quality constituents. In the experimental samples, where a QA was applied, the decrease in DO3 is due to both reactions with water matrix constituents and O3 quenched by the QA. As described by Equationequation 2[2]
[2] and shown in , the decrease in O3 due to quenching only (qO3) was found at each paired time interval by the difference in ∆[O3] for the experimental sample and the control sample.
Since all QAs, except H2O2, were expected to react with O3 on the order of seconds or less, the qO3 was calculated from the O3 residual measurements immediately prior to QA application and 30 s after QA application ((qO3)exp-30s). The (qO3)exp-30s was then used to calculate the O3 quenched to applied QA molar ratio at 30 s ((qO3:QA)exp-30s). For most of the QAs, (qO3:QA)exp-30s < (qO3:QA)th; thus, the cumulative qO3 was determined by adding together the qO3 for each subsequent time interval. The time at which the cumulative (qO3:QA)exp= (qO3:QA)th, was noted as qTimeexp-stoi. The (qO3:QA)exp-max was defined as the maximum cumulative (qO3:QA)exp. The endpoint of the time interval at which (qO3:QA)exp-max was reached, was considered as the time to quenching completion (qTimeexp-max). All (qO3:QA)exp values were calculated using both molar units (mol:mol) and mass units (mg:mg), and concentrations for QAs represented in units “as the active compound” and “as parent compound,” indicated in .
Defining relative QA efficiency and quenching speed
When conditions are ideal, theoretically the QAs would react with O3 instantaneously, with the exception of H2O2, and at 100% efficiency, i.e., with qTimeth and at (qO3:QA)th shown in . In application, the efficiency and quenching rate may be affected by several factors including water quality conditions and other constituents in the water (e.g., NOM, pH, temperature, inhibitors, initiators, promotors). These effects will vary with the different QAs and with different waters. In this study, QAs with (qO3:QA)exp-max within ± 15% of the (qO3:QA)th, were considered “efficient.” QAs with (qO3:QA)exp-max at <85% of the (qO3:QA)th, meaning 15% less O3 was quenched than expected (or even less), were considered “inefficient.” If (qO3:QA)exp-max > (qO3:QA)th by more than 15%, then the QA efficiency was considered “greater than ideal.”
An efficient or greater than ideal QA was considered “fast” to react when a qTimeexp-stoi ≤ 30 s. In either case, the qTimeexp-max may also be at ≤ 30 s or the quenching reaction may be “extended” if the reaction continues beyond 30 s. Inefficient QAs may also be considered “fast” if qTimeexp-max ≤ 30 s, despite not having a qTimeexp-stoi and (qO3:QA)exp-max < 85% (qO3:QA)th. A QA may be considered “moderately fast” if qTimeexp-stoi = 1 min, or in the case of an inefficient QA when qTimeexp-max = 1 min. A QA was considered “slow” if qTimeexp-stoi > 1 min, or in the case of an inefficient QA when qTimeexp-max > 1 min.
Unit expression
Mass and molar ratios values are expressed in terms of “as parent compound” and/or “as active compound/component” throughout the manuscript. This is important to note as different individuals will utilize different unit expressions depending on the intended use and their perspective. When discussing results in terms of O3 and quenching chemistry, units are expressed in terms of “as active compound” in the main text because it enabled the efficiency comparison of multiple QAs that have the same active component but different parent compound. Typically, practitioners will use units in terms of “as parent compound,” and thus, in the practical application sections, units are expressed as such to enable direct use. In many cases in the literature and in discussion, the unit terms are not fully expressed, and it is unclear whether mg/L or mol/L or mg:mg or mol:mol values are in terms of “as parent” or “as active component.” One might assume “as parent compound” is being used if units are not specifically expressed in these terms, but this may not always be the case and can result in negative practical outcomes. The mass requirements values expressed “as parent” are 17–58% higher than the mass requirement values expressed “as active compound,” depending on the QA. Thus, if the wrong unit expression is assumed then QA could be greatly over or underdosed. The unit expressions used in the main text are indicated, particularly in the figure and table captions. All results are provided in both “as parent compound” and “as active compound” unit expressions in the supplemental information, Tables S5-S8.
Computational fluid dynamic analysis
A Revit model was developed to create the model domain for the CFD analysis. The CFD model domain consists of a single O3 contactor at AMSWTF from the contactor inlet gates to the outlet gates. The average contactor train flow was 37.5 mgd with peak and low flows of 75 mgd and 20.6 mgd, respectively. AMSWTF is a 600 mgd facility where O3 is applied to raw untreated water as the first step in treatment. The AMSWTF O3 contactor design is comprised of 12 Cells with the Ca-Thio applied in the outlet of Cell 10, above or adjacent to the baffle (Figure S2). AMSWTF currently employs Ca-Thio for quenching residual O3 to prevent off-gassing and safeguard downstream equipment from oxidative damage. The QA injection points were included in the model where the chemical discharges into the primary flow. The flow distribution to the individual orifices in the chemical diffuser piping was evaluated with analytical calculations and specified in the CFD model, further described in (Table S3–S4 and Text S4).
The CFD models used were developed using Ansys 2022 R2. This software package includes Space Claim Direct Modeler to develop the model geometry, Fluent Meshing for the meshing generation, Ansys Fluent for model processing and post-processing, and CFD-Post for additional post-processing. A three-dimensional, single-phase flow (water only) model was developed for each flow condition with a fixed water surface elevation. The species transport model was used to trace the Ca-Thio (QA), which solves the conservation equations describing convection and diffusion without chemical reactions. Three designs for stainless steel diffuser manifolds, that span the width of the contactor, were modeled. Further detail on CFD model methodology, the domain, and boundary conditions can be found in Supplemental Information Text S4 and Tables S3- Table S4.
Results and discussion
Quenching efficiency at ambient conditions (23°C, pH 7.9)
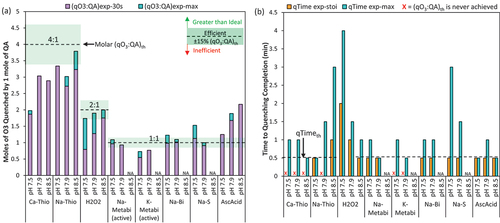
and shows, under ambient conditions (23°C and pH 7.9), Ca-Thio, Na-Thio, and K-Metabi quenched less O3 than expected based on stoichiometry ((qO3:QA)exp-max <85% (qO3:QA)th); although, Ca-Thio and K-Metabi were fast to react, reaching quenching completion (qTimeexp-max) in ≤ 30 s (, ). This fast reaction was expected as all three of these QAs are Group I Compounds, having high reaction rates with O3 (kO3 >106-109 M.s−1) (Lee et al. Citation2013; von Sonntag and von Gunten Citation2015). Na-Thio was slow to react, with qTimeexp-max = 1.5 min (, ). Interestingly, both Ca-Thio and Na-Thio quenched at the same (qO3:QA)exp-max of 3 moles O3:1 mole QA, which is 25% less O3 than expected (, Table S5). In both O3 quenching reactions, the thiosulfate anion (S2O32-) is the active compound responsible for quenching O3, and the cation (Ca2+, 2 Na+) is what differentiates the two QAs. K-Metabi also quenched 25% less than expected overall (). The active component of K-Metabi is bisulfite (HSO3−), which is the same active component for Na-Metabi and Na-Bi, yet Na-Metabi and Na-Bi did quench to (qO3:QA)th, with the K-Metabi (qO3:QA)exp-max being 19% and 35% lower than Na-Metabi and Na-Bi, respectively. Burns et al. conducted bench-scale testing with ozonated surface water from Vancouver (pH 7.5) and evaluated multiple QAs, including Ca-Thio. They found 60% higher mass concentration of Ca-Thio was required than indicated by (qO3:QA)th (Burns et al. Citation2008).
Figure 2. Experimental quenching results at the ambient water quality conditions (Colorado River Water at 23°C and pH 7.9) including (a) molar quenching efficiency and (b) time to reach quenching stoichiometry (qTimeexp-stoi) and quenching completion (qTimeexp-max). The molar ratio for both the parent and active compound are given for Na-Metabi and K-Metabi (e.g., HSO3− vs. Na-Metabi). For all other QAs, the molar ratios results are the same whether represented as parent and active compound. Initial DO3 dose = 1.6–1.9 mg/L, QAs were dosed at 13–50% stochiometric mass ratio when residual DO3 = 0.87–1.05 mg/L. An “Inefficient” QA was defined by (qO3:QA)exp-max at < 85% of the (qO3:QA)th, meaning 15% less O3 was quenched than expected (or even less), an “Efficient” QA was defined by (qO3:QA)exp-max within ± 15% of the (qO3:QA)th, and a “Greater than Ideal” QA is defined by (qO3:QA)exp-max > (qO3:QA)th by more than 15%. A “fast” QA was defined by qTimeexp-stoi ≤30s, a “moderately fast” QA was defined by qTimeexp-stoi = 1 min, and a “slow” QA was defined by qTimeexp-stoi >1 min. The quenching reaction was considered “extended” if the reaction continued beyond 30s. Note the black dashed lines in (b) represents the qTimeth, with the qTimeth for H2O2 above the scale at 8.5 min.
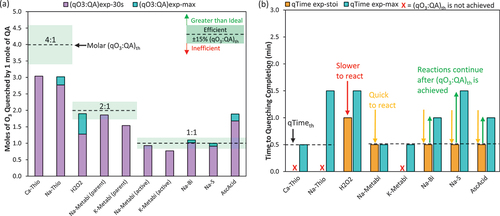
Table 3. The theoretical (qO3:QA)th and experimentally derived ozone to quenching agent molar and mass ratios (given as parent and as active) at 30s (qO3:QA)exp-30s and maximum quenching time (qO3:QA)exp-max) in Colorado River Water at ambient conditions (23°C and pH 7.9), the theoretical time to quenching completion (qTimeth) and experimental quenching time to reach theoretical stoichiometry (qTimeexp-stoi) and quenching completion (qTimeexp-max.).
Though less common than Ca-Thio and H2O2, Na-Bi is currently used as an O3 QA at select full-scale facilities. Na-Bi quenched O3 efficiently and fast, i.e., reached (qO3:QA)th with a qTimeexp-stoi ≤ 30 s (). Na-Bi had an extended reaction time, continuing to react in the first minute after being added to solution (qTimeexp-max = 1 min), quenching 10% more O3 cumulatively than predicted by stoichiometry (), although still within a ± 15% error margin. The Burns et al. study also evaluated Na-Bi and found it was more efficient than Ca-Thio requiring only slight overdosing (12–17% by mass as parent compound) (Burns et al. Citation2008). Another study evaluated Na-Bi for the Water Disinfection Plant in Incline Village, Nevada (Richey et al. Citation2000). This study determined that more Na-Bi was required than the stoichiometric amount, 35% (w/w as parent compound) more, but water quality conditions (i.e., pH and temperature) were not stated and thus it is difficult to directly compare results (Richey et al. Citation2000).
H2O2 quenched > 85% (qO3:QA)th moderately fast with a qTimeexp-stoi = 1 min (). H2O2 had an extended reaction with the completion of O3 quenching occurring at a qTimeexp-max = 1.5 min (); which was almost 6 times faster than expected, based on the low kO3 at ambient pH (qTimeth = 8.5 min, ). Hydroxyl radicals (∙OH) are a product of the H2O2 + O3 reaction, and ∙OH may accelerate the decrease in O3 residual via the hydroxyl radical chain reaction (Sein et al. Citation2007; Staehelin and Hoigne Citation1982; von Sonntag and von Gunten Citation2015). H2O2 is defined as a promotor through its conversion of ∙OH to superoxide radicals (and
) which act as chain reaction carriers and further quench the residual O3 Gardoni et al., (Citation2012). Cumulatively, H2O2 quenched O3 efficiently at 95% of the (qO3:QA)th (i.e., (qO3:QA)exp-max = 1.9:1.0, ). The complex reaction between H2O2 and O3 has been well studied and is known as the peroxone process (Sein et al. Citation2007; Staehelin and Hoigne Citation1982; von Sonntag and von Gunten Citation2015). The yield of ∙OH, through reaction of O3 with H2O2 (), is purportedly only ~ 50% due to the second elementary step where the HO5− adduct (formed in the first elementary reaction step) may decompose in two different ways, with each decomposition reaction having similar rates (Merényi et al. Citation2010). O3 and H2O2 are consumed in the first elementary step to form HO5− and thus O3 depletion by H2O2 is still expected to occur at the (qO3:QA)th, despite the low ∙OH reaction yield. Previous tests evaluating H2O2 as a QA have described it as slow to react, requiring 3–5 min, but presumably this descriptor is based on the low reaction rate at typical water pH () (Langlais, Reckhow and Brink Citation2019; Richey et al. Citation2000). Both Burns et al. and Richey et al. found H2O2 required the most overdosing of the three common QAs (H2O2, Ca-Thio, Na-Bi) at 78% and 140% higher than the (qO3:QA)th (Burns et al. Citation2008; Richey et al. Citation2000).
Three of the unconventional O3 QAs assessed, Na-Metabi, AscAcid, and Na-S, all quenched fast and efficiently (i.e., qTimeexp-stoi ≤ 30 s, (qO3:QA)exp-30s and (qO3:QA)exp-max ≥85% (qO3:QA)th ()). Na-Metabi reached quenching completion the fastest of the three with a qTimeexp-stoi and qTimeexp-max ≤30 s (). Although Na-S reached the stochiometric ratio (±15%) within 30 s, the quenching reaction was extended with qTimeexp-max = 1.5 min. AscAcid was the only QA that showed greater than ideal quenching efficiency. Almost twice (1.9×) as much O3 was cumulatively quenched by AscAcid than predicted by the stoichiometric ratio of 1 mole of O3:1 mole of AscAcid (), which was achieved by a slightly extended reaction time of qTimeexp-max = 1 min (). These results suggest that that the complexity of the AscAcid + O3 reaction may not be entirely reflected by the single reaction presented in . The reaction between O3 and AscAcid produces dehydroascorbic acid (DHA) which can be reduced back to AscAcid spontaneously under neutral and alkaline pH and by thiols such as cysteine (Jung and Wells Citation1998); thus, furthering the O3 quenching ability of AscAcid (Deutsch Citation1998; Yin et al. Citation2022). DHA can also rapidly hydrolyze to 2,3-diketogulonic acid, which can be oxidized by O3 to >50 product compounds theorized to also be reducing agents (Deutsch Citation1998).
Effect of temperature
During the control tests, the first order O3 decay rate increased linearly with temperature (Figure S3), indicating accelerated reactions between O3 and NOM. At 23°C, O3 decay is nearly 2 times quicker (1.73×) than at 4°C. These results are similar to those presented by Bromley and Wert which found that at pH 7.5 and 8.5, an increase in temperature from 12°C to 22°C decreased the O3 half-life in CRW by 1.5–2.9 (Bromley and Wert Citation2002). Abada et al.observed an O3 half-life more than two times greater (2.2×) at 26°C compared to 15°C in CRW (Abada, Atkinson and Wert Citation2024). Shin et al. found that the O3 decay was most significantly impacted by the seasonal variation in water temperature (6–26℃) where the minimum (0.027 min−1) and maximum (0.066 min−1) decay constants were observed when the water was 6°C and 26°C, respectively; a difference of 2.4 (Shin, Hidayat and Lee Citation2016).
O3 decay is more rapid at warmer temperatures due to the accelerated reactions with NOM and autodecomposition that increases the ∙OH yield. An increase in ∙OH yield from 0.28 to 0.68 was demonstrated for the same lake water with a temperature increase from 6°C to 26°C (Shin, Hidayat and Lee Citation2016). It has been posed that the temperature-dependent enhanced ∙OH formation is due to the more favorable solvent-cage effects during O3 decomposition initiation reactions (Shin, Hidayat and Lee Citation2016). As the temperature increases, the water has greater fluidity as a solvent and thus more free radicals can escape from the ozone-adduct decomposition cage (Shin, Hidayat and Lee Citation2016).
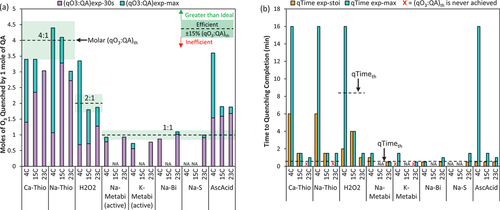
O3 quenching results demonstrated that temperature also affected efficiency and kinetics of reactions between O3 and QAs, . As the temperature increased, the ratio of O3 quenched immediately, i.e., (qO3:QA)exp-30s, increased for all QAs, but this trend did not hold for the cumulative O3 quenched over time, (qO3:QA)exp-max (). The (qO3:QA)exp-max appears to be consistent at either the two lower temperatures (e.g., Ca-Thio and Na-Thio) or the two higher temperatures (e.g., H2O2 and AscAcid), which may reflect different points of diminishing temperature effects for the different QAs. Surprisingly, with Ca-Thio, Na-Thio, H2O2, and AscAcid, more O3 was quenched over the full quenching time at 4°C than 23°C. This increase in (qO3:QA)exp-max at the lower temperature appears to be due to the extended reaction time (before O3 was fully depleted), with qTimeexp-max = 16 min at 4°C versus qTimemax = 1–1.5 min at 23°C ().
Figure 3. The effect of temperature on (a) molar quenching efficiency and (b) time to reach quenching stoichiometry (qTimeexp-stoi) and quenching completion (qTimeexp-max). All molar ratio results are given for the active compound (e.g., HSO3− not Na-Metabi or K-Metabi). Initial DO3 dose = 1.4–2.3 mg/L, the QAs were dosed at 13–81% stochiometric mass ratio when the DO3 residual was = 0.79–1.45 mg/L into Colorado River Water at pH 7.9. “NA” indicates that an experiment was not conducted for that QA at the corresponding water quality condition. An “Inefficient” QA was defined by (qO3:QA)exp-max at < 85% of the (qO3:QA)th, meaning 15% less O3 was quenched than expected (or even less), an “Efficient” QA was defined by (qO3:QA)exp-max within ± 15% of the (qO3:QA)th, and a “Greater than Ideal” QA is defined by (qO3:QA)exp-max > (qO3:QA)th by more than 15%. A “fast” QA was defined by qTimeexp-stoi ≤ 30 s, a “moderately fast” QA was defined by qTimeexp-stoi = 1 min, and a “slow” QA was defined by qTimeexp-stoi >1 min. The quenching reaction was considered “extended” if the reaction continued beyond 30 s. Note the black dashed lines in (b) represents the qTimeth.
Although Ca-Thio and Na-Thio never achieved (qO3:QA)th (±15%) at 23°C, they did at 4°C and 15°C (). Ca-Thio and Na-Thio were slow to react at all temperatures tested, but the speed of quenching did increase with temperature resulting in the qTimeexp-stoi decreasing from 6 min to 1.5 min at 4°C and 15°C, respectively. At 4°C, a small increase in (qO3:QA)exp was achieved between qTimeexp-stoi = 6 min and qTimeexp-max = 16 min, but this increase was not substantial for Ca-Thio (4%). For Na-Thio, there was a 30% increase in (qO3:QA)exp-max achieved between 6 min and 16 min, yet (qO3:QA)exp-max = (qO3:QA)th ±15%. While greater O3 was quenched and (qO3:QA)th was achieved, it is important to note that either a 6 or 16 min quenching time may not be realistic nor practical at full-scale.
At 4°C, Na-Metabi was unable to quench to (qO3:QA)th ±15% in 30 s, instead requiring a qTimeexp-stoi = 1.5 min; yet at 23°C, the qTimeexp-stoi was reduced to 30 s (). Whereas K-Metabi was inefficient at both temperatures and was the only QA that didn’t achieve (qO3:QA)th at any temperature, quenching 25% less O3 than expected (qO3:QAmax = 1.5:1, ). For both QAs, the (qO3:QA)exp-max was consistent at high and low temperatures; however, in both cases the kinetics were considered slow at 4°C (qTimeexp-stoi/max > 1 min) and fast at 23°C (qTimeexp-stoi/max <30s) (). The similar results between Na-Metabi and K-Metabi is consistent with their chemical similarities, with bisulfite as their active compound (HSO3−). Similarly, Na-Bi also has HSO3− as the active component. Na-Bi achieved (qO3:QA)th and was fast (qTimeexp-stoi < 30 s) at both 4°C and 23°C. Na-Bi had a slightly extended reaction time at 23°C (qTimeexp-max = 1 min) and achieved a slightly higher (qO3:QA)exp-max, though the difference was insignificant (<15%).
AscAcid was also a fast QA at all temperatures (qTimeexp-stoi < 30 s). AscAcid had a greater than ideal efficiency, achieving >115% (qO3:QA)th in ≤ 30 s (), and quenching was extended at all temperatures but with a decreasing trend in qTimeexp-max (). The greatest (qO3:QA)exp-max was achieved at 4°C, quenching 3.6× more O3 than predicted based on stoichiometry. Similarly, H2O2 quenched nearly two times (1.7×) more O3 than expected ((qO3:QA)exp-max = 3.4:1.0) at 4°C. Shin et al. observed decreasing ∙OH yield and subsequent exposure at colder temperatures (6°C vs. 26℃) and suggested NOM moieties are less reactive at lower temperatures (Shin, Hidayat and Lee Citation2016). At 4°C, the O3 decomposition via the hydroxyl radical chain reactions also slows (Staehelin and Hoigne Citation1982; Staehelin and Hoigne Citation1985). Considering this, the greater than ideal quenching efficiency observed for AscAcid and H2O2 may then be due to less reactions between O3 and ∙OH or QAs and NOM which allowed for extended reactions between O3, the QA, and their promotor-induced by-products (Gardoni, Vailati and Canziani Citation2012).
Note, other studies on O3 quenching evaluated the effect of temperature but did not distinguish changes in QA dosing requirements due to changes in O3 demand-decay versus quenching efficiency/kinetics. The (qO3:QA)exp-max values at all temperatures are provided in Supplemental Information Table S5 in molar units both as-parent compound and as-active compound.
Effect of pH
Results from the control tests (without QA) showed an accelerated decrease in O3 residual over time (O3 decay rate) as pH increased, with the half-life of O3 2× higher at pH 7.5 (1.9 min) than at pH 8.5 (0.93 min). These results are consistent with those from Abada et al. (Citation2024), where pilot tests with CRW at pH 7.5–7.8 and 26°C, gave the same O3 half-life of 1.9 min. As pH increases, O3 decay is accelerated due to the hydroxide-induced decomposition reactions and subsequent increase in ∙OH production (Elovitz, von Gunten and Kaiser Citation2000; Gardoni, Vailati and Canziani Citation2012; Staehelin and Hoigne Citation1982). Alkaline conditions also enhance the reactions between O3 and NOM due to deprotonation of the phenol and acid moieties (Elovitz, von Gunten and Kaiser Citation2000).
shows that the efficiency of most quenching reactions evaluated were also pH dependent. Ca-Thio and K-Metabi were the only two QAs that quenched < 85% (qO3:QA)th over the range of pHs evaluated, at 50–75% and 72–77% of the (qO3:QA)th, respectively. Ca-Thio did show some pH dependency where (qO3:QA)exp-max increased from 2:1 to 3:1 with a pH increase in CRW of 7.5 to 7.9, but remained at 3:1 for pH = 8.5. As mentioned in the temperature results section, Burns et al. also demonstrated the need to overdose Ca-Thio, similarly observing a (qO3:QA)exp-max = 2.4:1 (Burns et al. Citation2008). Similar to Ca-Thio, efficiency of quenching with Na-Thio displayed pH dependence but to a lesser extent with (qO3:QA)exp-max ranging from 3.0:1 to 3.8:1. Na-Thio quenched < 85% (qO3:QA)th at pH 7.5 and 7.9, but did quench to (qO3:QA)th at pH 8.5. Similarly, Bromley and Wert found that Ca-Thio and Na-Thio could be dosed at the stochiometric ratios but concluded a safety factor of 10–20% overdosing should be maintained (Bromley and Wert Citation2002). The lower quenching efficiency at lower pH could be attributed to the speciation of the active component, the thiosulfate ion (S2O32-). Takizawa, Okuwaki and Okabe (Citation1973) showed that under neutral pH, ~40% of the S2O32- is oxidized by O3 to sulfite (SO32-) which is further oxidized by O3 to sulfate (SO42-) but many by-products were also produced including tri- and tetrathionates (S3O62-, S4O62-) and hydrogen sulfide/sulfur dioxide (H2S/SO2 gas). Yet, in an alkaline solution, S2O32- is oxidized by O3 to sulfite SO32- which has a higher kO3 then thiosulfate. The sulfite SO32- is then fully oxidized to sulfate (SO42-), with none of the other previously mentioned byproducts (Takizawa, Okuwaki and Okabe Citation1973). The observed difference in O3 + S2O32- products highlights the effect pH has on the reaction chemistry and why quenching with thiosulfate-based QAs may be more efficient at higher pHs.
Figure 4. The effect of pH on (a) molar quenching efficiency and (b) time to reach quenching stoichiometry (qTimeexp-stoi) and quenching completion (qTimeexp-max). All molar ratio results are given for the active compound (e.g., HSO3− not Na-Metabi or K-Metabi). Initial DO3 dose = 1.3–1.9 mg/L, the QAs were dosed at 6–68% stochiometric mass ratio when the DO3 residual = 0.47–1.32 mg/L into Alfred Merritt Smith Water Treatment Facility raw water at 23°C. “NA” indicates that an experiment was not conducted for that QA at the corresponding water quality condition. An “Inefficient” QA was defined by (qO3:QA)exp-max at < 85% of the (qO3:QA)th, meaning 15% less O3 was quenched than expected (or even less), an “Efficient” QA was defined by (qO3:QA)exp-max within ± 15% of the (qO3:QA)th, and a “Greater than Ideal” QA is defined by (qO3:QA)exp-max > (qO3:QA)th by more than 15%. A “fast” QA was defined by qTimeexp-stoi ≤30s, a “moderately fast” QA was defined by qTimeexp-stoi = 1 min, and a “slow” QA was defined by qTimeexp-stoi >1 min. The quenching reaction was considered “extended” if the reaction continued beyond 30s. Note the black dashed lines in (b) represents the qTimeth, with the qTimeth for H2O2 above the scale for pH 7.9 at 8.5 min and pH 7.5 at 9.3 min.
Time to O3 quenching completion by Ca-Thio did not substantially change with pH, with qTimeexp-max being ≤ 30 s–1 min at all three pHs (); however, Na-Thio was slower to quench O3 with increasing pH, qTimeexp-max of ≤ 30 s at pH 7.5, 1.5 min at pH 7.9, and 3 min at pH 8.5 (). Bromley and Wert’s experiments also indicated that the Ca-Thio and Na-Thio quenching reactions were completed within 30 s, with the O3 decay rate returning to that of the control tests 30 s after quenching (Bromley and Wert Citation2002).
Efficiency of quenching by H2O2 and AscAcid had an apparent pH dependence, with (qO3:QA)exp-max increasing with pH (). These results demonstrate alkaline conditions as more favorable for O3-QA reactions with H2O2 and AscAcid, as well as the potential secondary reactions discussed previously. AscAcid quenched > 85% (qO3:QA)th within 30 s at all 3 pH conditions with qTimeexp-stoi ≤ 30s and qTimeexp-max ≤ 30 s–1 min. H2O2, however, required more time at pH 7.5 and 7.9 to reach (qO3:QA)th ±15% with a qTimeexp-stoi of 2 min at pH 7.5 and 1 min at pH 7.9 (). Additional time to reach quenching completion was also needed for H2O2 with qTimeexp-max = 4 min, 1.5 min, and 1 min at pH = 7.5, 7.9, and 8.5, respectively. The slower quenching kinetics of H2O2 have previously been reported4 (Bromley and Wert Citation2002) where O3 was quenched < 0.1 mg/L (with [O3]i = 0.3–0.8 mg/L) within 2 min at pH 7.5 and within 1–1.5 min at pH 8.5. The pH dependence of the O3-H2O2 reaction rate (kO3) is described by equation 5 (von Sonntag and von Gunten Citation2015).
The closer the pH gets to the H2O2 pKa = 11.8 (Sein et al. Citation2008), the greater the proportion of H2O2 is deprotonated and exists as the more O3 reactive HO2− species (von Sonntag and von Gunten Citation2015; Langlais, Reckhow, and Brink Citation2019). HO2− has a greater kO3 (9.6 × 10⁶ M−1s−1) (Sein et al. Citation2007) than H2O2 (<0.01 M−1s−1) (Gardoni, Vailati and Canziani Citation2012; Staehelin and Hoigne Citation1982; von Sonntag and von Gunten Citation2015; Langlais, Reckhow, and Brink Citation2019). The pattern observed in the experimental results for H2O2 are consistent with the patterns shown by the kinetic modeling, which utilized equation 5. Quenching was predicted to be fastest at pH 8.5 and slower at pHs 7.9 and 7.5; however, under all conditions the modeling predicted quenching to be >2–9× slower (at 52s, 8 min, and 9 min, respectively) than was observed in the experiments. This accelerated decrease in O3 residual is likely due to the secondary reactions between byproducts (e.g., •OH) and O3, as discussed in previous section.
AscAcid quenched more O3 than expected for all 3 pH conditions with (qO3:QA)exp-max increasing as pH increased (130% (qO3:QA)th at pH 7.5, 170% (qO3:QA)th at pH 7.9, and 220% (qO3:QA)th at pH 8.5, ). As described in the previous section, the reaction between O3 and AscAcid could produce >50 product compounds (e.g., DHA, DKG) through a series of reducing, hydrolyzing, and oxidizing reactions. These product compounds may be more reactive with O3 at higher pH (Chang et al. Citation2021) which could explain the increasing (qO3:QA)exp-max and how AscAcid quenched 2.2× greater O3 than the stoichiometric ratio at pH 8.5. The O3 quenching reactions by AscAcid occurred rapidly for all 3 pH conditions with qTimeexp-stoi ≤ 30 s and qTimeexp-max < 1 min (), somewhat consistent with the kinetic modeling which theorized the O3-AscAcid reaction to occur within 1 s.
Results showed that Na-S, Na-Bi, and Na-Metabi were efficient, quenching the expected amount of O3 ((qO3:QA)th ±15%) with qTimeexp-stoi ≤ 30 s; though when reactions continued past qTimeexp-stoi, both Na-S and Na-Bi quenched > (qO3:QA)th at pH 7.5 (). The (qO3:QA)exp-max for these three QAs was affected by the change in pH from 7.5 to 7.9, with less O3 quenched at the higher pH. Bisulfite (HSO3−) is a weak acid (pKa = 6.97), with the conjugate base of sulfite (SO32-); thus ultimately, the active component of Na-S, Na-Bi, Na-Metabi, and K-Metabi is mostly SO32- under the experimental pH conditions. SO32- is a more favorable species for O3 quenching than HSO3− with a kO3 ~3–4 orders of magnitude higher (Langlais, Reckhow, and Brink Citation2019). K-Metabi was the only sulfite-based QA that quenched less O3 than expected, (qO3:QA)exp-max was 26–31% lower than (qO3:QA)th at both pH 7.5 and pH 7.9.
Effect of diffuser on QA dispersion and downstream hydraulic mixing
Hydraulics, quenching chemical diffuser design, and diffuser location can affect QA mixing and dispersion and thus affect overall quenching efficacy in a system. Due to the non-ideality of full-scale flow through systems such as water treatment plants and specifically O3 contactors, heterogenous mixing and subsequent non-uniformity to the molecular level is expected (Crittenden et al. Citation2012). Residence time distribution (RTD) is an important concept when designing O3 quenching systems, as it reflects the various paths and characterizes variability of contact times the O3 and/or QA molecules have in the reactor (Crittenden et al. Citation2012). For many years, tracer testing and RTD analysis has been performed to characterize reactor ideality with single quantitative values e.g., T10 or T10/T (K. L. Rakness et al. Citation2005; USEPA Citation1991; USEPA Citation2010; USEPA Citation2020). Typical full-scale ozone contactors are in the average (T10/T = 0.5) to superior (T10/T = 0.7) baffling classifications, meaning there is going to be a level of mixing non-ideality (Bellamy Citation1995; Roustan et al. Citation1993; Teefy Citation1996). The development of computational fluid dynamic (CFD) analysis has allowed reactors to be designed and/or optimized without assuming uniformity and in some cases without tracer testing and providing a means of more fully and visually characterizing mixing (non-)ideality. CFD is the science of predicting fluid flow by solving the governing equations that represent the three fundamental principles of fluid flow: the conservation of mass, momentum, and energy. Under specified conditions, a CFD model simulates flow fields and particle transport within the model domain, solving the Reynolds-averaged, Navier-Stokes equations that describe the flux of mass and momentum within a fixed domain subject to specified boundary conditions. To illustrate the effect QA diffusion can have, a CFD analysis was performed for a full-scale O3 contactor with a Ca-Thio quenching system (Figure S6), comparing three Ca-Thio diffuser designs:
1” diameter stainless steel diffuser placed parallel but slightly above the top of the baffle on the upstream side, with twenty-two ¼-inch diameter orifices oriented parallel and counter-current to flow, spaced 2-feet on center. The diluted Ca-Thio stock flow rate was 17 gpm.
3” diameter stainless steel diffuser placed parallel but slightly above the top of the baffle on the upstream side, with forty-five ¼-inch diameter orifices oriented down, spaced 1-feet on center. The diluted Ca-Thio stock flow was 70 gpm.
Two 3” diameter stainless steel diffusers placed parallel to each other and slightly below the top of the baffle on the upstream side, with eighty-nine ¼-inch diameter orifices total, 44 orifices on one diffuser and 45 on the other, orifices oriented down, spaced 1-feet on center on each diffuser with orifices staggered from the other diffuser. The diluted Ca-Thio stock flow was 200 gpm.
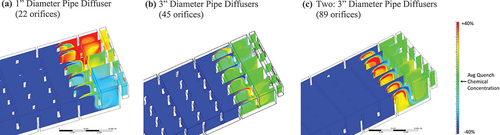
Results of the CFD analysis are given in . When the smaller 1” diameter pipe diffuser (22 orifices) was used, there was poor mixing performance with a maldistribution of Ca-Thio across the diffuser orifices being maintained to the end of the contactor (). There were substantial portions of ozonated water in the contactor and effluent gate that are less than 40% of the ideal Ca-Thio mass fraction (dark blue contours) and low in concentration (light blue contours) due to the poor dispersion and mixing with the 1” diffuser design. This means, if O3 residual was still present, there’s a risk that a portion of O3 would not have been quenched. show that the other two diffuser designs, with the larger 3” pipe and more orifices (45 and 89), produced relatively homogenous distribution at the Ca-Thio target concentration (green contours) at the effluent gate due to the increased velocity differential between the pipe and the orifices. The design with the single 3” diffuser pipe produced a more even distribution of Ca-Thio consistently and with less areas without Ca-Thio at the underbaffle between cells 11 and 12 than the double 3” diffuser pipe design. The improved performance of the single diffuser head may be due to the difference in location of the diffusers, i.e., slightly above the over baffle for the single diffuser vs. slightly below the over baffle for the double diffuser and suggest that more of the ozonated water was in contact with Ca-Thio for a longer contact time (not just at the effluent gate). Ultimately, within the level of accuracy of the model, there was no attributable difference in mixing performance between the single and double 3” diffuser designs for the relevant location, the outlet of Cell 12. The single 3” diffuser with 45 orifices was recommended for the quenching diffuser design at this full-scale plant because it required one less diffuser pipe and half the flow rate, thus lower pumping requirements. This diffuser design was also assessed under varying water flow scenarios, maximum, average, and minimum flow, to ensure that Ca-Thio was well mixed under the range of hydrodynamics that may be encountered. This QA mixing examination shows that the diffuser design and hydrodynamics are important, additional factors that should be considered when designing and/or troubleshooting an O3 quenching system. Further, these results demonstrate CFD analysis is a powerful tool that can provide insight into QA diffusion and mixing. Given the lack of existing guidance on QA diffuser design, mixing of QA may be a major contributor to O3 residual carryover in many full-scale systems. Analysis of QA diffusion, such as this CFD analysis, may identify this often-overlooked aspect of an O3 quenching system.
Figure 5. Computational fluid dynamic (CFD) analysis results showing the Ca-Thio distribution in an example ozone contactor that resulted from three diffuser designs: (a) 1” diameter pipe diffuser with orifices every 2 ft resulting in 22 orifices, (b) 3” diameter pipe diffuser with orifices every 1 ft resulting in 45 orifices, (c) two 3” diameter pipe diffusers with 44 orifices on one diffuser and 45 orifices on the other 1 ft apart and staggered resulting in 89 orifices. Colors represent Ca-Thio mass fraction of the total fluid mass. Green contours represent the ideal mass fraction (completely mixed), warmer colored contours represent higher than ideal mass fraction, and colder colored contours represent less than ideal mass fraction. The upper (bright red) and lower (dark blue) bounds of the color scale illustrate that the fluid is more than 40% or less than 40% of Ca-Thio ideal mass fraction, respectively. Ca-Thio injection at the under baffle between cells 11 and 12 is represented in the middle of each image and the Ca-Thio distribution at the two effluent gates leaving cell 12 and entering the combined effluent channel is represented on the right of each image. Figures were generated for SNWA by CDM Smith.
Practical implications
Mass ratio
Quenching efficiency results presented earlier, in pH and temperature sections, were used to calculate the mass of QA required to quench 1 mg of O3 during an up to 5 min contact time, shown in . The mass ratio can be used directly by practitioners and is a practical metric to compare dosing requirements for each QA under these various conditions. The mass results in are given for the parent compound, referring to the total mass of chemical required for practitioners. All experimental mass ratio dosing requirements, for each condition, represented in units both as parent and as active compounds, are compiled in the Supplemental Information Table S7 and S8. As discussed in previous sections, AscAcid, H2O2, Na-S, Na-Bi, and Na-Metabi were either efficient, quenching the stoichiometric ratio (qO3:QA)th ±15%, or quenched more O3 than predicted by stoichiometry under all tested conditions. Ca-Thio and Na-Thio quenched less O3 than predicted by stoichiometry for most conditions ().
Figure 6. The mass ratio requirements (qO3:QA)exp-5 min for each QA, assuming 5 minutes of quenching time is available, at various (a) temperature conditions and (b) pH conditions. All results are given in mass units as the parent compound (e.g., Na-Metabi not HSO3−). The QAs were dosed at 6–81% stochiometric mass ratio with an O3 dose = 1.3–2.3 mg/L into Alfred Merritt Smith Water Treatment Facility raw water. “NA” indicates that an experiment was not conducted for that QA at the corresponding water quality condition. An “Inefficient” QA was defined by (qO3:QA)exp-max at < 85% of the (qO3:QA)th, meaning 15% less O3 was quenched than expected (or even less), an “Efficient” QA was defined by (qO3:QA)exp-max within ± 15% of the (qO3:QA)th, and a “Greater than Ideal” QA is defined by (qO3:QA)exp-max > (qO3:QA)th by more than 15%. A “fast” QA was defined by qTimeexp-stoi ≤30s, a “moderately fast” QA was defined by qTimeexp-stoi = 1 min, and a “slow” QA was defined by qTimeexp-stoi >1 min. The quenching reaction was considered “extended” if the reaction continued beyond 30s.
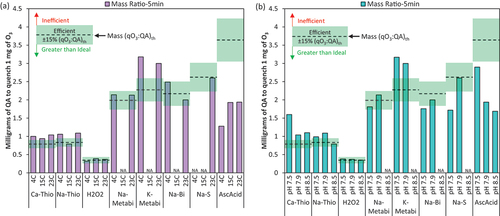
In practical considerations, however, a higher mass of AscAcid and the sulfite-based QAs are required to quench an equivalent mass of O3 when compared to Ca-Thio or Na-Thio, under most conditions. The higher mass requirements are due to the higher molecular weights of these QAs and lower (qO3:QA)th ratios. K-Metabi had the highest molecular weight and was the most inefficient QA, requiring 3–3.2 mg to quench 1 mg O3; which is 3 times higher than the Ca-Thio and Na-Thio dosing requirements. At ambient conditions, Na-Metabi and Na-Bi required the same mass ratio of 2 mg ± 15%, to quench 1 mg of O3; while Na-S required slightly more, 2.6 mg (), and again, all 3 of these QAs had 2–2.6× higher mass requirements than Ca-Thio or Na-Thio.
In terms of water quality effects, pH and water temperature did not have as apparent of an effect on mass requirements (5 min contact time) as observed with molar ratios. For the thiosulfate-based reagents, pH had the greatest effect with pH 7.5 requiring 60% greater Ca-Thio mass than pH 7.9 and 8.5 (). AscAcid requirements were the most affected by pH and temperature conditions. The mass requirement increased by 41% when temperature increased from 4°C to 15°C and 23°C, and the mass requirement decreased by ~50% when pH increased from 7.5 to pH 7.9. The trend with pH for Na-S and Na-Bi was opposite of this, with mass requirements increasing by ~60% for Na-S when pH was increased from pH 7.5 to 7.9.
AscAcid, despite its greater than ideal quenching efficiency at all conditions, has the second highest molecular weight of QAs evaluated, resulting in mass requirements comparable to Na-Metabi and Na-Bi at ambient conditions. The primary exception was when the water was colder (4℃); the mass requirement after 5 min for Ca-Thio, Na-Thio, H2O2, Na-Metabi, K-Metabi, and Na-Bi remained roughly unchanged yet the mass requirement for AscAcid decreased significantly to within 20% of the required mass for Ca-Thio and Na-Thio. Therefore, for utilities in consistently cold climates, AscAcid may be an advantageous choice due to its quenching efficiency and nontoxic nature.
Under all tested conditions, H2O2 had the lowest mass requirements overall, in the range of 0.32–0.39 mg of H2O2 to quench 1 mg of O3 (). For utilities with seasonal changes in water temperature or a fluctuating pH (±0.5 pH units), H2O2 demonstrated the most consistent quenching efficiency and lowest mass requirements.
Application benefits and barriers
The choice of QA will be determined by a number of factors relating both to quenching efficiency and water chemistry, as well as practical application concerns. As described in the introduction, handling (e.g., worker/storage safety), chemical form (i.e., liquid or powder, stock concentration), required storage and monitoring requirements, toxicity concerns, potential downstream effects, local or regional supply reliability, compliance requirements (e.g., NSF 60 certification), and operating cost will all be considered in a utility’s choice of QA. describes the chemical form (thus QA dose delivery), supply chain (defined by number of manufacturers), and hazard classifications (described by NFPA Codes) for each of the QAs evaluated in this study.
Table 4. Dosing (chemical form), supply chain (number of NSF 60 certified manufacturers worldwide and in US), and handling (represented by National Fire Protection Association (NFPA) classifications) considerations for each quenching agent.
Ca-Thio is a desirable QA due to its non-corrosive nature and chemical stability, meaning Ca-Thio storage does not require insulation, special transport/delivery, or accounting for off-gas concerns. It is safe for worker handling, and it also does not have environmental toxicity (Hardison Citation2000; Richey et al. Citation2000). Little information is available that details the handling and use of Na-Thio in bulk. It has a low molecular weight and is relatively stable and non-reactive, likely with similar requirements as Ca-Thio (Esseco USA Citation2013). The sulfite-based QAs require more handling related concerns and have greater mass ratio dosing requirements for quenching O3. Na-S and Na-Bi have stochiometric (qO3:QA)th molar ratios of 1:1, while Na-Metabi and K-Metabi have ratios of 2:1; therefore, they each require more chemical to achieve similar quenching as Ca-Thio and Na-Thio (4:1). Na-S is nontoxic and non-corrosive but has a high freezing temperature, and therefore requires special temperature control and storage design when used in colder climates. Na-Bi is corrosive, has a high freezing temperature, and is a dermal irritant requiring special handling (Richey et al. Citation2000). Richey et al. reported that Na-Bi released SO2 gas and required care in handling due to crystallization at temperatures < 60℉, which were all reasons Na-Bi was not selected as the QA for use at full-scale in the case study (Richey et al. Citation2000).
H2O2 is chemically reactive and will decay over time; thus, it needs to be delivered more frequently than required for other QAs (Richey et al. Citation2000). It has a low molecular weight and a 2:1 stoichiometric molar ratio, requiring the lowest mass concentration of any of the tested QAs. H2O2 also reacts with O3 to create hydroxyl radicals and superoxides (AOP) which have the added benefit of oxidizing taste and odor compounds and other recalcitrant chemicals of concern that are not O3 reactive (Coffey Citation2000; Richey et al. Citation2000).
AscAcid is a naturally produced (vitamin c), non-corrosive, biologically benign or even beneficial compound with high O3 and hydroxyl radical reaction rates (Peterka Citation1998). AscAcid has a high molecular weight, requiring the highest mass concentration, based on stoichiometry, of the tested QAs. Although at the tested conditions, AscAcid required similar if not less than the sulfite-based QAs. With few evaluations of AscAcid as an O3 QA, if any besides this study, there is a lack of example use cases particularly at higher application scales.
Compliance is an important consideration. In the US, it is required that all chemicals used in water treatment be NSF 60 certified for the approved application, in most cases. NSF certification is obtained by the supplier and thus for some chemicals there may be a limited number of suppliers. The number of manufacturers and ability to acquire these chemicals from multiple suppliers is paramount for redundancy and supply flexibility, which is particularly important for critical infrastructure such as water utilities. Chemicals with limited manufactures and distributors leave utilities, who rely on the chemical for operation, vulnerable to sudden changes in demand, supply chain disruption, and chemical price determinations/changes. Utilities likely would have no option but to pay inflated costs, reduce water production, or make drastic and sudden changes to ozonation or quenching processes in emergency situations. shows the number of NSF60 certified worldwide and U.S. manufacturers for each QA. Na-Bi and H2O2 have >50 manufactures worldwide and >35 in the U.S. due to their historical use in treatment and as O3 QAs. Ca-Thio has <10 suppliers in the world. CAPTOR® which is the patented Ca-Thio QA solution sold to water treatment plants, has only 2 manufactures in the U.S. Na-Thio and Na-S also only have 2 manufactures available, while AscAcid is limited to a single manufacturer. K-Metabi is the only QA tested that is a not an NSF60 certified chemical for drinking water application; therefore, its use is disallowed in the US until certification is obtained or if exceptions by regulating agencies are granted.
Conclusions
H2O2, which has the benefit of producing AOP conditions for taste and odor/micropollutant removal, has minimal handling concerns and the lowest mass requirements (e.g., 1 mg O3: 0.32–0.39 mg H2O2). H2O2 may be an ideal QA for utilities that experience seasonal water quality changes as it was the least variable, in terms of efficiency, with temperature and pH (e.g., only 8% difference in mass requirement at pH 7.5, 7.9, and 8.5).
Ca-Thio and Na-Thio demonstrated lower quenching efficiency compared to other QAs, yet still had lower mass requirements and less handling concerns.
The sulfite-based QAs overall were efficient but had higher mass requirements and more extensive handling and storage concerns compared to other QAs.
AscAcid had greater than ideal quenching efficiency and minimal handling concerns yet had high mass requirements. AscAcid may be a viable alternative QA and most beneficial in colder water temperatures where mass requirements (based on 5 min contact time) were comparatively low.
Temperature had significant effects on initial quenching efficiency (within 30 s), with less quenching initially occurring at 4°C compared to 23°C. With extended contact time, more cumulative O3 quenching occurred at 4°C compared to 23°C; which allowed Na-Thio, Ca-Thio, and Na-Metabi to achieve (qO3:QA)th ±15%. Extended contact time may not always be practical though and quenching speed vs. range of contact times expected should be considered.
At 4°C, AscAcid and H2O2 were able to achieve high quenching efficiency (>115% (qO3:QA)th) within 5 min, and if longer contact time is available, could achieve even greater quenching efficiency.
pH had less effects on quenching efficiency compared to temperature fluctuation, except with Na-S and Na-Bi, which had decreased quenching efficiency.
Hydrodynamics, including QA diffuser design, were shown as critical factors to consider in assessing quenching at full-scale. CFD analysis was demonstrated to be a powerful tool to enable this analysis.
Supply chain limitations should be considered when choosing a QA and was generally assessed by the number of NSF certified manufacturers. The alternative QAs AscAcid, Na-S, and K-Metabi had the least number of NSF certified manufacturers. Captor (Ca-Thio) and Na-Thio also had a very low number of US and Worldwide NSF certified manufacturers, compared to H2O2 and Na-Bi.
Supplemental Material
Download Zip (1.3 MB)Acknowledgments
We would like to acknowledge Emily Christensen and Gabriela Portillo-Chamul for their assistance in experimental preparation and sample collection. We would like to acknowledge CDM Smith for production of the CFD figures and review, including Chris Schulz, Ben Finnegan, and the CFD team led by Carrie Knatz, consisting of: Stephanie Mericka, Sri Pathapati, Sudheer Reddy, and Mark Allen.
Disclosure statement
No potential conflict of interest was reported by the author(s).
Supplementary material
Supplemental data for this article can be accessed online at https://doi.org/10.1080/01919512.2024.2366239.
References
- Abada, B., A. J. Atkinson, and E. C. Wert. 2024. “Quantifying Drought Driven Temperature Impacts on Ozone Disinfection Credit and Bromate Control.” Environmental Science: Water Research & Technology 10 (5): 1195–1207. https://doi.org/10.1039/D4EW00042K.
- APHA; AWWA; WEF. 1998. Standard Methods for the Examination of Water and Wastewater, edited by L. S. Clesceri, A. D. Eaton, and A. E. Greenberg. Washington, D.C: American Public Health Association, American Water Works Association, Water Environment Federation.
- Bedner, M., W. A. MacCrehan, and G. R. Helz. 2004. “Making Chlorine Greener: Investigation of Alternatives to Sulfite for Dechlorination.” Water Research 38 (10): 2505–2514. https://doi.org/10.1016/j.watres.2004.03.010.
- Bellamy, W. D. 1995. Full-Scale Ozone Contactor Study. Denver, CO: AWWA Research Foundation.
- Benjamin, M. M.; D. F. Lawler. 2013. Water Quality Engineering: Physical/Chemical Treatment Processes. Hoboken, New Jersey: John Wiley & Sons.
- Bouland, S., J. P. Duguet, and A. Montiel. 2004. “Minimizing Bromate Concentration by Controlling the Ozone Reaction Time in a Full-Scale Plant.” Ozone: Science & Engineering 26 (4): 381–388. https://doi.org/10.1080/01919510490482223.
- Bromley, C. and E. C. Wert. 2002. “A Comparison of Ozone Residual Quenching Chemicals.” International Ozone Association Pan American Group Annual Conference and Exposition, Raleigh, NC.
- Burns, N., J. Neemann, R. Hulsey, A. C. Fonseca, I. Singh, and R. Pante. 2008. “Synergistic Evaluation of Ozone and UV at the Coquitlam Source for Enhanced DBP Control and Cryptosporidium Inactivation.” Ozone: Science & Engineering 30 (1): 3–12. https://doi.org/10.1080/01919510701728285.
- Buxton, G. V., C. L. Greenstock, W. P. Helman, and Alberta B. Ross. 1988. “Critical Review of Rate Constants for Reactions of Hydrated Electrons, Hydrogen Atoms and Hydroxyl Radicals (⋅OH/⋅O− in Aqueous Solution.” Journal of Physical & Chemical Reference Data 17 (2): 513–886. https://doi.org/10.1063/1.555805.
- Cataldo, F. 2019. “Protection Mechanism of Rubbers from Ozone Attack.” Ozone: Science & Engineering 41 (4): 358–368. https://doi.org/10.1080/01919512.2018.1542518.
- Chang, Y.-P., S.-J. Wu, M.-S. Lin, C.-Y. Chiang, and G. G. Huang. 2021. “Ionic-Strength and PH Dependent Reactivities of Ascorbic Acid Toward Ozone in Aqueous Micro-Droplets Studied Using Aerosol Optical Tweezers.” Physical Chemistry Chemical Physics: PCCP 23 (16): 10108–10117. https://doi.org/10.1039/d0cp06493a.
- Coffey, B. 2000. Demonstration-Scale Evaluation of Ozone and Peroxone. Denver, CO: Water Research Foundation and American Water Works Association.
- Crittenden, J. C., R. R. Trussell, D. W. Hand, K. J. Howe, and G. Tchobanoglous. 2012. Water Treatment: Principles and Design. Hoboken, New Jersey: John Wiley & Sons.
- Deutsch, J. C. 1998. “Ascorbic Acid Oxidation by Hydrogen Peroxide.” Analytical Biochemistry 255 (1): 1–7. https://doi.org/10.1006/abio.1997.2293.
- Elovitz, M. S., U. von Gunten, and H.-P. Kaiser. 2000. “Hydroxyl Radical/Ozone Ratios During Ozonation Processes. II. The Effect of Temperature, PH, Alkalinity, and DOM Properties.” Ozone: Science & Engineering 22 (2): 123–150. https://doi.org/10.1080/01919510008547216.
- Esseco USA. 2013. “Safety Data Sheet - Sodium Thiosulfate.”
- Fischbacher, A., J. von Sonntag, C. von Sonntag, and T. C. Schmidt. 2013. “The •oh Radical Yield in the H2O2 + O3 (Peroxone) Reaction.” Environmental Science & Technology 47 (17): 9959–9964. https://doi.org/10.1021/es402305r.
- Gardoni, D., A. Vailati, and R. Canziani. 2012. “Decay of Ozone in Water: A Review.” Ozone: Science & Engineering 34 (4): 233–242. https://doi.org/10.1080/01919512.2012.686354.
- Hardison, R. 2000. A New and Better Dechlorination Process for Wastewater and Drinking Water Small Drinking Water and Wastewater Systems. Phoenix, AZ: NSF International.
- Hoigné, J., and H. Bader. 1994. “Characterization of Water Quality Criteria for Ozonation Processes. Part II: Lifetime of Added Ozone.” Ozone: Science & Engineering 16 (2): 121–134. https://doi.org/10.1080/01919519408552417.
- Hojjatie, M., and D. Abrams. 2006. Magnesium Thiosulfate As Ozone and Chlorine Quencher. US20060104876A1.
- Holbrook, D. D. 2005. Method for Treating a Work Material. US006974545B1.
- Jung, C. H., and W. W. Wells. 1998. “Spontaneous Conversion of L-Dehydroascorbic Acid to L-Ascorbic Acid and L-Erythroascorbic Acid.” Archives of Biochemistry and Biophysics 355 (1): 9–14. https://doi.org/10.1006/abbi.1998.0713.
- Kristiana, I., A. Lethorn, C. Joll, and A. Heitz. 2014. “To Add or Not to Add: The Use of Quenching Agents for the Analysis of Disinfection By-Products in Water Samples.” Water Research 59:90–98. https://doi.org/10.1016/j.watres.2014.04.006.
- Langlais, B., D. A. Reckhow, and D. R. Brink. 2019. Ozone in Water Treatment: Application and Engineering. New York, NY: Routledge.
- Lee, Y., D. Gerrity, M. Lee, A. E. Bogeat, E. Salhi, S. Gamage, R. A. Trenholm, E. C. Wert, S. A. Snyder, and U. von Gunten. 2013. “Prediction of Micropollutant Elimination During Ozonation of Municipal Wastewater Effluents: Use of Kinetic and Water Specific Information.” Environmental Science & Technology 47 (11): 5872–81. https://doi.org/10.1021/es400781r.
- MacCrehan, W. A., M. Bedner, and G. R. Helz. 2005. “Making Chlorine Greener: Performance of Alternative Dechlorination Agents in Wastewater.” Chemosphere 60 (3): 381–88. https://doi.org/10.1016/j.chemosphere.2004.11.075.
- Mazloum, S., S. Jasim, N. Biswas, K. Rakness, and G. Hunter. 2004. “Improvement and Optimization of the A. H. Weeks Water Treatment Plant Processes, Windsor, ON, Canada.” Ozone: Science & Engineering 26 (2): 125–40. https://doi.org/10.1080/01919510490439267.
- Merényi, G., J. Lind, S. Naumov, and C. von Sonntag. 2010. “Reaction of Ozone with Hydrogen Peroxide (Peroxone Process): A Revision of Current Mechanistic Concepts Based on Thermokinetic and Quantum-Chemical Considerations.” Environmental Science & Technology 44 (9): 3505–07. https://doi.org/10.1021/es100277d.
- Mitra, S., R. Johnston, K. Scott, R. Lin, F. Wyatt, B. Coffey, and K. Rakness. 2017. “Ozone Plant Operations Under Drought Conditions.” Ozone: Science & Engineering 39 (3): 202–08. https://doi.org/10.1080/01919512.2017.1289467.
- Muri, J. 2006. “Troubleshooting Approach and Results During Startup of MWRA’s John J.Carroll Water Treatment Plant.“ International Ozone Association Pan American Group Annual Conference and Exposition, Arlington, TX.
- Muri, J. 2008. “Good Process Control in Ozone Plants Starts with Proper Tuning.“ International Ozone Association Pan American Group Annual Conference and Exposition, Orlando, FL.
- Neemann, J., C. Michelle, J. Stockton, and R. Noelle. 2001. “Effect of Diurnal PH and Temperature Shifts on Ozone Demand and Taste-And-Odor Control.“ International Ozone Association Pan American Group Annual Conference and Exposition, Newport Beach, CA.
- Peterka, G. 1998. “Vitamin C-A Promising Dechlorination Reagent.” Opflow 24 (12): 1–5. https://doi.org/10.1002/j.1551-8701.1998.tb02153.x.
- Rakness, K. L. 2005. Ozone in Drinking Water Treatment: Process Design, Operation, and Optimization. Denver, CO: American Water Works Association.
- Rakness, K. L., I. Najm, M. Elovitz, D. Rexing, and S. Via. 2005. “Cryptosporidium Log-Inactivation with Ozone Using Effluent CT10, Geometric Mean CT10, Extended Integrated CT10 and Extended CSTR Calculations.” Ozone: Science & Engineering 27 (5): 335–50. https://doi.org/10.1080/01919510500250267.
- Rakness, K. L., E. C. Wert, M. Elovitz, and S. Mahoney. 2010. “Operator-Friendly Technique and Quality Control Considerations for Indigo Colorimetric Measurement of Ozone Residual.” Ozone: Science & Engineering 32 (1): 33–42. https://doi.org/10.1080/01919510903467864.
- Richey, D., E. Pollock, D. St. John, R. Hardison, and C. Thompson. 2000. “Improved Ozone Quenching with Calcium Thiosulfate.“ International Ozone Association Pan American Group Annual Conference and Exposition, Orlando, FL.
- Roustan, M., C. Beck, O. Wable, J. P. Duguet, and J. Mallevialle. 1993. “Modelling Hydraulics of Ozone Contactors.” Ozone: Science & Engineering 15 (3): 213–26. https://doi.org/10.1080/01919519308552485.
- Schulz, C. R. 2014. “Designing Integrated Ozone-Biofiltration Treatment Systems.” Ozone: Science & Engineering 36 (3): 276–86. https://doi.org/10.1080/01919512.2014.904741.
- Sein, M. M., A. Golloch, T. C. Schmidt, and C. von Sonntag. 2007. “No Marked Kinetic Isotope Effect in the Peroxone (H2O2/D2O2+O3) Reaction: Mechanistic Consequences.” ChemPhyschem 8 (14): 2065–67. https://doi.org/10.1002/cphc.200700493.
- Sein, M. M., M. Zedda, J. Tuerk, T. C. Schmidt, A. Golloch, and C. Von Sonntag. 2008. “Oxidation of Diclofenac with Ozone in Aqueous Solution.” Environmental Science & Technology 42 (17): 6656–62. https://doi.org/10.1021/es8008612.
- Shin, J., Z. R. Hidayat, and Y. Lee. 2016. “Influence of Seasonal Variation of Water Temperature and Dissolved Organic Matter on Ozone and OH Radical Reaction Kinetics During Ozonation of a Lake Water.” Ozone: Science & Engineering 38 (2): 100–14. https://doi.org/10.1080/01919512.2015.1079120.
- Soucie, B., B. Sheen, and R. Madura. 2001. “The Central Lake County Joint Action Water Agency Ozone Experience.“ The International Ozone Association Pan American Group Annual Conference and Exposition, Newport Beach, CA.
- Staehelin, J., and J. Hoigne. 1985. “Decomposition of Ozone in Water in the Presence of Organic Solutes Acting As Promoters and Inhibitors of Radical Chain Reactions.” Environmental Science & Technology 19 (12): 1206–13. https://doi.org/10.1021/es00142a012.
- Staehelin, Johannes., and Juerg. Hoigne. 1982. “Decomposition of Ozone in Water: Rate of Initiation by Hydroxide Ions and Hydrogen Peroxide.” Environmental Science & Technology 16 (10): 676–81. https://doi.org/10.1021/es00104a009.
- Takizawa, M., A. Okuwaki, and T. Okabe. 1973. “The Chemical Behavior of Low Valence Sulfur Compounds. VIII. The Oxidation of Sodium Thiosulfate with Ozone.” Bulletin of the Chemical Society of Japan 46 (12): 3785–89. https://doi.org/10.1246/bcsj.46.3785.
- Teefy, S. 1996. Tracer Studies in Water Treatment Facilities: A Protocol and Case Studies.
- USEPA. 1991. Guidance Manual for Compliance with the Filtration and Disinfection Requirements for Public Water Systems Using Surface Water Sources. Washington, D.C.
- USEPA. 2010. Long Term 2 Enhanced Surface Water Treatment Rule: Toolbox Guidance Manual.
- USEPA. 2020. Disinfection Profiling and Benchmarking Technical Guidance Manual.
- von Sonntag, C. 2008. “Advanced Oxidation Processes: Mechanistic Aspects.” Water Science & Technology 58 (5): 1015–21. https://doi.org/10.2166/wst.2008.467.
- von Sonntag, C., and U. von Gunten. 2015. “Chemistry of Ozone in Water and Wastewater Treatment: From Basic Principles to Applications.” https://doi.org/10.2166/9781780400839.
- Wert, E. C., S. Gonzales, M. M. Dong, and F. L. Rosario-Ortiz. 2011. “Evaluation of Enhanced Coagulation Pretreatment to Improve Ozone Oxidation Efficiency in Wastewater.” Water Research 45 (16): 5191–99. https://doi.org/10.1016/j.watres.2011.07.021.
- Wert, E. C., J. Lew, and, and K. Rakness. 2016. Effect of Ozone Dissolution Methods on Disinfection Credit, Bromate Formation, and Operating Cost. Water Research Foundation.
- Yin, X., K. Chen, H. Cheng, X. Chen, S. Feng, Y. Song, and L. Liang. 2022. “Chemical Stability of Ascorbic Acid Integrated into Commercial Products: A Review on Bioactivity and Delivery Technology.” Antioxidants (Basel) 11 (1): 1. https://doi.org/10.3390/antiox11010153.