
ABSTRACT
Lignin-based dye dispersants have aroused an increasing interest due to their environment-friendly properties. In this research, the quaternized lignin-based dye dispersant (QLD) was prepared using alkali lignin from masson pine sulfate pulping liquor as raw materials by chemical modification, that is, sulfonation and quaternization. The structure and performance characterization of alkali lignin and QLD were studied. The analyses indicated that the structural unit of alkali lignin contained more G type and S type. Additionally, it was also proved that QLD contained quaternary ammonium group, amine group, and sulfonic group, which could improve the dispersion performance and thermostability of QLD. The results of thermogravimetric (TG) concluded that the dispersion performance and thermostability of QLD prevailed over alkali lignin. Compared with the contact angle of water, alkali lignin, and QLD with dye, the contact angle of QLD was much better than water and alkali lignin, indicating that the hydrophilicity and dispersion performance of QLD were superior to water and alkali lignin in Vat Olive T.
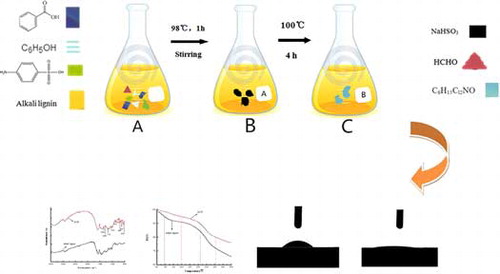
GRAPHICAL ABSTRACT
1. Introduction
The dyes and pigments have been widely applied in industries, including textile, rubber, paper, plastic, and leather.[Citation1Citation2] It was estimated that over 10,000 types of commercial dyes with annual productivity of 7 × 10⁵ t were consumed.[Citation3Citation4Citation5] As one of the most important assistants, dye dispersants play an important role in the dye quality and the dyeing process.[Citation6] Generally, dye dispersants can be mainly categorized as naphthalene dye dispersants, phenolic dye dispersants, and lignin-based dye dispersants. However, the preparation of naphthalene dye dispersants and phenolic dye dispersants suffers from practically tough problems of high cost and high energy consumption. Lignin-based dye dispersants are developed because of their unique properties, such as environmentally friendly benignity, low cost, high efficiency, and low energy consumption.[Citation7] In the recent years, most of the small and medium sized-paper mills are restricting development, because its pulping waste liquor can cause severe environment pollution.[Citation8,Citation9] Also, alkali lignin obtained from pulping waste liquor is a nontoxic and renewable polymer that can be modified and used as a dispersant in the textile industry.[Citation10] Specifically, it was estimated that more than 50 million tons of alkali lignin has been produced annually in the paper industry in China, while recycled alkali lignin accounts for only about 6 percent.[Citation11] The majority of alkali lignin produced is used as fuel and only few parts are used for higher value-added applications.[Citation12,Citation13] Therefore, their higher value-added applications are considered to be urgent, attracting increasing worldwide concerns.
In addition, with the rapid advance in information technology, textile printing and dyeing industry developed immediately. As auxiliaries, dye dispersants are required highly on the quality and performance in textile dyeing and printing industry, such as good dispersion performance and thermostability. The molecular structure of alkali lignin lacks some hydrophilic groups and high temperature-resistant groups.[Citation14,Citation15] Alkali lignin used as a dye dispersant directly could not meet the requirements of the textile printing and dyeing industry. Therefore, it is necessary to modify alkali lignin used as dye dispersant by chemical methods.[Citation16] Recently, our groups have reported that alkali lignin obtained from pulping waste liquor has been used to prepare lignin adsorbent,[Citation17Citation18Citation19] lignin-based flocculant,[Citation20,Citation21] water-reducing agent,[Citation22] and dye dispersant,[Citation23] thus increasing research interest on the recycle and higher value-added applications of alkali lignin.
In order to further extend the high value-added applications of alkali lignin, the quaternized lignin-based dye dispersant (QLD) was prepared using alkali lignin from masson pine sulfate pulping liquor as raw materials by chemical modification, that is, sulfonation and quaternization. In this study, the structure and performance characterization of the products were comprehensively investigated. The preparation could promote the popularization and application of modified lignin-based dye dispersant, and thus will increase its additional value.
2. Experimental section
2.1. Material
Sulfuric acid, amino benzene sulfonic acid, benzoicacid, formaldehyde (37.0% solid), sodium bisulfite, phenol, and 1-chloro-2-hydroxypropyl trimethyl ammonium chloride were of analytical grade. The masson pine sulfate pulping liquor was obtained from Fujian Nanzhi Limited by Share Ltd. Distilled water was used throughout the experiment.
2.2. Extraction of alkali lignin
Masson pine sulfate pulping liquor with pH value of 13.6 and 45% solid content as source of lignin was diluted to 10% solid content of alkali lignin by adding the distilled water. In addition, 20% sulfuric acid was added to the diluted alkali lignin solution to adjust the pH value to 3. Afterward, the treated lignin solution was heated at 50°C for 1 h and filtered by vacuum pumping press filter. The resulting solid was alkali lignin. The solid content of alkali lignin was determined according to ASTM D 4426. Alkali lignin was prepared with 45% solid content as experimental material by gravimetric method for further use.
2.3. Preparation of aminomethylation lignin-based dye dispersant
Alkali lignin solution (246 g, 45% solid) was put into three 500 mL flasks, and amino benzene sulfonic acid was slowly added to keep the pH of the solution at a certain value, which was facilitated by stirring and a certain oil bath temperature. A total of 10.2 g by mass of benzoic acid and phenol were added with a certain temperature and stirring for 15 to 20 min. The temperature was heated to 98°C, and then formaldehyde (37.0% solid) was added. An hour later, sodium bisulfite was slowly added and the alkali lignin solution was continuously stirred at 100°C for 4 h. 1-Chloro-2-hydroxypropyl trimethyl ammonium chloride was added and then the mixture was stirred at 100°C for 1.5 h until the system reacted completely. The QLD was collected together from three flasks and dried by spray dryer for further use.
2.4. Characterization
The Fourier transform infrared spectra (FTIR) of alkali lignin and QLD were carried out on AVAT-AR360 Fourier transform infrared spectrometer (Thermo Nicolet Corporation, America). The structures were identified by AVANCE III 500 13C-NMR (Bruker Corporation, Switzerland) and ESCALAB 250 XI X-ray photoelectron spectroscopy (Thermo Fisher Scientific, America). A MiniFlex 600 wide-angle X-ray analysis (Rigaku Corporation, Japan) was carried out in order to investigate any change in the structure of alkali lignin. The molecular weight and molecular weight distribution of alkali lignin and QLD were determined by 1100 Gel permeation chromatograph (Agilent Technologies Co. Ltd., America). Direct determination of element in alkali lignin and QLD by EL cube Elemental analyzer (Elementar Corporation, Germany). The thermostability of alkali lignin and QLD were observed by STA449C thermogravimetric analyzer (NETZSCH Corporation, Germany). Alkali lignin and QLD with dyes contact angles were investigated by SL2000B Contact Angle meter (Shanghai Duolun Automation Technology Co. Ltd., China).
3. Results and discussion
3.1. FTIR spectroscopy
shows the FTIR spectra of alkali lignin and QLD. The peak assignment of FTIR spectra of alkali lignin is summarized in . Comparison between the FTIR spectra of alkali lignin and QLD shows that few main peaks varied when alkali lignin was modified. In the QLD, all spectra are dominated by signals at 1040 cm−1, 942 cm−1, and 623 cm−1 due to stretching vibrations of –SO3. This would mean that sulfonic acid group has been successfully introduced into alkali lignin and can improve the dispersion performance and the hydrophilicity of QLD. The peaks of 767 cm−1 and 695 cm−1 are assigned to replacing aromatic functional group bending vibration. The peak at 1,360 cm−1could be attributed to the stretching vibration of C‒N in the amine group, which illustrates that the amine group is introduced into alkali lignin and can improve the dispersion performance of QLD. It must be noted that the 1299 cm−1 band is related to C‒N in the quaternary ammonium group. This would be described that quaternary ammonium group has been successfully introduced into the alkali lignin, which can improve the thermostability of QLD. A band at 1148 cm−1 that is assigned to C‒O‒C stretching vibration in phenol ether is observed. The stretching band at 530 cm−1 is due to N‒H stretching vibration in primary amine.
Figure 1. FTIR spectra of alkali lignin and QLD.
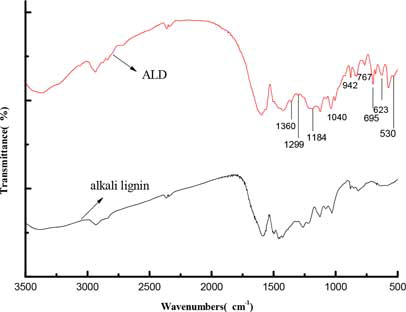
Table 1. Absorption band and assignment of FTIR spectra of alkali lignin.
3.2. 13C-NMR spectroscopy
13C-NMR spectra obtained for alkali lignin and QLD are illustrated in and . After attribution of different peaks, the chemical shift and assignment of alkali lignin and QLD are listed in and . It is evident that the methoxy signals in the range 51.2∼58.4 ppm reflect more structural unit of G type and S type in the structure of alkali lignin. The signals in the region 175.2∼188.1 ppm correspond to phenol hydroxyl mating aromatic, indicating more phenolic hydroxyl group in the structure of alkali lignin. Comparison of the spectra of alkali lignin and QLD shows that the signal at 70.9 ppm originates most probably from carbons of C–Cl and the quaternary ammonium group has been successfully introduced into the structure of the alkali lignin as is also reflected by FTIR, which can improve the thermostability of QLD. Signals in the range 34.5∼41.2 ppm most conceivable from carbons of amine group can identify amine group has been introduced into the structure of alkali lignin after chemical modification, and the amine group can improve the dispersion performance of QLD. In addition, the increase obviously in the region between 115.8∼137.5 ppm and 175.4∼188.1 ppm conforms to carbons of aromatic and phenol hydroxyl mating aromatic, respectively. Then, the changes described in the quantity of aromatic group and phenol hydroxyl group in the structure of chemically modified alkali lignin and the binding site of chemical modification are increased.
Figure 2. 13C-NMR spectra of alkali lignin.
Figure 3. 13C-NMR spectra of QLD.
Table 2. Chemical shift and assignment of alkali lignin.
Table 3. Chemical shift and assignment of QLD.
3.3. Elemental analysis
Element contents of alkali lignin and QLD are listed in . The elemental analysis results of alkali lignin can probably obtain the molecular formula: C9H0.891O6.777N0.045S0.164; and show that a higher proportion of alkali lignin in C and H, illustrating that the structure of alkali lignin contains more of the benzene ring. O in the alkali lignin is 37.71%, which implies that the quantities of methoxyl group, hydroxyl, and ether bond are great in the structure of alkali lignin. The elemental analysis results of alkali lignin and QLD show that the composition of QLD is C, 35.94%; H, 4.10%; N, 0.49%; S, 6.01%; O, 41.42%, and it can be seen that while alkali lignin was being chemically modified by sulfonation and quaternization, the content of S and N in QLD is obviously increased, indicating that amine group, quaternary ammonium group, and sulfonic acid group have been successfully introduced into the structure of the alkali lignin, which can improve the dispersion performance, the hydrophilicity, and the thermostability of QLD.
Table 4. Element contents of alkali lignin and QLD.
3.4. X-ray photoelectron spectroscopy analysis
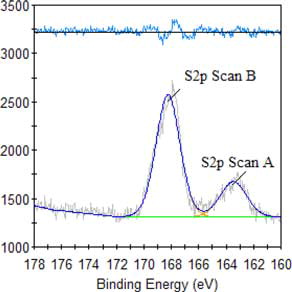
The result of high-resolution spectra analysis of alkali lignin, as shown in and , reveal that the peak at 400 eV becomes stronger, demonstrating heightened changes in the relative content of N, proving once again that an amine group is introduced and can improve the dispersion performance of QLD. The observed new peak at 403 eV is assigned to N element in quaternary ammonium group, illustrating that the quaternary ammonium group is introduced into alkali lignin and can improve the thermostability of QLD. The high-resolution spectra analyses are carried out for QLD as shown in , the presence of sharp peaks at about 163 eV and 168 eV are assigned to S2p, which is a new characteristic peak of chemically modified alkali lignin and describes the introduction of S element in QLD, indicating that the sulfonic acid group is successfully introduced into the structure of alkali lignin and can improve the dispersion performance and the hydrophilicity of QLD.
Figure 4. N1s XPS spectra of alkali lignin.
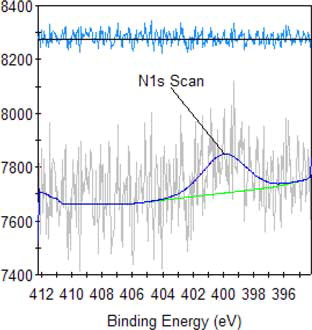
Figure 5. N1s XPS spectra of QLD.
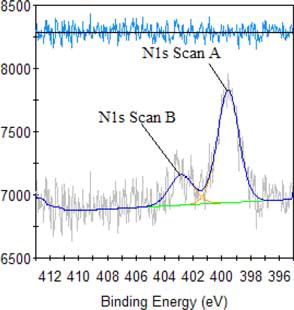
Figure 6. S2p XPS spectra of QLD.
3.5. X-ray diffraction spectroscopy analysis
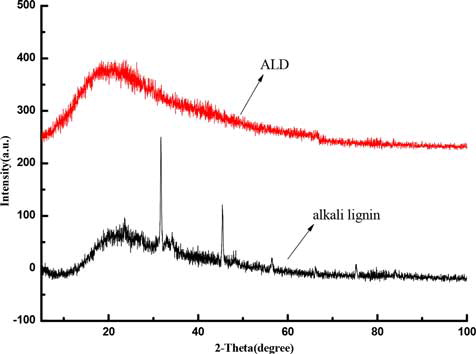
The crystalline phases of alkali lignin and QLD are evaluated by X-ray diffraction as shown in , the presence of diffraction peaks at about 2θ = 31.6° and 45.4° are disappeared after chemical modification of alkali lignin, which can be indexed to the crystal shape of alkali lignin has changed. In terms of space dimension, chemical reagents from the crystal surface to the interior of alkali lignin, changing its structure, indicating that chemical modification of alkali lignin has been successfully carried out.
Figure 7. XRD spectra of alkali lignin and QLD.
3.6. Thermogravimetric analysis
shows the thermogravimetric curve of alkali lignin and QLD, and the thermogravimetric data are listed in . It is clear that the 5% mass loss of alkali lignin when the temperature is 95°C, the 5% mass loss of QLD when the temperature is 196°C, which is probably due to the evaporation of the solvent from products.[Citation24] When the temperature reaches 314°C, the mass loss of alkali lignin is 20%; when the temperature reaches 406°C, the mass loss of QLD is 20%. Depending on the type of decomposition mechanism, the resulting degradation products may include alcohols, amines, olefins, carbon dioxide, and fatty acid chain scission.[Citation25Citation26Citation27Citation28] The temperature at the maximum degradation rate of the alkali lignin is 267°C, while the temperature of the maximum degradation rate of QLD is 300°C. Comparing alkali lignin with QLD shows that the thermostability of QLD prevailed over alkali lignin. This is most probably attributed to functional groups are successfully introduced into the structure of alkali lignin and the thermostability of QLD also improved in dyeing process.
Figure 8. TG curve of alkali lignin and QLD.
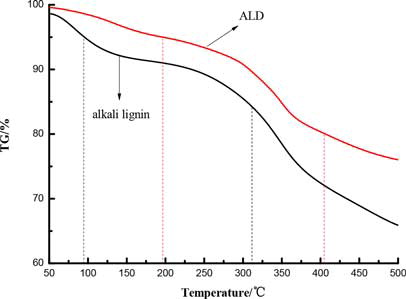
Table 5. Thermal property parameters of alkali lignin and QLD.
3.7. Gel penetration chromatographic analysis
The distribution of alkali lignin and QLD considering their molecular weights was obtained by using gel penetration chromatograph. The results are depicted in . Various molecular weight numbers are calculated from the experiment data. The mass average (Mw) and the number average (Mn) of the molecular weight of alkali lignin and QLD are shown in . The Mw of QLD is 75% larger than that of alkali lignin, and the Mn of alkali lignin is 78% smaller than that of QLD. This can be proved that the molecular weight of QLD is much larger than the molecular weight of the alkali lignin. Furthermore, the ratio of Mw and Mn is presented as dispersion (D), which is a measure of homogeneity of the fragments. D is smaller that of polymer molecular weight distribution is narrow, and its structure contains fewer small molecules; D is bigger that of polymer molecular weight distribution is wide, and its structure contains more small molecules. From the D values of alkali lignin and QLD, it can be concluded that QLD consists mainly of large molecules. Additionally, it also indicated that the functional group was introduced into the chemically modified alkali lignin.
Figure 9. GPC curve of alkali lignin.
Figure 10. Molecular weight distribution diagram of alkali lignin.
Figure 11. GPC curve of alkali lignin.
Figure 12. Molecular weight distribution diagram of QLD.
Table 6. Molecular weight distribution data of alkali lignin and QLD.
3.8. Contact angle analysis
shows the water, alkali lignin, and QLD drop on Vat Olive T dye and the imaged area. shows contact angle values obtained from the water, alkali lignin, and QLD drop on Vat Olive T dye. As seen in , the contact angle of water drops on Vat Olive T dye is 47.36°, the contact angle of alkali lignin drops on Vat Olive T dye is 28.75°, and then it increased to 10.30°, when alkali lignin was reacted by chemical modification. Hydrophilic groups such as amine group and sulfonic acid group on alkali lignin structure can make wetting and support for Vat Olive T dye better and improve the dispersion performance.
Figure 13. Contact angles of water (a), alkali lignin (b), and QLD (c) with dye.
Table 7. Contact angles of water (a), alkali lignin (b), and QLD (c) with dye.
4. Conclusions
The aim of this study was to prepare the QLD, which was using alkali lignin from masson pine sulfate pulping liquor as raw materials by chemical modification, that is, sulfonation and quaternization. The structure and performance characterization of the products were also studied. In summary, the following conclusions could be drawn from the aforementioned results:
FTIR, 13C-NMR, EA, XPS, GPC, and XRD analyses of alkali lignin and QLD showed that the structural unit of alkali lignin contained more G type and S type, Additionally, it was also proved that QLD contained quaternary ammonium group, amine group, and sulfonic group, which could improve the dispersion performance and thermostability of QLD.
According to TG curve, the thermostability of QLD ultimately prevail over alkali lignin. This is most probably attributed to the amine group and quaternary ammonium group are successfully introduced into the structure of alkali lignin.
Contact angle analysis indicated that the contact angle of QLD was much better than water and alkali lignin. And hydrophilic groups such as amine group and sulfonic acid group on alkali lignin structure could make wetting and support for Vat Olive T dye better and improve the dispersion performance.
References
- Koh, J., Kim, J.D., and Kim, J.P. (2003) Dyes Pigm., 56: 17–26.
- Dotto, G.L., Santos, J.M.N., Rodrigues, I.L., et al. (2015) J. Colloid Interface Sci., 446: 133–140.
- Yu, S., Chen, Z., Cheng, Q., et al. (2012) Sep. Purif. Technol., 88: 121–129.
- Wei, X., Kong, X., Sun, C, et al. (2013) Chem. Eng. J., 223: 172–182.
- Lin, J., Ye, W., Zeng, H., et al. (2015) J. Membr. Sci., 477: 183–193.
- Habibi, M.H. and Nasr-Esfahani, M. (2007) Dyes Pigm., 75: 714–722.
- Dilling, P. and Huguenin, S.B. (1999) U.S. Patent 5,980,589, 9–11.
- Ren, X. (1998) J. Cleaner Prod., 6: 349–355.
- Liu, J. and Diamond, J. (2005) Nature, 435: 1179–1186.
- Qin, Y., Yang, D., and Qiu, X. (2015) ACS Sustainable Chem. Eng., 3: 3239–3244.
- Vishtal, A.G. and Kraslawski, A. (2011) BioResources, 6: 3547–3568.
- Lora, J., Naceur, B.M., and Gandini, A. (2008) Industrial Commercial Lignins: Sources, Properties and Applications. Amsterdam: Elsevier.
- Mwaikambo, L.Y. and Ansell, M.P. (2002) J. Appl. Polym. Sci., 84: 2222–2234.
- Younesi-Kordkheili, H., Kazemi-Najafi, S., Eshkiki, R.B., et al. (2015) Eur. J. Wood Wood Prod., 73: 77–85.
- Lu, J.Z., Wu, Q., and McNabb, H.S. (2007) Wood Fiber Sci., 32: 88–104.
- Ouyang, X., Ke, L., Qiu, X., et al. (2009) J. Dispersion Sci. Technol., 30: 1–6.
- Guo-Fen Chen and Ming-Hua Liu. (2012) BioResources, 7: 298–314.
- Liu Minghua and Deng Yun. (2006) Am. Lab., 18: 20–22.
- Liu Minghua, Huang Jianhui, and Deng Yun. (2006) J. Appl. Polym. Sci., 101: 2284–2291.
- Liu Qianjun, Liu Minghua, Zhan Huaiyu, et al. (2005) Acta Scientiarum Natralium Universitatis Sunyatseni, 44: 22–25.
- Yue Baozhen, Zhan Huaiyu, Liu Qianjun, et al. (2005) Appita Conference Sessions, 445–449.
- Zhang, Y.Q., Liu, Z.P., and Liu, M.H. (2012) J. Petrochem. Univ., 25: 1–5.
- Huang, P.P., Liu, M.H., and Guo, J. (2011) J. Fuzhou Univ. (Nat. Sci. Edn.), 39: 792–796.
- Hajdok, I., Bona, A., Werner, H.J., et al. (2014) Eur. Polym. J., 52: 76–87.
- Lu, Y. and Larock, R.C. (2008) Biomacromolecules, 9: 3332–3340.
- Petrović, Z.S., Yang, L., Zlatanić, A., et al. (2007) J. Appl. Polym. Sci., 105 (5): 2717–2727.
- Lligadas, G., Ronda, J.C., Galià, M., et al. (2006) Biomacromolecules, 7: 3521–3526.
- Javni, I., Petrović, Z.S., Guo, A., et al. (2000) J. Appl. Polym. Sci., 77: 1723–1734.