
 ?Mathematical formulae have been encoded as MathML and are displayed in this HTML version using MathJax in order to improve their display. Uncheck the box to turn MathJax off. This feature requires Javascript. Click on a formula to zoom.
Abstract
We demonstrate that the wettability of cosmetic grade, silica-coated titanium dioxide nanoparticles may be tuned by simply soaking them in a cyclic silicone oil. This allows for tuning the type of emulsion that they stabilize, from oil-in-water to water-in-oil. By analyzing the sedimentation of water-in-oil emulsions, the effect of the soaking time (wettability) on drop size and drop-drop interactions was investigated. From centrifugation experiments performed up to emulsion breakage, we obtain an effective water-oil interfacial tension for the particle-loaded interfaces, which indicate lateral particle-particle interactions. Finally, we demonstrate that the proposed particle functionalization is terminated upon addition of water followed by emulsification. In addition, it is irreversible and can be accelerated through heating.GRAPHICAL ABSTRACT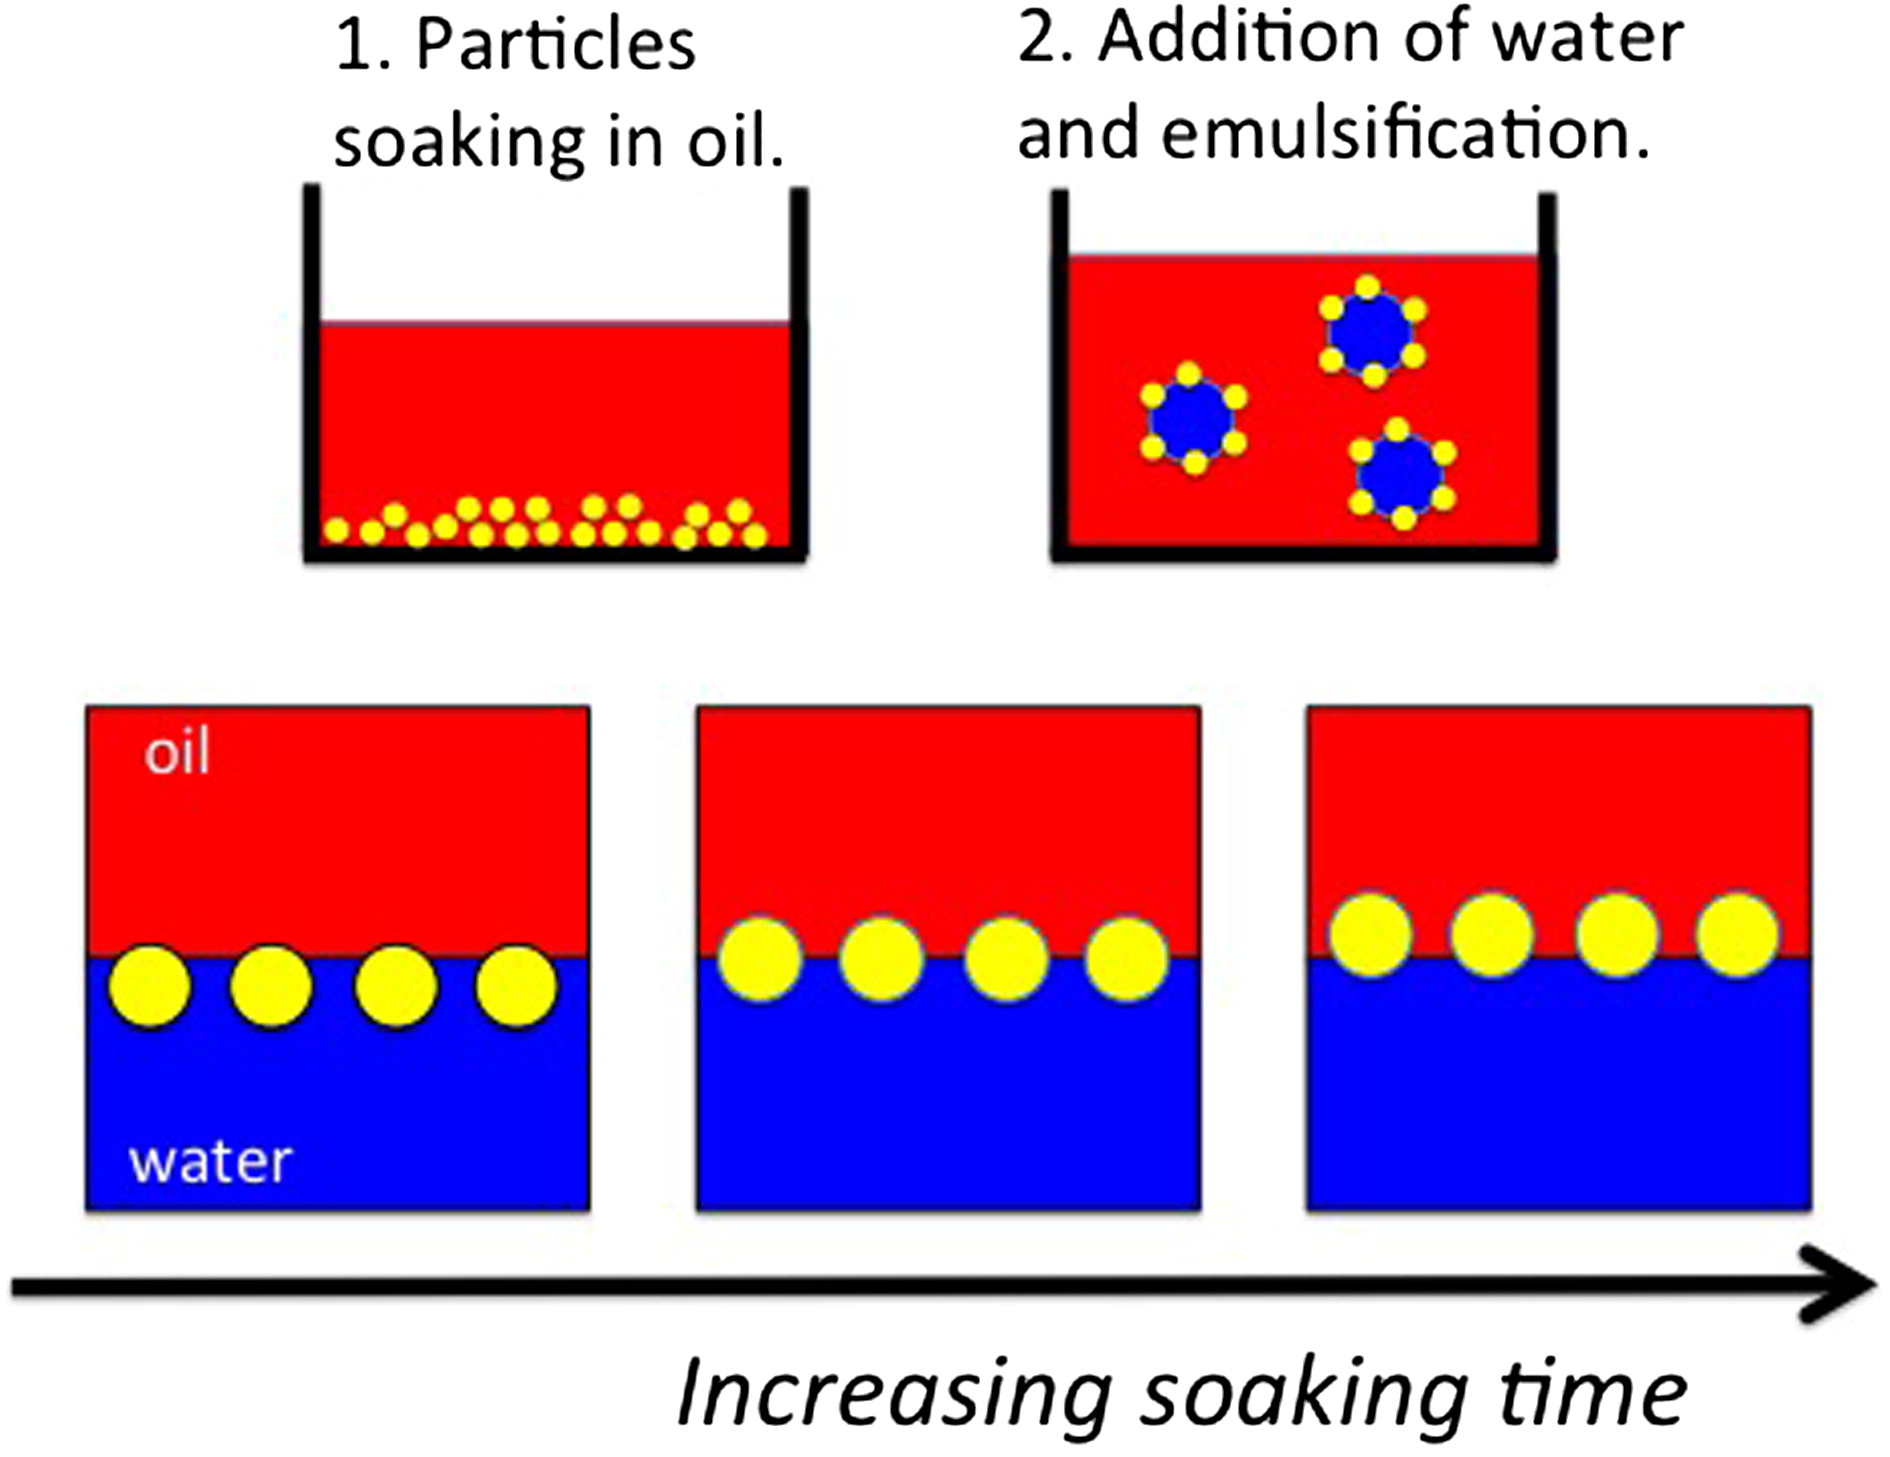
1. Introduction
In solid-stabilized emulsions, commonly known as Pickering emulsions, solid particles are used as stabilizers instead of surface-active compounds such as surfactants or amphiphilic polymers.[Citation1,Citation2] In this kind of emulsion, particles are irreversibly anchored at the oil-water interface forming a mechanical barrier against coalescence of liquid droplets.[Citation3] There is increasing interest in Pickering emulsions among the industrial fields,[Citation4,Citation5] such as cosmetics, pharmaceutics and food industry, since solid-stabilized emulsion system enables avoiding the use of surfactants, or at least, reducing their concentration in a large extend. Such a will is guided by the fact that, using surfactant, sometimes raises concerns about negative effects on human skin or on the environment.
In solid-stabilized emulsions, the type of emulsion formed, oil-in-water (O/W) or water-in-oil (W/O) depends on different factors. Finkle et al.[Citation6] reported that the type of emulsion depends on the wettability of particles. It has also been reported that the preparation process could influence the emulsion type.[Citation7] In addition, emulsion composition, that is to say component ratio, such as water to oil ratio,[Citation8,Citation9] particle concentration[Citation7,Citation10] and hydrophilic to hydrophobic particles ratio[Citation11] has also been reported as determining factors. Physical and chemical properties of the components such as particles size[Citation12] and shape,[Citation13] oil polarity[Citation14,Citation15] and oil viscosity,[Citation16] pH value and presence of electrolyte[Citation17,Citation18] in the aqueous phase also affect emulsion type and stability.[Citation19] Among all these parameters, the particle wettability, corresponding to the relative hydrophobicity/hydrophilicity, seems however to be the most important one.[Citation20]
Silica particles are known to be hydrophilic due to the presence of silanol groups at the particle surface. In order to confer them the ability to adsorb at an oil/water interface, they need to be partly hydrophobized. The most widespread way of functionalizing silica particles or wafers is to graft, using a coupling agent, some hydrophobic moieties at their surface as for example silane groups,[Citation21,Citation22] amine or vinyl groups[Citation23] or even complex structures.[Citation24] Moreover, in the field of reinforcement, hydrophilicity of silica particles was undesirable as it was known to induce particle agglomeration in organic solvent as the ones often present in paints or varnishes.[Citation22] Numerous efforts have therefore been dedicated to silica surface modification in order to increase the particle hydrophobicity for various applications. Indeed, silica particles are often used as fillers into polymeric matrices and their surface hydrophobization modifies significantly their dispersion state[Citation25] and consequently the rheological properties of the material.[Citation26] Functionalized silica particles were also used to produce superhydrophobic and/or oleophobic cotton textiles.[Citation27] In many applications, silica particles were dispersed in polydimethylsiloxane (PDMS) solutions or melts. It has been observed that the dispersion state may evolve with time due to silica surface evolution.[Citation26] This has open the route to the study of interaction between silica particles and PDMS chains.[Citation22,Citation25,Citation28,Citation29] It has then been proposed that PDMS chains adsorb at the silica surface[Citation25] and covalently bind.[Citation26] Adhesion enhancement between a PDMS elastomer and a flat silica surface, end-grafted with PDMS chains, has been evidenced when adsorption of PDMS chains occurred additionally to grafting.[Citation28] Association of silica particles and PDMS has also been proven to highly enhance antifoaming efficiency as compared to each component alone.[Citation30,Citation31] In their paper, Marinova et al.[Citation31] proposed a progressive hydrophobization of silica particles at room temperature and showed the existence of a maximum efficiency in antifoaming that depended on the used surfactant. During the silica-PDMS compound preparation, process parameters, such as heating and stirring, accelerated hydrophobization.[Citation32] A more complete and systematic study of the phenomenon, with model ca 500 µm-sized glass beads, led the authors to conclude about the mechanism, the amount of hydrophobized surface, the role played by the surfactant and the effect of the treatment process.[Citation33] From the results of measuring contact angles, the authors showed that hydrophobization occured as a two-step process for initially hydrophilic beads. The first and relatively fast step, occurring on the timescale of minutes, and leading to a contact angle of circa 90°, corresponded to a dense physisorption by the formation of hydrogen bonds between the oxygen atoms of the polymer backbone and the silanol groups on the solid surface. The second slow step, having a characteristic time of several hours, allowed reaching final contact angles of 150-160°. During this second step, chemical bonds formed between terminal OH groups of PDMS and the solid surface silanol groups.
Titania particles have a high potential for many applications with their unique properties such as photo catalytic activity, broad UV-absorption spectrum, high refractive index and positively charged surface. Most of all, there is a high expectation of technical application to sunscreen products since the demand for them has increased rapidly around the world as the harmful effect of UV radiation on human skin has been revealed. Indeed Titanium dioxide exhibits a large absorption spectrum (240–330 nm) covering the entire range of UV-B wavelengths.[Citation34] When titania particles are used as a UV protect agent in cosmetic products, they are usually nano-sized and coated with inorganic materials, such as silica and alumina, and/or with organic materials, such as stearic acid and methicone, for purposes of surface inactivation, controlling the surface charge and improving dispersability. Besides, volatile silicone oil of low molecule weight is often used as an oil phase for sunscreen products to avoid unctuous texture and to achieve long lasting quality.
In a recent paper,[Citation35] Binks and Yin demonstrated that inherently hydrophilic silica particles could be hydrophobized in situ, by dialkyl adipate oils solubilized in the aqueous phase, allowing for the formation of water-in-oil Pickering emulsions. They hypothesized that the adipate oil molecules were binding to silica surface through hydrogen bonding between the ester carbonyl group of the oil and silanol groups on the particle surface.
In situ hydrophobization opens up interesting possibilities for Pickering emulsion technologies, and in this paper we elaborate further on this topic. Using silica coated titania particles in water and PDMS, we demonstrate a simple protocol on how to tune the particle hydrophobicity and hence the contact angle and the stability of the particle loaded interfacial film.
2. Experimental section
2.1. Materials
Two different silica coated titania particles, that we refer to as P1 and P2, respectively, were investigated as emulsions stabilizers. Both particles have a diameter of ca. 34 nm and were obtained from Showa Denko K.K., Japan. The P1 particles are composed of 80 wt. % TiO2 and 20 wt.% SiO2, and are inherently hydrophilic. The P2 particles are the same as P1, except that they in addition have been hydrophobically modified by grafting PDMS (poly(dimethylsiloxane), dimethicone) chains with a molecular weight of circa 1000 g/mole. The grafted chains make up 7% of the total particle weight.
Before using the particles they were left to dry for 30 minutes at 80 °C. In all experiments, Decamethyl cyclopentasiloxane (Mw ≈ 370 g/mole, SH245, Dow Corning Toray Co., Ltd.) was used as the oily phase. Purified water, passed through a Millipore purifier (Milli-Q Reagent Water system) was used as the water phase.
Samples were prepared by weighing the components. Weight fractions were transformed into volume fractions using ρw = 1.0 g/cm3 for the water density, ρo = 0.96 g/cm3 for the oil density and ρp = 3.8 g/cm3 as the density of the P1 and P2 particles. This value has been calculated using a TiO2 density of 4.23 g/cm3 and a SiO2 density of 2.65 g/cm3.
2.2. Preparation of emulsion samples
Powder of dry particles and silicone oil were put into glass vessel and this mixture was kept at 25 °C for a certain period of time, that we call the soaking time, ts. The weight fraction of particles in the oil, Wp = mp/(mp+mo), where mp and mo are the masses of particles and oil respectively, was always kept constant to Wp = 0.0125. This corresponds to a fixed volume fraction of particles with respect to oil ϕp = 0.0032. After soaking for time ts, the powder was dispersed using an ultrasonic processor (Vibracell VCX130 with 3 mm tip diameter, Sonics & Materials) operating at 20 kHz for 5 minutes. Then the appropriate amount of water was added, and the mixture was emulsified by continuing sonication for an additional 5 minutes. For the samples used to assess the type of emulsion formed, 0.01 wt% of Eosin bluish was added to the water phase.
In some particular experiments the emulsion samples were stored at 25 °C for a certain period of time, called the maturing time, tm in order to investigate whether there was a time evolution of the emulsion properties. After storage, a part of each sample was re-sonicated for 5 minutes while the other part of the same sample was centrifuged at 40,000 RCF until the emulsions were completely broken and separated into three layers: an upper oil phase, a middle water phase and a particle sediment. After removing both silicone oil and water, particles were washed three times with ethanol (cyclopentasiloxane is soluble in ethanol) and dried under reduced pressure at room temperature. New emulsion samples were then prepared using this powder following the same procedure as previously described without additional soaking time.
2.3. Emulsion characterization
2.3.1. Assessment of emulsion type
The type of emulsion oil-in-water (O/W) or water-in-oil (W/O) was assessed by macroscopic and microscope observations. Emulsions containing or not the hydrophilic dye (Eosin bluish) were observed in an optical microscope (Zeiss Axioplan Universal microscope) and by observation of emulsion creaming (O/W) or sedimentation (W/O).
2.3.2. Observation and drop size determination
Observation with the optical microscope also allows for an estimate of the drop size and gives a visual indication about the polydispersity of the emulsion and the presence or absence of excess particles in the continuous phase.
2.3.3. Measurement of sedimentation
To investigate the sedimentation of W/O emulsion droplets, samples were put into 5 mm NMR tubes and left to stand. The interface between the white sediment and the excess oil phase at the top of the tube was sufficiently sharp to determine a time evolving sediment height, h(t), to be compared to the constant total sample height, h0. The initial sedimentation rate, vin, was determined from the initial slope, at t = 0.
2.3.4 Stability in an ultracentrifugal field
The stability of the particle loaded interfacial film was investigated by centrifugation of the the emulsions and observing emulsion breakage. W/O emulsion samples in 5 mm NMR tubes were centrifuged (3K30, SIGMA Laborzentrifugen GmbH) at 25 °C. The RCF was gradually increased in 100 g steps (g = 9.81m/s2) each 10 minutes until free water was observed signaling emulsion breakage.
3. Results and discussion
The unmodified (P1) and hydrophobically modified (P2) silica coated TiO2 particles were left to “soak” in the oil during a time ts (soaking time). After this time, the particles were dispersed by 5 minutes of sonication after which the appropriate amount of water was added and the samples were emulsified sonication for an additional 5 minutes (see Experimental section for details). The resulting emulsions were characterized with respect to emulsion type, sedimentation rate and resistance to breaking by centrifugation. The results are presented and discussed below.
3.1. Emulsion type
Emulsions with different water volume fractions in the range 0.1 ≤ ϕw ≤ 0.8 were prepared after different soaking times. The resulting emulsion types are presented in ts-ϕw stability diagrams, shown in , for P1 and P2 particles, respectively. As can be seen, the soaking time has a significant effect on the emulsion type formed in the case of P1 while soaking had no visible effect on the already modified particles, P2.
Figure 1. Emulsion type diagram of emulsions prepared at different water volume fractions ϕw and different soaking times, ts. (a) top: Originally hydrophilic particles, P1. (b) bottom: Hydrophobic particles, P2. We distinguish between direct emulsions O/W, and reverse emulsions, W/O. In certain cases we also observe double emulsions W/O/W or O/W/O. Due to sedimentation, creaming or incomplete emulsification, we could also detect excess oil and/or water phases at steady state. (+W) and (+O) refers to creaming and sedimentation, respectively. In the case of incomplete emulsification, the excess phase is written without parentheses.
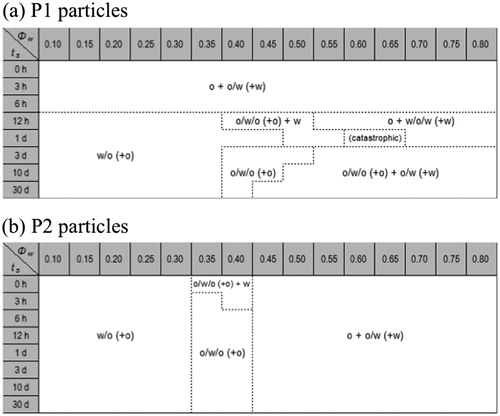
In the case of the P1 particles () and up to 6 h of soaking, emulsions are of the O/W type irrespective of the water-to-oil ratio (WOR). The notation O + O/W + (W) means that the entire amount oil is not emulsified. A layer of un-emulsified oil lays on the top of the O/W emulsion and this direct emulsion has creamed over an aqueous phase. For longer soaking times (ts > 6h), reverse W/O emulsions were formed as long as oil is the main component i.e. at lower water content (ϕw < 0.4). At higher water content, double emulsions, O/W/O or W/O/W, were observed. Thus, as an effect of increased ts, we observe for lower water contents a transition from an O/W to a W/O emulsion, indicating that the soaking leads to a transformation of the P1 particles from hydrophilic to hydrophobic. In the case of P2 particles (), on the other hand, the emulsion type is not affected by the soaking time. It is worth noticing that the type of emulsions depends strongly on the water-to-oil ratio, ϕw/ϕo. Indeed up to ϕw ≈ 0.35, which means that oil is the predominant phase, emulsions are W/O while at larger water contents (ϕw ≥ 0.45), the emulsions are O/W. In a limited zone (0.35 < ϕw < 0.45), the two types of emulsions coexist in the form of double emulsions. This seems reminiscent from the formulation/composition maps proposed by Salager and co-workers for surfactant-stabilized emulsions.[Citation36–40] In these latter cases, for ϕw/ϕo ≈ 1, the type of emulsion is governed by the formulation, i.e. the affinity of the surfactant towards the aqueous or oily phase. At high water or oil content ϕw/ϕo tends to govern the type of emulsion. As a consequence, when formulation and composition agree, the type of emulsion is unambiguous, while if there is a conflict between formulation and composition double emulsion are often observed. In these regions of the map, the emulsion type becomes very sensitive to the preparation protocol pathway. For the titanium dioxide particles studied in the present paper, the presence of double emulsion could also reveal the uncertainty of the system to choose between two opposite tendencies arising from the particle wettability on the one side and from the emulsion composition on the other side.
Particle wettability, or hydrophilicity/hydrophobicity balance, is usually quantified in terms of the contact angle, θ, at the three phase line taken through the water phase.[Citation6] Hydrophilic particles are characterized by a value θ < 90° while large values (θ > 90°) are characteristic of hydrophobic particles. Generally, hydrophilic particles can stabilize O/W emulsions while the opposite holds for hydrophobic particles.[Citation6] We have here no quantitative estimate of how θ depends on ts. However, we can estimate the value of ts for obtaining θ = 90° by another comparison with surfactant stabilized emulsions. When the surfactant is hydrophilically/hydrophobically balanced, the spontaneous curvature of the surfactant loaded interface, H0, is close to zero.[Citation41] Here, emulsions are unstable and coalesce rapidly.[Citation42] It also marks the transition line between O/W to W/O emulsions,[Citation36] for the much studied phase inversion[Citation43–45] of nonionic surfactant stabilized emulsions. The data in demonstrate that the particle properties are shifted from hydrophilic to hydrophobic with increasing ts, and with a transition from O/W to W/O emulsions at ts ≈ 6h. It is therefore reasonable that ts ≈ 6h corresponds to θ ≈ 90°. Making the analogy between particle contact angle and surfactant film spontaneous curvature has some relevance, but we recall that there are fundamental differences between particle and surfactant stabilized emulsions. In contrast to typical particles, surfactants spontaneously adsorb at the water-oil interface. Furthermore, in surfactant-water-oil systems there are generally equilibrium microemulsion phases, and emulsions are typically supersaturated microemulsions.[Citation46,Citation47]
3.2. W/O droplet size
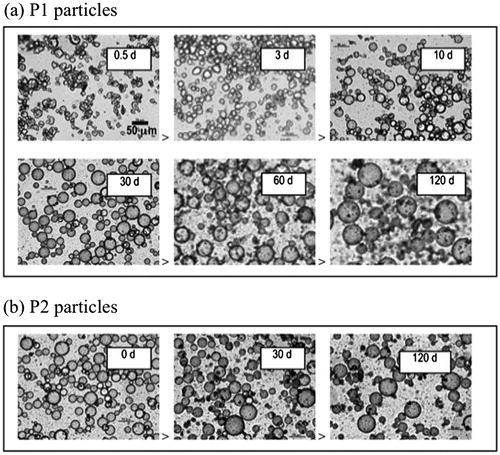
Fixing ϕw = 0.2, and ϕp = 0.0032 we further characterized the W/O emulsions formed after longer soaking times, ts. In we present optical microscope images of emulsions formed after different ts. P1 stabilized-emulsions are shown in , and compared with P2 stabilized-emulsions in . As can be seen in , the droplet size increases monotonically with increasing ts, and thus with the particle hydrophobicity. We estimate the average particle radius, R, to be circa 5–10 µm for ts = 0.5 day, and increases to circa 30 µm at the longest soaking time, ts = 120 days. Furthermore, a visible excess of particles in the continuous oil phase appears beyond 10 days and grows in quantity after that. As a comparison, the average drop size in the P2 system () is essentially independent of ts, and excess particles in the oil phase were observed for all soaking times. The average droplet size in the P2 system corresponds approximately to that obtained in the P1 system after ts = 60 days.
Figure 2. Microscope images of emulsions having ϕw = 0.2, prepared with particles having experienced different soaking times ts. (a) Emulsions prepared with P1 particles. (b) Emulsions prepared with P2 particles.
Thus, the efficiency of particle adsorption during the emulsification process decreases with increasing hydrophobicity. From the drop size we can estimate the effective particle concentration, ϕp,eff ≤ ϕp, i.e. the volume fraction of particles that are adsorbed at the water-oil interface. Assuming that the adsorbed particles form a hexagonally close packed monolayer, then each particle contribute with an area . The total interfacial area per unit volume, A/V = 3ϕw/R. Since we also have A/V = 3ϕp,eff/(4rp0.91), we finally obtain
[1]
[1]
With rp = 17 nm, and ϕw = 0.2 we obtain that the fraction adsorbed particles ϕp,eff/ϕp decreases from 0.77 for ts = 0.5 day (R ≈ 5 μm) to 0.13 for ts = 120 days (R ≈ 30 μm). This trend is consistent with the observation of aggregates of excess non-adsorbed particles in the continuous phase () for longer soaking times.
The reason why ϕp,eff decreases with increasing hydrophobicity is not fully clear. However, one possibility is that sonication not only fragments the water domains but also detach particles from the interface, or prevent adsorption, making it not fully covered. Particles are in fact expected to be less strongly anchored at the interface the more θ deviates from 90°. If the drops are only partly covered by particles when sonication is terminated, they will coalesce, and coalescence will continue until the interface is completely covered by particles.[Citation48] During this time there may also be some additional adsorption, depending on the rate of adsorption relative to the rate of coalescence. We expect the adsorption rate to decrease with increasing ts as the particles become more and more hydrophobic.
3.3. W/O droplet sedimentation
The W/O emulsion droplets sediment. However, because the density difference between the silicon oil and water is small, the sedimentation is relatively slow. To analyze this in more detail, freshly prepared emulsions, with ϕw = 0.20 were transferred to 5 mm diameter glass tubes and let to sediment. When the droplets sediment, the supernatant is an essentially pure transparent oil phase and the interphase between the white sediment and the transparent oil phase was sufficiently sharp to assess a sediment height, h. The height of the full sample was always kept constant at h0 = 11 cm. As an example, a sample, stabilized by P2 particles with ts = 120 days, is shown in . The sedimentation was studied by measuring h as a function of time. In we present the sedimentation profile, where the relative sediment height h/h0 is plotted as a function of time. As can be seen, sedimentation occurs on the time scale of hours and a stable sediment height hf is obtained at longer times (after circa 5-10 h). In this particular sample, the emulsion is compressed approximately by a factor slightly larger than two, so that ϕw is increased to ca. 0.45 in the steady state sediment. Below we will refer to this final volume fraction as ϕf = ϕwh0/hf.
Figure 3. (a) Picture of a sample after sedimentation. ϕw = 0.2, and the sample was prepared with P2 particles having ts = 120 days. The picture was taken 24 h after emulsion preparation. h0 (=11 cm) is the total sample height and h is the height of the sediment. The tube diameter is 5 mm. (b) Sedimentation profile of the same sample. The relative sediment height h/h0 is plotted as a function of time. From the initial slope (broken line) we evaluate the initial sedimentation velocity, vin. (c) Sedimentation profiles of emulsions stabilized by P1 particles having different ts. (d) Sedimentation profiles of emulsions stabilized by P2 particles having different ts.
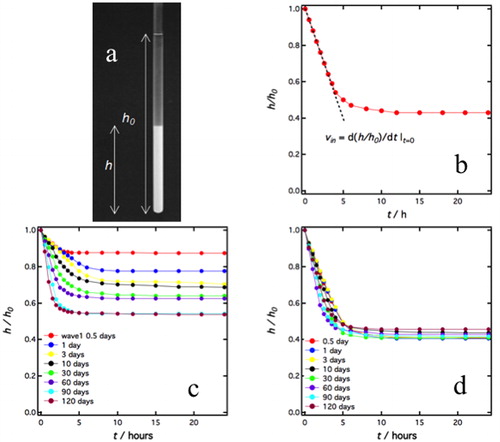
Sedimentation curves obtained for emulsions stabilized by P1 and P2 particles with different ts are presented in respectively. For the P1 particle emulsions, both the sedimentation rate and the final volume fraction, ϕf, depend on the particle soaking time, ts. For emulsions stabilized by P2 particles, on the other hand, the sedimentation curves are essentially independent of ts.
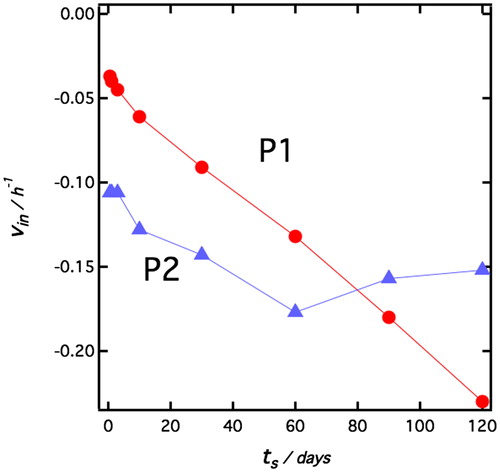
From the sedimentation curves in , the initial sedimentation rate, , was evaluated from the initial slopes, as illustrated in , and the results are presented in . As can be seen, for P1 particles, vin increases in absolute value with ts while for P2 particles the rate is essentially independent of ts. This behavior is consistent with the optical microscopy observations () that the emulsion drop size increases with increasing ts for emulsions stabilized by P1 particles, while for the case of P2 particles the drop size is essentially constant, independent of ts.
Figure 4. vin as a function of ts for emulsions stabilized by P1 and P2 particles, respectively.
The concentration dependence of the sedimentation velocity has experimentally been found to obey[Citation49]:
[2]
[2]
where v0 is the Stokes’ velocity of an isolated drop of radius R, given by:
[3]
[3]
Here, Δρ is the density difference between the dispersed and the continuous phases, g is the gravitational acceleration constant (9.81 m.s−2) and η is the solvent viscosity. Knowing that the initial sedimentation rate and velocity
are related through:
, the average drop radii can be calculated from EquationEquations (2)
[3]
[3] and Equation(3)
[4]
[4] . The results are plotted in . The average droplet radii obtained from the sedimentation rates, are in reasonable agreement with those estimated from microscopy.
Figure 5. (a) Average drop radius, R, obtained from the sedimentation rate, plotted as a function of the soaking time, ts, for P1 (red filled circles) and P2 (blue filled triangles) emulsions, respectively. (b) Final steady state volume fraction of the sediment, ϕf, plotted as a function of ts, for P1 (red filled circles) and P2 (blue filled triangles) emulsions, respectively.
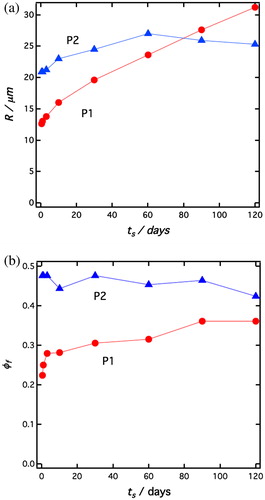
In we have plotted the variation of ϕf with ts. As can be seen from and , the final water volume fraction in the sediment, ϕf ≈ 0.45 is essentially independent of ts for the P2 stabilized emulsions. On the contrary, for P1 particles, ϕf increases from 0.23 to 0.37 with increasing ts. However, in contrast to the variation of R, it seems that ϕf saturates after 90 days of soaking. These values are all significantly smaller than the value for random close packing ϕrcp that should be reached for non-interacting drops. The random close packing depends on the drop size distribution, it is equal to 0.64 for monodisperse spheres higher in the case of polydispersity.[Citation50]
The low values of ϕf are likely a consequence of attractive van der Waals interactions between the droplets, resulting in aggregation, and that the sediment is actually a colloidal gel that can support its own weight. Such an observation agrees with the existence of an elastic modulus well below the random close packing as shown by Arditty and co-workers in Pickering emulsions,[Citation3] or more generally in suspension with weakly attractive particles.[Citation51] In the case of a colloidal gel able to withstand its own weight, a stable sediment is expected when the compression yield stress of the network, Py, is equal to the gravitational compression stress, σg,[Citation52] given by
[4]
[4]
Due to the volume conservation of the dispersed phase, is constant, meaning that σg = 8.6 Pa is fixed for both systems. Py varies with radius and concentration approximately as [Citation49,Citation53]
[5]
[5]
although it has been pointed out[Citation54] that a single power law cannot be expected to describe the concentration dependence over the whole concentration range. Here, A is a constant that depends on the network structure (fractal dimension) and the droplet-droplet interactions. EquationEquation (5)
[6]
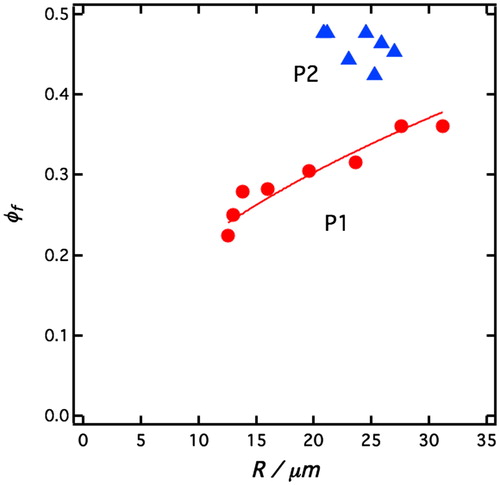
[6] implies that we expect ϕf ∼ R1/2. In we have plotted our experimentally determined ϕf as a function R together with the theoretical prediction ϕf ∼ R1/2, shown as a solid line. As can be seen, the data are consistent with the prediction although there is not enough data to accurately verify the scaling exponent. For the P2 system both R and ϕf are approximately constant. From these data, a rough estimate of A can be given: A ≈ 4 10−7 N for P1-stabilized emulsions and is of the order of 1 10−7 N for the system stabilized by P2 particles. The slightly lower A-value on the case of P2 particles possibly reflect a lower friction between drops when the particles are hydrophobically modified with the longer PDMS chains.
Figure 6. Sediment volume fraction ϕf, plotted as a function of average drop radius, R, for P1 (red filled circles) and P2 (blue filled triangles) emulsions, respectively. The solid line is a best fit of the relation ϕf = AR1/2 to the P1 emulsion data, with A being an adjustable parameter.
3.4. Centrifugation
Using centrifugation, the emulsions can be further compressed and also be broken at higher rotational speeds. To assess the rigidity of the particle loaded droplet interface, the emulsion samples were centrifuged. The rotational speed was gradually increased, spending 10 minutes at every speed, until the first traces of free water could be detected, as a sign of emulsion breaking. As previously noted, if the centrifugation times had been increased, a water layer could have been observed for slower rotation speed. Although not performed at equilibrium theses experiments allow comparison between the systems. In we present the effective gravitational acceleration, ng* (number of g-units) when the first traces of water could be detected, for the different emulsion samples. ng* is plotted as a function of the soaking time, ts, and data are given for both P1 and P2 particle systems. As can be seen, the P1 particle stabilized-emulsions are generally significantly more resistant against compression induced by the centrifugation force, compared to the emulsions stabilized by the P2 particles. However, the P1 system approaches P2 at long soaking time. Again one should notice that the resistance of emulsions depends on the drop size.[Citation55] From it appears that the drops sizes of emulsions stabilized by P1 or P2 particles are not significantly different for longer soaking times (ts > 60 days), so that the huge difference of resistance at ts = 60 days cannot just be explained by a drop size difference.
Figure 7. Compression of sediment by centrifugation. (a, left) The effective acceleration, ng* (number of g-units) when the first traces of free water was observed from the sediment, plotted as a function of the particles soaking times, ts, for P1 (red filled circles) and P2 (blue filled triangles) emulsions, respectively. Insert: Gravitational compression stress, σ, at the breaking of the P1 emulsions plotted as a function of ts. (b, right) Emulsion drop volume fraction in the sediment as a function of the effective gravitational acceleration, ng, (number of g-units) for P1 emulsions with different soaking times: ts=0.5 day (red circles), ts = 1 day (purple triangles), ts=10 days (blue diamonds), ts=100 days (green diamonds).
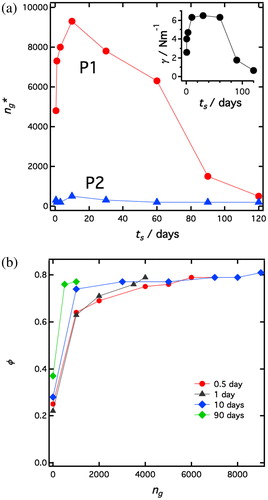
For some samples in the P1 system we also measured the height of the sediment, from which we can calculate the droplet volume fraction, for the different rotational speeds before breaking of the emulsions. The results are presented in , and the results from the sedimentation experiments at ambient gravitational field, 1 g (), have also been included. As can be seen, with small values of ng, the emulsions are first compressed to ca. ϕ = 0.7-0.75 that we interpret as the volume fraction of random close packing, ϕrcp, for the polydisperse emulsions. In this first regime, compaction is easy as we only need to overcome the compression yield stress (initially Py = 8.6N) to induce this dense packing. Increasing further the rotation speed leads only to a minor additional compression, before breakage. This shows that compaction larger than the random close packing is more difficult as it requires drop deformation. Breaking occurs at ϕ ≈ 0.8 for all samples, although different ng is required. The fact that breaking occurs for a volume fraction so close to ϕrcp indicates that the drop interface is rigid but fragile in agreement with other Pickering emulsions.[Citation3]
Continuous compression beyond close packing results in shape deformations of the initially spherical droplets and a corresponding increase of the interfacial area. Following Princen’s empirical relationship,[Citation56–58] we have
[6]
[6]
where ΔA is the area increase and A0 is the interfacial area with spherical drops occurring for ϕ < ϕrcp (neglecting the possible small deformation due to adhesion of drops). This expression is valid from ϕrcp, assuming ϕrcp = 0.71, up to ϕ ≈ 0.98. In the present samples, ϕrcp may deviate slightly from Princen’s value 0.71, but we neglect this for simplicity in our analysis. Thus we use EquationEquation (6)
[7]
[7] and conclude that the area increase at breaking (i.e. for ϕ = 0.8) is ΔA/A0 ≈ 0.08. The interface area increase that the drops may withstand before breaking upon compression is thus approximately 8%, in good agreement with the range 3–10% estimated for monodisperse Pickering emulsions.[Citation3]
Compression beyond close packing is expected to be essentially reversible with an elastic energy stored in the stretching of the interface having an apparent interfacial tension that we denote γ. The compressional stress resulting from centrifugation is Assuming that this applied stress is completely stored as interfacial energy, Princen proposed the semi-empirical equation[Citation59,Citation60]
[7]
[7]
allowing us to obtain estimates of γ.
[8]
[8]
As mentioned above, for all the emulsions the limit before breakage is ϕ ≈ 0.8, and we assume ϕrcp ≈ 0.71. The variation γ with ts is shown as an insert in . As can be seen, rather high values of γ, 6 N/m, are obtained for intermediate soaking times, 10–60 days. For longer ts the value decreases, dropping to ca. 0.4N/m for ts = 120 days. For P2 particles, γ is close to 0.4N/m independent of ts.
The high effective tension indicates that there are attractive interactions between the particles at the water-oil interface. Attractive interactions are indeed expected when the particle surfaces are heterogeneous.[Citation61–63] Wetting irregularities lead to an undulating contact line and an irregular meniscus leading to a minimum in the particle pair potential as a function of separation. Apart from shape irregularities, the particles may have more or less of hydrophobic and hydrophilic domains. We observe a maximum in the effective γ for intermediate soaking times. This may reflect a maximum in the particle heterogeneity. At shorter times the particles are less functionalized and at longer times the approach a homogeneous hydrophobicity. We aim to return to a more quantitative analysis in a forthcoming publication.
3.5. Stability of particle functionalization
Until now we have studied the effect of soaking time on the emulsion type and characteristic. We now would like to assess whether hydrophobization, that occurs when particles are dispersed in oil, goes on at the oil-water interface i.e. after emulsification. Three possibilities may be considered: i) Hydrophobization continues after emulsification as in the pure oil, ii) the inverse occurs, hydrophobization decreases and particles become again more hydrophilic, or iii) it remains constant, hydrophobization is terminated and irreversible and the contact angle remains constant with no further evolution after emulsification. To discriminate between these scenarios, two experiments were carried out using the P1 particles.
W/O emulsions prepared at ϕw = 0.2 and ts=1, 10, 30 days (longer ts were avoided because of the excess particle in the oil phase) were stored at 25 °C for a certain period of time called maturing time tm, and was varied in range from 0 to almost 180 days. After that, all samples were sonicated for 5 minutes again and since the initial sedimentation velocity is very sensitive to hydrophobization for P1 particles (see ), vin was measured. The effect of tm on vin is shown in . As can be seen, the sedimentation velocity does not essentially change with tm between emulsions which were prepared at same ts. In other words, after the emulsification, the particles keep the functionalization they acquired during soaking without increasing or losing hydrophobicity.
Figure 8. Effect of maturing time, tm, on the initial sedimentation velocity, vin. (a, left) vin plotted as a function of ts + tm, for P1 emulsions with different soaking times, ts. ts = 1 day (red triangles triangles), ts = 10 days (blue squares), ts = 30 days (black circles). (b, right) vin plotted as a function of ts + tm, for new emulsions stabilized by the same particles as in (a). For details see text.
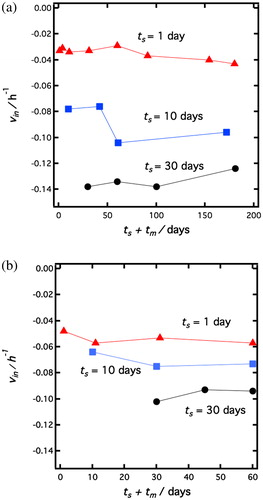
However, there still is a possibility that the energy input to the system by sonication is too small to cause a re-emulsification of droplets with a change in particle hydrophobicity. For this reason, we destroyed the emulsions and extracted the particles before performing a re-emulsification using these particles (see ). W/O emulsions prepared at ϕw = 0.2 and ts=1, 10, 30 days were kept at 25 °C for a maturating time tm from 0 to almost 60 days as in the previous experiment. After that, all samples were centrifuged and only particles were taken out from the system. By reusing these particles, emulsions at ϕw=0.2 were prepared immediately in order to maintain ts and tm at their previous values (no additional time neither for ts nor for tm). Emulsions formed were of the W/O type for all particles and vin is plotted in . The initial sedimentation velocities do not change with tm and are similar to the ones measured with non destroyed emulsions that were just re-sonicated (). In addition, we prepared an O/W emulsion by using particle P1 at ϕw=0.8 (see ) and ts = 0 and kept this emulsion for tm = 90 days at 25 °C. Then particles were taken out from the emulsion after breaking it by centrifugation and we used these particles for emulsification at ϕw = 0.2. The resulting emulsion is of type O/W. From these results, we conclude that hydrophobization of particles progresses only in the pure oil. The process is apparently inhibited by the presence of water. However, the functionalization is irreversible and the contact angle acquired before emulsification remains constant in the emulsion.
3.6. Effect of temperature
Finally, to assess the effect of temperature on hydrophobization kinetics, soaking of P1 particles were also performed at 80 °C. After soaking for a time ts, the oil containing particles were cooled to room temperature and emulsions at ϕw = 0.2 were then prepared following the same procedure as previously. We can assess the effect of temperature by comparing the soaking time needed to invert the emulsion from the initial O/W to W/O. For soaking at room temperature this time is 6 hour. For soaking at 80 °C, this time is reduced to ca. 1 hour. We thus conclude that hydrophobization is accelerated when increasing the temperature.
4. Conclusions
We have demonstrated that silica coated titania particles may be hydrophobically modified/functionalized by letting the particles soak in a cyclic PDMS oil. The contact angle at the water-oil interface can be conveniently tuned by simply adjusting the soaking time. The functionalization is terminated when water is added and the sample emulsified. It is irreversible, i.e. it cannot be removed by washing. The kinetics of functionalization is accelerated upon increasing the temperature.
The average drop size of W/O emulsions increases with increasing particle hydrophobicity because of a decreasing affinity for the interface as the particles become increasingly hydrophobic. The emulsions sediment and the water volume fraction, ϕw, in the sediment that settles in the ambient gravitational field, varies approximately as R1/2, consistent with theory. Increasing the compressional stress, σc, by centrifugation first concentrates the sediment for small values of σc up to ϕw = 0.7-0.75. Increasing σc further eventually result in breaking of the emulsions. From analyzing the σc values at breaking we estimate an effective interfacial tension, γ, of the particle loaded water-oil interface. Obtained values are in the range 0.6 – 6 N/m, with a maximum at intermediate particle hydrophobicity. We attribute the high tensions to attractive interactions between the particles that possibly form an essentially condensed layer with significant cohesive forces at the water-oil interface. Attractive interactions are indeed expected for patchy or inhomogeneous particle surfaces. The maximum in γ is possibly related to that the particles are maximally inhomogeneous at intermediate functionalization.
It may be useful to study this type of particle functionalization and corresponding emulsion properties using model spherical, well controlled Stöber silica particles.[Citation64] While the chemistry behind the observed functionalization remains unclear, soaking particles in silicone oil is a simple and convenient way for tuning the particles’ wettability allowing stabilization of either oil-in-water or water-in-oil Pickering emulsions with the same initial particles. Such a fast and easy method for particle functionalization should open the field to numerous applications.
Acknowledgements
UO thanks University of Bordeaux and Centre de Recherche Paul Pascal for an invitation as guest professor. This work was supported by the Swedish Research Council.
References
- Binks, B. P. Particles as Surfactants-Similarities and Differences. Curr. Opin. Colloid Interface Sci. 2002, 7, 21–41. DOI:10.1016/S1359-0294(02)00008-0
- Leal-Calderon, F.; Schmitt, V. Solid-Stabilized Emulsions. Curr. Opin. Colloid Interface Sci. 2008, 13, 217–227. DOI:10.1016/j.cocis.2007.09.005
- Arditty, S.; Schmitt, V.; Lequeux, F.; Leal-Calderon, F. Interfacial Properties in Solid-Stabilized Emulsions. Eur. Phys. J. B 2005, 44, 381–393. DOI:10.1140/epjb/e2005-00137-0
- Frelichowska, J.; Bolzinger, M. A.; Pelletier, J.; Valour, J. P.; Chevalier, Y. Topical Delivery of Lipophilic Drugs from o/w Pickering Emulsions. Int. J. Pharm. 2009, 371, 56–63. DOI:10.1016/j.ijpharm.2008.12.017
- Marefati, A.; Sjöö, M.; Timgren, A.; Dejmek, P.; Rayner, M. Fabrication of Encapsulated Oil Powders from Starch Granule Stabilized W/O/W Pickering Emulsions by Freeze-Drying. Food Hydrocolloids 2015, 51, 261–271. DOI:10.1016/j.foodhyd.2015.04.022
- Finkle, P.; Draper, H. D.; Hildebrand, J. H. The Theory of Emulsification. J. Am. Chem. Soc. 1923, 45, 2780–2788. DOI:10.1021/ja01665a002
- Binks, B. P.; Lumsdon, S. O. Catastrophic Phase Inversion of Water-in-Oil Emulsions Stabilized by Hydrophobic Silica. Langmuir 2000, 16, 2539–2547. DOI:10.1021/la991081j
- Binks, B. P.; Rodrigues, J. A. Types of Phase Inversion of Silica Particle Stabilized Emulsions Containing Triglyceride Oil. Langmuir 2003, 19, 4905–4912. DOI:10.1021/la020960u
- Nonomura, Y.; Kobayashi, N. Phase Inversion of the Pickering Emulsions Stabilized by Plate-Shaped Clay Particles. J. Colloid Interface Sci. 2009, 330, 463–466. DOI:10.1016/j.jcis.2008.10.063
- Binks, B. P.; Philip, J.; Rodrigues, J. A. Inversion of Silica-Stabilized Emulsions Induced by Particle Concentration. Langmuir 2005, 21, 3296–3302. DOI:10.1021/la046915z
- Binks, B. P.; Lumsdon, S. O. Transitional Phase Inversion of Solid-Stabilized Emulsions Using Particle Mixtures. Langmuir 2000, 16, 3748–3756. DOI:10.1021/la991427q
- Binks, B. P.; Lumsdon, S. O. Pickering Emulsions Stabilized by Monodisperse Latex Particles: Effects of Particle Size. Langmuir 2001, 17, 4540–4547. DOI:10.1021/la0103822
- Madivala, B.; Vandebril, S.; Fransaer, J.; Vermant, J. Exploiting Particle Shape in Solid Stabilized Emulsions. Soft Matter 2009, 5, 1717–1727. DOI:10.1039/b816680c
- Binks, B. P.; Lumsdon, S. O. Effects of Oil Type and Aqueous Phase Composition on Oil–Water Mixtures Containing Particles of Intermediate Hydrophobicity. Phys. Chem. Chem. Phys. 2000, 2, 2959–2967. DOI:10.1039/b002582h
- Frelichowska, J.; Bolzinger, M. A.; Chevalier, Y. Pickering Emulsions with Bare Silica. Colloids Surf A 2009, 343, 70–74. DOI:10.1016/j.colsurfa.2009.01.031
- Fournier, C. O.; Fradette, L.; Tanguy, P. A. Effect of Dispersed Phase Viscosity on Solid-Stabilized Emulsions. Chem. Eng. Res. Des. 2009, 87, 499–506. DOI:10.1016/j.cherd.2008.11.008
- Binks, B. P.; Rodrigues, J. A. Inversion of Emulsions Stabilized Solely by Ionizable Nanoparticles. Angew. Chem. Int. Ed. 2005, 44, 441–444. DOI:10.1002/anie.200461846
- Yan, N.; Masliyah, J. H. Effect of pH on Adsorption and Desorption of Clay Particles at Oil–Water Interface. J. Colloid Interface Sci. 1996, 181, 20–27. DOI:10.1006/jcis.1996.0352
- Gautier, F.; Destribats, M.; Perrier-Cornet, R.; Dechézelles, J. F.; Giermanska, J.; Héroguez, V.; Ravaine, S.; Leal-Calderon, F.; Schmitt, V. Pickering Emulsions with Stimulable Particles: From Highly- to Weakly-Covered Interfaces. Phys. Chem. Chem. Phys. 2007, 9, 6455–6462. DOI:10.1039/b710226g
- Destribats, M.; Gineste, S.; Laurichesse, E.; Tanner, H.; Leal-Calderon, F.; Héroguez, V.; Schmitt, V. Pickering Emulsions: what Are the Main Parameters Determining the Emulsion Type and Interfacial Properties? Langmuir 2014, 30, 9313–9326. DOI:10.1021/la501299u
- Jesionowski, T.; Krysztafkiewicz, A. Preparation of the Hydrophilic/Hydrophobic Silica Particles. Colloids Surf A 2002, 207, 49–58. DOI:10.1016/S0927-7757(02)00137-1
- Auroy, P.; Auvray, L.; Léger, L. Silica Particles Stabilized by Long Grafted Polymer Chains: From Electrostatic to Steric Repulsion. J. Colloid Interface Sci. 1992, 150, 187–194. DOI:10.1016/0021-9797(92)90279-U
- Reculusa, S.; Ravaine, S. Colloidal Photonic Crystals Obtained by the Langmuir–Blodgett Technique. Appl. Surf. Sci. 2005, 246, 409–414. DOI:10.1016/j.apsusc.2004.11.066
- Sidorenko, A.; Zhai, X. W.; Greco, A.; Tsukruk, V. V. Hyperbranched Polymer Layers as Multifunctional Interfaces. Langmuir 2002, 18, 3408–3412. DOI:10.1021/la011526f
- Cohen-Addad, J.-P.; Huchot, P.; Jost, P.; Pouchelon, A. Hydroxyl or Methyl Terminated Poly(Dimethylsiloxane) Chains: kinetics of Adsorption on Silica in Mechanical Mixtures. Polymer 1989, 30, 143–146. DOI:10.1016/0032-3861(89)90394-7
- DeGroot, J. V., Jr.; Macosko, C. W. Aging Phenomena in Silica-Filled Polydimethylsiloxane. J. Colloid Interface Sci. 1999, 217, 86–93. DOI:10.1006/jcis.1999.6332
- Hoefnagels, H. F.; Wu, D.; de With, G.; Ming, W. Biomimetic Superhydrophobic and Highly Oleophobic Cotton Textiles. Langmuir 2007, 23, 13158–13163. DOI:10.1021/la702174x
- Deruelle, M.; Tirrell, M.; Marciano, Y.; Hervet, H.; Léger, L. Adhesion Energy between Polymer Networks and Solid Surfaces Modified by Polymer Attachment. Faraday Disc 1994, 98, 55–65. DOI:10.1039/FD9949800055
- Voelkel, A.; Krysztafkiewicz, A. Acid-Based Properties of Silicas Modified by Organic Compounds as Determined by Inverse Gas Chromatography. Powder Technol. 1998, 95, 103–108. DOI:10.1016/S0032-5910(97)03325-1
- Sinka, J. V.; Lichtman, I. A. An Insight into Hydrophobic Particle Defoamers Used in the Textile Industry. Int. Dyer Textile Printer 1976, 155, 489–492.
- Marinova, K. G.; Denkov, N. D.; Branlard, P.; Giraud, Y.; Deruelle, M. Optimal Hydrophobicity of Silica in Mixed Oil − Silica Antifoams. Langmuir 2002, 18, 3399–3403. DOI:10.1021/la0115841
- Marinova, K. G.; Denkov, N. D.; Tcholakova, S.; Deruelle, M. Model Studies of the Effect of Silica Hydrophobicity on the Efficiency of Mixed Oil − Silica Antifoams. Langmuir 2002, 18, 8761–8769. DOI:10.1021/la025675p
- Marinova, K. G.; Christova, D.; Tcholakova, S.; Efremov, E.; Denkov, N. D. Hydrophobization of Glass Surface by Adsorption of Poly(Dimethylsiloxane). Langmuir 2005, 21, 11729 DOI:10.1021/la051690t
- Shaath, N. A. The Encyclopedia of Ultraviolet Filter, 1st ed.; Allured Pub Corp.: Carol Stream IL, 2007.
- Binks, B. P.; Yin, D. Pickering Emulsions Stabilized by Hydrophilic Nanoparticles: In Situ Surface Modification by Oil. Soft Matter 2016, 12, 6858. DOI:10.1039/C6SM01214K
- Salager, J.L.; Loaiza-Maldonado, I.; Minaňa-Perez, M.; Silva, F. Surfactant-Oil-Water Systems near the Affinity Inversion – Part I: Relationship between Equilibrium Phase Behavior and Emulsion Type and Stability. J. Dispersion Sci. Technol. 1982, 3, 279–292. DOI:10.1080/01932698208943642
- Salager, J. L.; Minana-Perez, M.; Pdrez-Sanchez, M.; Ramirez-Gouveia, M.; Rojas, C. I. Surfactant-Oil-Water Systems near the Affinity Inversion Part III: The Two Kinds of Emulsion Inversion. J. Dispers. Sci. Technol. 1983, 4, 313–329. DOI:10.1080/01932698308943373
- Pérez, M.; Zambrano, N.; Ramirez, M.; Tyrode, E.; Salager, J. L. Surfactant-Oil- Water Systems near the Affinity Inversion. XII. Emulsion Drop Size versus Formulation and Composition. J. Dispers. Sci. Technol. 2002, 23, 55–63.
- Salager, J. L.; Antón, R. E.; Briceño, M. I.; Choplin, L.; Márquez, L.; Pizzino, A.; Rodriguez, M. P. The Emergence of Formulation Engineering in Emulsion Making – Transferring Know-How from Research Laboratory to Plant. Polym. Int. 2003, 52, 471–478. DOI:10.1002/pi.1112
- Pizzino, A.; Molinier, V.; Catté, M.; Ontiveros, J. F.; Salager, J. L.; Aubry, J. M. Relationship between Phase Behavior and Emulsion Inversion for a Well-Defined Surfactant (C10E4)/n-Octane/Water Ternary System at Different Temperatures and Water/Oil Ratios. Ind. Eng. Chem. Res. 2013, 52, 4527–4538. DOI:10.1021/ie302772u
- Olsson, U.; Wennerström, H. Globular and Bicontinuous Phases of Nonionic Surfactant Films. Adv. Colloid Interface Sci. 1994, 49, 113–146. DOI:10.1016/0001-8686(94)80014-6
- Kabalnov, A.; Wennerström, H. Macroemulsion Stability: The Oriented Wedge Theory Revisited. Langmuir 1996, 12, 276–292. DOI:10.1021/la950359e
- Shinoda, K.; Saito, H. The Stability of O/W Type Emulsions as Functions of Temperature and the HLB of Emulsifiers: The Emulsification by PIT-Method. J. Colloid Interface Sci. 1969, 30, 258–263. DOI:10.1016/S0021-9797(69)80012-3
- Shinoda, K.; Kunieda, H. Phase Properties of Emulsions: PIT and HLB. In Encyclopedia of Emulsion Technology; Becher, P., Ed.; Marcel Dekker: New York, 1983; Vol. 1, pp 337–367.
- Roger, K.; Cabane, B.; Olsson, U. Formation of 10 − 100 Nm Size-Controlled Emulsions through a Sub-PIT Cycle. Langmuir 2010, 26, 3860–3867. DOI:10.1021/la903401g
- Wennerström, H.; Söderman, O.; Olsson, U.; Lindman, B. Macroemulsions versus Microemulsions. Colloids Surf. A 1997, 123–124, 13–26. DOI:10.1016/S0927-7757(96)03848-4
- Wennerström, H.; Söderman, O.; Olsson, U.; Lindman, B. Macroemulsions from the Perspective of Microemulsions. In Encyclopedic Handbook of Emulsion Technology; Sjöblom, J., Ed.; Marcel Dekker Inc.: New York, 2001; pp 95–107.
- Destribats, M.; Faure, B.; Birot, M.; Babot, O.; Schmitt, V.; Backov, R. Tailored Silica Macrocellular Foams: Combining Limited Coalescence‐Based Pickering Emulsion and Sol–Gel Process. Adv. Funct. Mater. 2012, 22, 2642–2654. DOI:10.1002/adfm.201102564
- Buscall, R. The Sedimentation of Concentrated Colloidal Suspensions. Colloids Surf. 1990, 43, 33–53. DOI:10.1016/0166-6622(90)80002-L
- Princen, H. M.; Aronson, M. P.; Moser, J. C. Highly Concentrated Emulsions. II. Real Systems. The Effect of Film Thickness and Contact Angle on the Volume Fraction in Creamed Emulsions. J. Colloid Interface Sci. 1980, 75, 246–270. DOI:10.1016/0021-9797(80)90367-7
- Trappe, V.; Weitz, D. A. Scaling of the Viscoelasticity of Weakly Attractive Particles. Phys. Rev. Lett. 2000, 85, 449–452. DOI:10.1103/PhysRevLett.85.449
- Buscall, R.; White, L. R. The Consolidation of Concentrated Suspensions. Part 1.—The Theory of Sedimentation. J. Chem. Soc., Faraday Trans. 1 1987, 83, 873–891. DOI:10.1039/f19878300873
- Buscall, R.; Mills, P. D. A.; Goodwin, J. W.; Lawson, D. W. Scaling Behaviour of the Rheology of Aggregate Networks Formed from Colloidal Particles. J. Chem. Soc., Faraday Trans. 1 1988, 84, 4249–4260. DOI:10.1039/f19888404249
- Seto, R.; Botet, R.; Meireles, M.; Auernhammer, G. K.; Cabane, B. Compressive Consolidation of Strongly Aggregated Particle Gels. J. Rheol. 2013, 57, 1347. DOI:10.1122/1.4817436
- Mason, T. G.; Lacasse, M. D.; Grest, G. S.; Levine, D.; Bibette, J.; Weitz, D. A. Osmotic Pressure and Viscoelastic Shear Moduli of Concentrated Emulsions. Phys. Rev. E 1997, 56, 3150–3166. DOI:10.1103/PhysRevE.56.3150
- Princen, H. M. Rheology of Foams and Highly Concentrated Emulsions. II. Experimental Study of the Yield Stress and Wall Effects for Concentrated Oil-in-Water Emulsions. J. Colloid Interface Sci. 1985, 105, 150–171. DOI:10.1016/0021-9797(85)90358-3
- Princen, H. M.; Kiss, A. D. Osmotic Pressure of Foams and Highly Concentrated Emulsions. 2. Determination from the Variation in Volume Fraction with Height in an Equilibrated Column. Langmuir 1987, 3, 36–41. DOI:10.1021/la00073a007
- Princen, H. M. Pressure/Volume/Surface Area Relationships in Foams and Highly Concentrated Emulsions: Role of Volume Fraction. Langmuir 1988, 4, 164–169. DOI:10.1021/la00079a030
- Princen, H. M. Rheology of Foams and Highly Concentrated Emulsions: I. Elastic Properties and Yield Stress of a Cylindrical Model System. J. Colloid Interface Sci. 1983, 91, 160–175. DOI:10.1016/0021-9797(83)90323-5
- Princen, H. M.; Kiss, A. D. Rheology of Foams and Highly Concentrated Emulsions: III. Static Shear Modulus. J. Colloid Interface Sci. 1986, 112, 427–437. DOI:10.1016/0021-9797(86)90111-6
- Lucassen, J. Capillary Forces between Solid Particles in Fluid Interfaces. Colloids Surf 1992, 65, 131. DOI:10.1016/0166-6622(92)80268-7
- Stamou, D.; Duschl, C.; Johannsmann, D. Long-Range Attraction between Colloidal Spheres at the Air-Water Interface: The Consequence of an Irregular Meniscus. Phys. Rev. E 2000, 62, 5263. DOI:10.1103/PhysRevE.62.5263
- Kralchevsky, P. A.; Denkov, N. D. Capillary Forces and Structuring in Layers of Colloid Particles. Curr. Opin. Colloid Interface Sci. 2001, 6, 383–401. DOI:10.1016/S1359-0294(01)00105-4
- Stöber, W.; Fink, A.; Bohn, E. Controlled Growth of Monodisperse Silica Spheres in the Micron Size Range. J. Colloid Interface Sci. 1968, 26, 62–69. DOI:10.1016/0021-9797(68)90272-5