
 ?Mathematical formulae have been encoded as MathML and are displayed in this HTML version using MathJax in order to improve their display. Uncheck the box to turn MathJax off. This feature requires Javascript. Click on a formula to zoom.
Abstract
Nanocomposite coatings are of great interest as barrier coatings since synergy effects between matrix and additive properties can be achieved. This, however, requires favorable additive-matrix interactions to provide a strong interphase (interface region). In this work we elucidate the properties of two environmentally benign nanocomposite coatings based on a waterborne acrylate formulation with additives from renewable sources, i.e. either cellulose nanocrystals, CNC; or, alternatively, cellulose nanofibrils, CNF. We focus on the corrosion protective properties of these coatings and discuss the reason why the nanocomposite with CNC displays favorable corrosion protection properties whereas that with CNF does not. To this end we utilized scanning electron microscopy, water contact angle measurement, Fourier transform infrared spectroscopy and electrochemical impedance spectroscopy techniques to investigate the microstructure, surface wetting, interactions between cellulosic materials and matrix as well as corrosion protective properties of both composite coatings.
Graphical Abstract
Introduction
A good barrier coating is required to retard the transport of water and corrosive species towards the metal surface. The addition of nanofillers could increase the tortuosity of their diffusion path across the coating and thus retard corrosion by this and other mechanisms related to filler-matrix and filler-metal interface interactions. Cellulose nanocrystals, CNC, and cellulose nanofibrils, CNF, are biobased nanofillers that have many advantages, including sustainable and abundant sources, low toxicity and impact on the environment.[ Citation 1 , Citation 2 ]
Cellulose nanocrystals (CNC) are mainly rod-like nanoparticles with dimensions of 10–20 nm in diameter and several hundred nanometers in length.[ Citation 3 ] They are prepared by strong acid hydrolysis from various sources such as wood pulp, cotton, manila, tunicin and bacteria.[ Citation 4 ] In the acid hydrolysis process, the noncellulose and major amorphous components are removed, producing CNC particles with high crystallinity and half ester sulfate group (OSO3 -) on their surface. Cellulose nanofibrils (CNF) are flexible fibers with similar or larger diameter than that of CNC and several µm in length.[ Citation 3 ] One commonly used production method is TEMPO-mediated oxidation (2,2,6,6,-tetramethylpipelidine-1-xoyl radical). The resulting CNF contains both amorphous and crystalline sections, resulting in a lower crystallinity than that of CNC and carboxylate groups are introduced during the TEMPO oxidation step.
Both CNC and CNF are nanomaterials with excellent mechanical properties[ Citation 1 , Citation 5–7 ] due to the almost perfect crystalline structure of CNC or crystalline sections of CNF, combined with intra- and inter-chain hydrogen bond networks.[ Citation 8 ] This has made CNC and CNF popular reinforcement agents in polymer composite coatings.[ Citation 9–12 ] In this work, a water-based organic coating was used as the matrix and combined with either CNC or CNF to produce composite coatings.
A few studies have reported the corrosion protection properties of CNC reinforced composite polymer coatings.[ Citation 13–15 ] Ma et al. used cellulose nanocrystals as additives in epoxy resins and investigated the corrosion protection performance of 60 µm thick barrier coatings using electrochemical impedance spectroscopy (EIS).[ Citation 13 ] They found excellent corrosion protection in 3.5 wt.% NaCl for up to 30 days, and the best protective ability was found for an additive concentration of 1.0 wt.%. The improved performance due addition of cellulose nanocrystals was attributed to its ability to block pores present in the unmodified matrix. In another study El-Fattah et al. used cellulose nanocrystals in a polyurethane matrix and found improved performance over short times for a loading of 1–4 wt.% as determined by open circuit potential, EIS and salt spray tests.[ Citation 14 ] In our previous work we compared the long-term corrosion protection performance of our matrix coating with that of the CNC composite. Both with and without CNC addition the coating provided corrosion protection for more than one month in 0.1 M NaCl.[ Citation 15 ] Interestingly, with the CNC additive we found an improved corrosion protection performance with time, whereas the typical behavior for barrier coatings of decreasing protective ability with time was found for the matrix alone.[ Citation 15 ]
Up to now, no studies have been performed to systematically compare the corrosion protection properties of CNC and CNF containing barrier composite coatings, but the present work addresses this issue. We compared the effect of CNC and CNF on the corrosion resistance of a waterborne hydroxyacrylate-based coating in 0.1 M NaCl solution by using electrochemical impedance spectroscopy (EIS). The results reveal that the nanocomposite with CNC provides good corrosion protection properties whereas that with CNF does not. In order to understand the contributions of the two nanocellulose additives in the composite coating, we utilized scanning electron microscopy (SEM) to gain insight into the coating morphology; water contact angle measurements to investigate the surface wettability properties and Fourier transform infrared spectroscopy (FTIR) to study matrix-additive interactions.
Materials and method
Coating matrix
The utilized coating matrix is a waterborne hydroxyacrylate resin with hexakis(methoxymethyl)melamine (HMMM) as cross-linker. It was provided as a dispersion with solid content of 38 ± 3 wt.% by PTE Coatings (Gamleby, Sweden). The pH of this resin dispersion before and after adding the cellulose nanomaterials was 7.7 as measured at 20 °C using a pH-meter (PHM210, meterLAB®).
Cellulose based additives
In order to form nanocomposite coatings, cellulose based additives were dispersed into the matrix. One of the additives was cellulose nanocrystals (CNC) prepared by acid hydrolysis of kraft pulp and neutralized by NaOH.[
Citation
16
] Our CNC particles contain surface bound half ester sulfates group ( ) at a density of 0.4 charges/nm2, corresponding to a concentration of 0.14 mmol/g, as determined by conductimetric titration following standard procedures.[
Citation
17
,
Citation
18
] The width and length of our CNC particles was about 8 nm and 200 nm, respectively, as determined from AFM and scanning transmission electron microscopy.[
Citation
19–21
] The density of the CNC powder is 1.5 g/cm3 and the surface/area to weight ratio is 200 m2/g.[
Citation
19
] The other additive was cellulose nanofibrils (CNF) with 1.67 mmol/g of surface bound carboxylate groups. It was prepared from Hardwood bleached chemo-thermomechanical pulp (Aspen, grade 325/85/100 H T) by 2,2,6,6-tetramethylpiperidine-1-oxyl (TEMPO) catalyzed oxidation together with a mechanical defibrillation treatment using a Super-masscolloider (KZA10-15JIV, Masulo Sangyo Co. Ltd. Japan) with a 100 µm gap between the rotating disks and a rotation speed of 1500 rpm. The utilized CNF fibers are 4–6 nm wide and microns in length.[
Citation
22
] The detailed preparation process has been described elsewhere.[
Citation
22
] The utilized CNF sample is a dispersion with CNF concentration of 0.6 ± 0.05 wt.%. The concentration was measured by heating 3 g (m
0) of the CNF sample in an oven at 90 °C until the sample weight (m
t) was constant (after 2–3 days). The weight concentration of the CNF in the dispersion was calculated as
. The pH of the used CNF dispersion was 7.4 at 20 °C measured using a pH-meter (PHM210, meterLAB®).
Dispersion, coating and curing
Composite coatings containing 0.5 wt.% cellulose additives of total dry mass were prepared as reported for CNC in our previous work.[ Citation 15 ] Briefly, 0.2 g of dried CNC powder was added into 100 g of the matrix dispersion. The mixture was magnetically stirred for 2 min at 500 rpm followed by ultrasonication for 2 min. The stirring and ultrasonication process was repeated four times and then the samples were stored for 2 days in sealed glass bottles to avoid evaporation of liquid components and allow gas introduced in the sample during mixing to evaporate. Similarly, for the composite coating containing 0.5 wt.% cellulose nanofibrils of total dry mass, 32 g of CNF dispersion was added into 100 g of the matrix dispersion, followed by mixing and storage as described for the composite containing CNC. Prior to application, the dispersions were gently magnetically stirred and ultrasonicated to redisperse any possible aggregates formed during storage.
Cold rolled mild steel (Q-panel, DC04) provided by Arkema was used as substrates. The pretreatment of the substrates, as well as the coating and curing process has been described in our previous work.[ Citation 23 ] In brief, the substrates were ground till 1200 grit with silicon carbide paper, cleaned with ethanol and dried in air and nitrogen sequentially. The as-prepared substrates were coated with a tube applicator with a gap height of 90 µm, and then cured at 180 °C for 10 min in a muffle oven. During curing a cross-linking reaction takes place between hexakis(methoxymethyl)melamine (HMMM) and the hydroxyacrylate resin.[ Citation 23 , Citation 24 ]
Electrochemical impedance spectroscopy
The coated carbon steel samples were investigated by means of electrochemical impedance spectroscopy, employing a Multi Autolab (Metrohm Autolab B.V. Netherlands) equipped with the software Nova (version 1.10.2). A perturbation amplitude of 10 mV was applied at the open circuit potential (OCP) to collect EIS spectra over the frequency range 104–10−2 Hz in 0.1 M NaCl solution. The exposed surface area of the samples was 1 cm2. All measurements were conducted by using a typical three-electrode cell where a saturated Ag/AgCl electrode was used as reference electrode with a platinum mesh as counter electrode. At least three parallel measurements were performed for each experimental condition. The obtained data were fitted by using the program Zview (version 3.0a).
Scanning electron microscopy (SEM)
The morphologies of the CNC and CNF samples were visualized by SEM, using a Hitachi model S-4800 instrument equipped with a field emission source and operating at an accelerating voltage of 30 kV. For the sample preparation, 10 µl of the 0.01% (w/v) acid hydrolyzed cellulose nanocrystals and TEMPO-oxidized cellulose dispersions were mounted on a glow-discharged carbon-coated Cu grid. The excess of liquid was blotted out with a filter paper and the grid was allowed to dry at room temperature for at least 24 hours, prior to imaging. A scanning electron microscopy/focused ion beam instrument (SEM/FIB, FEI Nova 200) was employed for visualizing the topography and cross-section morphology of the composite coatings containing the nanocellulose materials. Prior to imaging, all the samples were coated with a 10 nm Au layer using an Edwards Auto 306 instrument (FL400/AUTO304, HHV Ltd., United Kingdom) and placed on a SEM-specific sample stage with conductive carbon tape. In addition, conductive carbon tape was also used to connect the sample surfaces to the sample stage to ensure that excess electrons from the electron gun could be removed. The cross-section images with glass as substrate were cut using a diamond pen, and the ones with carbon steel as substrates were prepared by delicate mechanical cutting.
Water contact angle
The wetting of the cellulose reinforced composite coatings was investigated by water contact angle measurements using a PGX instrument ((Paul N. Gardner Company, Inc., the US). Water droplets of volumes 1–4 µL were dispensed on the sample surfaces and imaged by means of a high-resolution CCD camera. From these images the water contact angle together with the droplets volume, base diameter and height were determined as a function of time with the software of the Pocket Goniometer® Program version 2.2.
Fourier-transform infrared spectroscopy
Infrared spectra of CNC, CNF, matrix and composite coatings were recorded by a Fourier-transform infrared spectroscopy instrument (FTIR, TENSOR 37, Bruker Optik GmbH, Germany). To prepare powder samples, small amount of CNC powder and CNF dispersion were dried in oven at 60 °C for three days. The spectra for powder samples (CNC and CNF) were measured by using the Attenuated Total Reflection (ATR) technique; while the spectra for the rest of the samples were obtained by Infrared Reflection-Absorption Spectroscopy (IRRAS). All measurements were performed over the wavenumber range 4000–700 cm−1 with a resolution of 4.0 cm−1. Air was used as background for the powder samples, while for coatings the background was uncoated carbon steel. The spectra were collected and analyzed by means of the software of OPUS 7.5 (copyright© Bruker Optik GmbH 2014).
Results and discussions
Corrosion protection performance and water uptake
The long-term corrosion protection performance of the CNC composite coating has been compared with that of the matrix coating in our previous work.[ Citation 14 ] In this manuscript we focus on the difference between composite coatings containing CNC and CNF, and elucidates why CNC additives result in good performance while CNF additives result in poor corrosion protection. The barrier properties, i.e. the ability of the coating to retard transport of water and corrosive species to the metal interface and thus reduce the corrosion rate, of the composite coatings were evaluated by means of EIS. For the sake of clarity only one set of experimental data for each sample are shown here, but other sets of data are provided in the supplementary information.
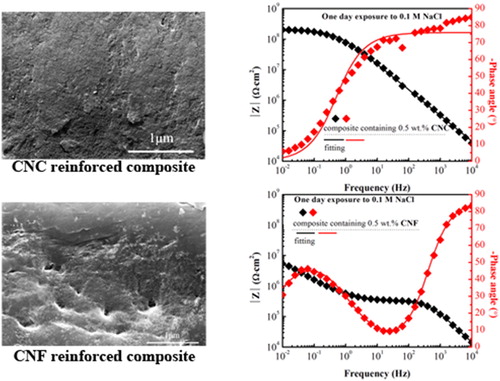
The OCP value for uncoated carbon steel is −0.56 V (vs. Sat. Ag/AgCl) measured after 5 min exposure to 0.1 M NaCl solution, and decreases to −0.68 V (vs. Sat. Ag/AgCl) after 6 hours. The EIS spectra for uncoated carbon steel are shown in . They have an impedance modulus at the order of 103 Ω·cm2 and one time constant. The EIS spectra of carbon steel protected with the CNC reinforced composite coating, shown in , display high impedance modulus at the level of 108 Ω·cm2 at the lowest frequency and one time constant. The open circuit potential, OCP, value remains close to zero throughout the experiment (). Together, these findings suggest good barrier properties.
Figure 1. Bode plots of EIS spectra of (a, b) bare carbon steel; (c, d) carbon steel protected by a CNC reinforced composite coating, and (e, f) carbon steel coated with a CNF reinforced composite. The lines are fitted spectra.
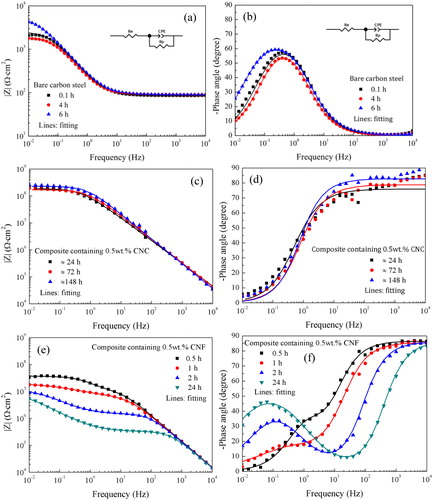
Table 1. Open circuit potential (OCP) of composite coatings and bare carbon steel.
In contrast, EIS spectra of carbon steel samples covered by the CNF reinforced composite coating, , show significantly lower impedance modulus at the lowest frequency and two time constants. Further, the OCP values () for these samples are close to that for bare carbon steel (below −0.5 V vs. Sat. Ag/AgCl). Clearly, the data for the CNF containing composite suggest coating failure and ongoing electrochemical processes at the metal/coating interface. Indeed, corrosion products could be observed on certain locations at the termination of measurement for these samples. The formed corrosion products can be responsible for the slight increase of the OCP value over time, as shown in .
In order to quantitatively analyze the barrier performance of the composite coatings, equivalent circuits were fitted to the measured EIS spectra. When one time constant was observed, as for the CNC composite coating, the equivalent circuit shown in was used as appropriate for a homogenous barrier layer. In contrast, for situations where two time constants were observed, both equivalent circuit 2b and 2c could provide satisfactory match to the experimental data. Equivalent circuit 2b represents a barrier layer with pore defects combined with an electrical double-layer at the coating-metal interface, whereas equivalent circuit 2c represents two parallel and homogeneous layers. As will be shown below, the CNF reinforced composite coating contains some voids, which could act as short paths for electrolyte penetration towards the substrate and later lead to localized corrosion. Therefore, by considering the microstructure of the studied sample, we judge equivalent circuit 2b to be most appropriate for fitting the EIS spectra for the composite coating containing CNF. EIS spectra of carbon steel were also fitted using the equivalent circuit in as suitable for a homogenous metal oxide layer. The fitting results are shown in . Fitting results for other parallel samples of CNF composite coatings can be found in the supporting information.
Figure 2. Equivalent circuits used for fitting of EIS spectra with one time constant (a) and with two time constants (b, c).
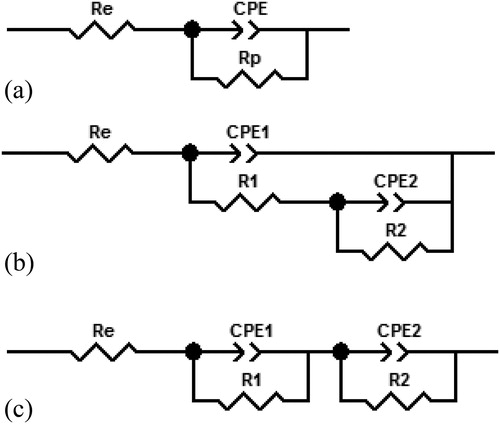
In the equivalent circuits, R
e represents the electrolyte resistance between the reference electrode and the working electrode (the coated carbon steel sample). CPE is a constant phase element representing the non-ideal capacitive response of the composite coating layer. The definition of CPE is(1)
(1) in which Y
0 is a constant, n (0 ≤ n ≤ 1) is a factor that indicates the homogeneity of the surface or interface.[
Citation
25
]
Y
0 represents a pure resistor if n = 0, while it represents a pure capacitor if n = 1. In , CPE1 represents the CNF reinforced composite coating and CPE2 the electrical double layer formed between the composite and metal surface due to electrolyte penetration. R
1 is the coating resistance and R
2 is the charge transfer resistance for charged species passing through the above mentioned electrical double layer.
The polarization resistance is defined as:(2)
(2) which is independent of the equivalent circuits used for spectra fitting. Thus, a visual inspection of is sufficient for concluding that the polarization resistance is more than an order of magnitude higher for the composite containing CNC than for that containing CNF. For the CNC reinforced composite coating R
p is dominated by the coating resistance, while for the CNF reinforced composite coating R
p is affected by both the coating resistance and charge transfer resistance due to the similar value of R
1 and R
2 (see ).
Table 2. Data of resistive properties for the composite coatings and bare carbon steel extracted by fitting EIS spectra.
The corrosion resistance of the composite coatings was compared by utilizing the fitting parameter R p. The results for bare carbon steel and CNC reinforced composite coating are shown in . The Rp-value for bare carbon steel is as expected very low, a few kΩ·cm2. It increased somewhat after 6 hours owing to accumulation of corrosion products on the surface. For the composite coating containing CNC, at the beginning of exposure the R p-value is 2.2 ± 0.2 x 10⁸ Ω·cm2, and it remains at a similar level at the end of the one-week exposure. The OCP value also remains stable and significantly larger than for bare carbon steel as shown in . These observations demonstrate stable barrier performance. As reported previously, both R p and OCP presented good long-term stability during exposure to 0.1 M NaCl solution for 35 days.[ Citation 15 ] The R p-values for the CNF reinforced composite coating are shown in . It shows that the measured polarization resistance is at the level of 107 Ω·cm2. It gradually decreases with time and after one day it has decreased by more than a factor of 2. The OCP values are correspondingly close to that of uncoated carbon steel. The slight increase of the OCP value over time could be attributed to the formation of corrosion products at defect sites. Clearly, the CNF reinforced composite coating cannot provide barrier protection for carbon steel.
The water uptake of the barrier coating is another important factor for its protective performance. This aspect can be investigated by measuring the coating capacitance. By definition(3)
(3) in which
is the relative dielectric constant of the coating while
is the permittivity of vacuum, A is the exposed surface area (1 cm2), and d is the thickness of the coating (20 µm). For an organic coating
is in the range of 4–8, while for water it is approximately 80 at 20 °C. Due to this large difference in dielectric constant, the coating capacitance will increase when water is absorbed.
In the utilized equivalent circuits, CPE can be seen as a non-ideal capacitance (the exponent n is close to one), and the conversion between Y
0 of the constant phase element and the capacitance C is provided in EquationEq. 4(4)
(4) .[
Citation
26
]
(4)
(4)
Here, is the frequency corresponding to the maximum of the imaginary part of the impedance. In this work, we used Y
0 to assess the water uptake since the value of n is close to 1 and thus Y
0 is close to C. For this aim, Y
0 was extracted by fitting only the linear part of the Bode modulus vs frequency (log-log) plot at high frequencies (). This was judged to be most appropriate since two different equivalent circuits were needed for analyzing the data.
The fitted Y0-values for both composite coatings are shown in . The value of Y 0 for the CNC reinforced composite coating is close to constant during the one week exposure, and a similar result was found for the matrix coating without cellulose additives.[ Citation 15 ] In contrast, the Y 0-value increases over time for the CNF containing composite coatings. This shows that the water up-take of the CNC reinforced composite coating is very limited while the CNF reinforced composite coating cannot effectively inhibit water penetration. The difference in water absorption of these two composite coatings contribute to the difference in R p-value since water penetration facilitates the transport of corrosive species from the electrolyte to the metal surface.
Table 3. Values of Y 0 and n for carbon steel protected by the composite coatings.
Top surface morphology
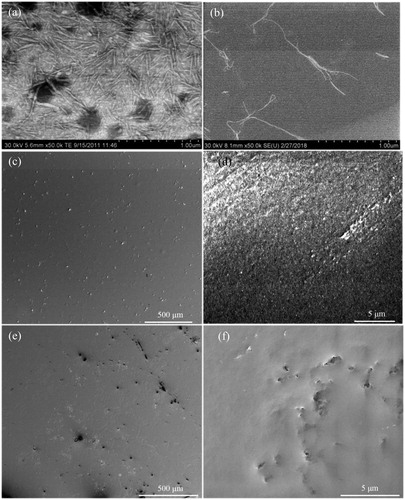
shows the morphologies of the CNC particles and CNF used in this work. The top surface morphologies of the two nanocomposite materials as visualized by SEM are reported in . suggests that the surface of the CNC reinforced composite is flat with homogeneously distributed particles on the surface. These particles might be CNC aggregates with diameters less than one micrometer. Also at higher magnification, , the surface appears homogeneous without any voids. In contrast, the surface of the CNF reinforced composite coating () contains defects, which could facilitate the penetration of water and corrosive species, resulting in poor barrier performance. The CNF distribution on the surface appears relatively homogeneous, but some aggregates with a size of several micrometers can be observed.
Figure 3. Scanning electron microscopy (SEM) topography images of the surface of (a, b) CNC and CNF; (c, d) CNC reinforced composite coatings and (c, d) CNF reinforced composite coating.
Cross-section images
show that the thickness of both composite coatings was around 20 µm. The magnetic properties of carbon steel limit the achievable magnification in our SEM, as discussed previously.[ Citation 15 ] For that reason, we prepared coatings on glass substrates in order to visualize the cross-section morphology of the composite coatings with as much structural information as possible. The bulk microstructure of CNC and CNF reinforced composite coatings are illustrated in in such cross-section images.
Figure 4. SEM cross-section images of (a) CNC reinforced composite coating on carbon steel and (b) CNF reinforced composite coating on carbon steel; (c, d) CNC reinforced composite coating on glass and (e, f) CNF reinforced composite coating on glass.
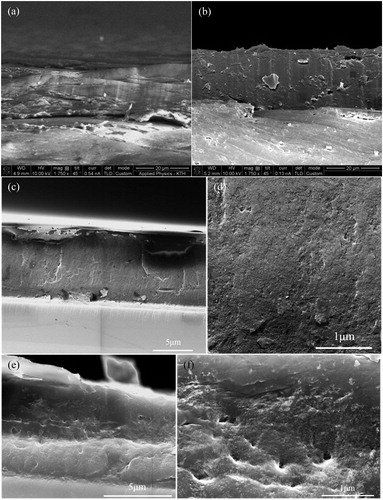
The local magnified images of the CNC reinforced composite coating in reveals a dense structure, which is favorable for a good barrier coating. In contrast, for the CNF reinforced composite coating in , some voids with diameters below 150 nm are observed, reducing the protective properties of the barrier coating. The long CNF fibrils and their high flexibility facilitate the formation of bridging nanofibrils and entanglements,[ Citation 27 , Citation 28 ] which appears to result in voids in both topography and cross-section images. However, it cannot be excluded that some of these defects have been created during the cutting process where the presence of CNF aggregates has resulted in high local stresses.
The differences in bulk microstructure of the two nanocomposites is consistent with the better corrosion protection performance of the CNC reinforced composite coating compared to that of the composite with CNF.
Water contact angle
Changes in water contact angles with time can be due to water evaporation, water penetration and reorientation of surface groups.[ Citation 29 ] In order to assess the relative importance of these effects on our nanocomposite coatings we compared the time dependence of the water contact angle on these surfaces with that on a glass surface silanated with (3, 3-dimethylbutyl)dimethylchlorosilane where no water penetration or reorientation of surface groups are operative. The water contact angle on a freshly prepared carbon steel sample was below 10°. The initial water contact angle of the CNC reinforced composite coating is similar to that of the matrix coating,[ Citation 15 ] whereas a slightly lower contact angle is observed on the coating containing CNF (), suggesting the presence of a larger number density of hydrophilic groups on the CNF-containing nanocomposite surface.
Figure 5. (a) Water contact angle, (b) water droplet baseline diameter d normalized by d0, the base diameter at t = 15 s, (c) Change in droplet volume, ΔV, normalized by the air-water surface area, A, of the droplet. Measurements were carried out on composite coatings with 0.5 wt.% CNF (black squares); composite coatings with 0.5 wt.% CNC (red circles); and glass surfaces silanated with (3,3-dimethylbutyl)dimethylchlorosilane (blue triangles). Time zero is defined as the moment the droplet was placed on the surface.
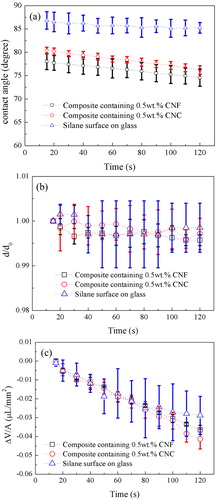
The contact angle decreases slightly with time on all three surfaces, and more so on the nanocomposite coatings than on silanated silica. On the silanated silica surface no water penetration into the surface is possible, and the silane monolayer is covalently attached and contains only non-polar groups so the effect of reorientation of polar groups can also be ignored. Thus, the main reason for the decrease in contact angle in this case is evaporation of water from a pinned water droplet, as confirmed by the observation that the base diameter remains constant (). In we show the change in water droplet volume, ΔV, normalized by the water-air interfacial area, A, for the droplet resting on the silanated surface. This quantity should to a first approximation be independent of the droplet size since evaporation occurs similarly over the air-water interface area, and we find no size dependence over the droplet sizes (≈1–4 µL) used in our experiments. The spread in the data rather arises from uncertainties in the measurements of the base diameter and droplet height.
The water droplet resting on the nanocomposite coatings are also pinned (), and the quantity ΔV/A is similar to what was found on silanated glass (). This implies that the major reason for the decrease in contact angle with time also on the nanocomposite surface is water evaporation. However, there is a hint of larger change in ΔV/A on the nanocomposite coatings so some water penetration into the coating surface cannot be excluded. We see no difference between nanocomposite coatings containing CNF and CNC in this respect. Thus, on short time scales the water penetration rate is similar, whereas on a longer time scale EIS data show larger water penetration into the composite coating containing CNF ().
FTIR
The FTIR absorbance spectra of CNC and CNF are displayed in , and the corresponding spectra for the matrix coating and the two composite coatings are shown in . The detailed band assignment for CNC and the matrix coating can be found in our previous works.[ Citation 15 , Citation 23 ] The band at 1600 cm−1 has been found also for other cellulose materials and been interpreted as being due to water[ Citation 30 ] or the combination of water and carbonyl vibrations.[ Citation 22 ]
Figure 6. FTIR spectra of (a) CNC (black) and CNF (red), (b) matrix coating (green), CNF reinforced composite coating (dark cyan) and CNC reinforced composite coating (brown).
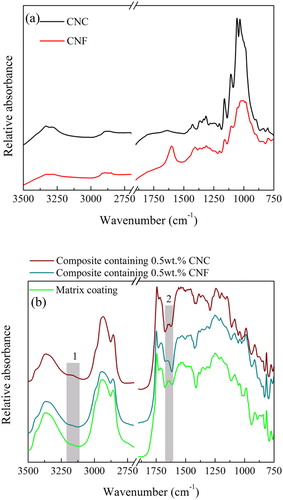
Here we focus on discussing the differences between the two composite coatings with the aim to connect them to their corrosion protection properties. The interesting difference is that a new weak band located at 3130 cm−1 only appeared in the spectrum of the CNC reinforced composite coating (marked 1 ). As discussed previously,[ Citation 15 ] the band located at 3130 cm−1 is indexed to strong hydrogen bonding interactions between CNC and matrix coating. Thus, the FTIR spectra show evidence for strong interactions between CNC and the matrix coating, but no such features can be observed for CNF in the matrix coating. The band at 1600 cm−1 found for CNF () appears to be present also in the CNF containing composite (, region 2), but it is not very pronounced due the presence of other bands at similar wavenumbers.
Conclusions
By using electrochemical impedance spectroscopy, the polarization resistance and water uptake of composite coatings reinforced by CNC, or, alternatively, by CNF were investigated. The results show that the CNC reinforced composite coating is a good barrier coating with high and stable polarization resistance and open circuit potential and no or very limited water absorption during the time of exposure. In contrast, the CNF reinforced composite coating shows one order of magnitude lower polarization resistance, which rapidly decreases with time. Thus, the CNF reinforced composite coating cannot provide good barrier performance even for a limited amount of time. Consistently, the effect of water penetration in the CNF composite coating is readily observed in the EIS spectra.
There are several reasons for this difference in corrosion protection performance. First, SEM images illustrate that the CNF reinforced composite coating has voids both on the surface and in bulk due to high aspect ratio and entanglement of cellulose fibrils, while the CNC reinforced composite coating shows a dense and homogeneous microstructure both in topography and cross-section images. Second, and presumably of less importance, the water contact angle on the composite coating containing CNF is slightly lower than that on the composite coating containing CNC, indicating that the former composite has a slightly more hydrophilic surface due to higher additive concentration at the top surface layer. Third, FTIR reveals that strong hydrogen bonding between matrix and nanofiller is only observed for the CNC reinforced coating. All these features combine to contribute to the vastly different protective properties of the composite coating reinforced by CNC as compared to that of the coating with CNF. In addition to this we also note the higher degree of crystallinity of CNC compared to CNF and the higher surface density of introduced polar groups on our CNF compared to our CNC. Here the higher surface density of introduced polar groups on CNF and particularly the amorphous regions of CNF could facilitate interactions with and transport of water through the coating and this would be a drawback in a corrosion protection application. We also note that the better corrosion protection performance of the CNC containing composite does not mean that CNC necessarily performs better than CNF for mechanical reinforcement, and indeed often the reverse is observed.[ Citation 28 ] Rather, a good corrosion protection performance requires prevention of diffusion of water and ions through the coating, and here even limited aggregation due to the high aspect ratio of CNF appears to be detrimental. This work extends the knowledge of nanocellulose reinforced composite barrier coatings for corrosion protection of metals.
Supplemental Material
Download MS Word (9.3 MB)Acknowledgements
China Scholarship Council (CSC) is acknowledged for financing Yunjuan He’s PhD study at KTH. PTE coatings AB Gamleby, Sweden is acknowledged for providing the polymer matrix dispersion. PhD student Gen Li at the division of surface and corrosion science, KTH is thanked for preparing silanated glass surfaces. This research did not receive any specific grant from funding agencies in the public, commercial, or not-for-profit sectors.
Data availability
The authors confirm that the data supporting the findings of this study are available within the article [and/or] its supplementary materials.
Disclosure statement
No potential conflict of interest was reported by the authors.
References
- Lin, N. ; Dufresne, A. Nanocellulose in Biomedicine: Current Status and Future Prospect. Eur. Polym. J. 2014, 59 , 302–325. DOI: 10.1016/j.eurpolymj.2014.07.025.
- Roman, M. Toxicity of Cellulose Nanocrystals: A Review. Ind. Biotechnol. 2015, 11 , 25–33. DOI: 10.1089/ind.2014.0024.
- Ilyas, R. ; Sapuan, S. ; Sanyang, M. L. ; Ishak, M. R. ; Zainudin, E. Nanocrystalline Cellulose as Reinforcement for Polymeric Matrix Nanocomposites and Its Potential Applications: A Review. Curr. Anal. Chem. 2018, 14 , 203–225. DOI: 10.2174/1573411013666171003155624.
- Habibi, Y. ; Lucia, L. A. ; Rojas, O. J. Cellulose Nanocrystals: Chemistry, Self-Assembly, and Applications. Chem. Rev. 2010, 110 , 3479–3500. DOI: 10.1021/cr900339w.
- Wu, X. ; Moon, R. J. ; Martini, A. Crystalline Cellulose Elastic Modulus Predicted by Atomistic Models of Uniform Deformation and Nanoscale Indentation. Cellulose 2013, 20 , 43–55. DOI: 10.1007/s10570-012-9823-0.
- Dri, F. L. ; Hector, L. G. ; Moon, R. J. ; Zavattieri, P. D. Anisotropy of the Elastic Properties of Crystalline Cellulose I β from First Principles Density Functional Theory with Van Der Waals Interactions. Cellulose 2013, 20 , 2703–2718. DOI: 10.1007/s10570-013-0071-8.
- Cheng, Q. ; Wang, S. ; Harper, D. P. Effects of Process and Source on Elastic Modulus of Single Cellulose Fibrils Evaluated by Atomic Force Microscopy. Composites Part A. 2009, 40 , 583–588. DOI: 10.1016/j.compositesa.2009.02.011.
- Miao, C. ; Hamad, W. Y. Cellulose Reinforced Polymer Composites and Nanocomposites: A Critical Review. Cellulose 2013, 20 , 2221–2262. DOI: 10.1007/s10570-013-0007-3.
- Dufresne, A. Nanocellulose: From Nature to High Performance Tailored Materials . Walter de Gruyter GmbH & Co KG: Berlin, 2017.
- Eichhorn, S. J. ; Dufresne, A. ; Aranguren, M. ; Marcovich, N. E. ; Capadona, J. R. ; Rowan, S. J. ; Weder, C. ; Thielemans, W. ; Roman, M. ; Renneckar, S. ; et al. Current International Research into Cellulose Nanofibres and Nanocomposites. J. Mater. Sci. 2010, 45 , 1–33. DOI: 10.1007/s10853-009-3874-0.
- Moon, R. J. ; Martini, A. ; Nairn, J. ; Simonsen, J. ; Youngblood, J. Cellulose Nanomaterials Review: Structure, Properties and Nanocomposites. Chem. Soc. Rev. 2011, 40 , 3941–3994. DOI: 10.1039/c0cs00108b.
- Moon, R. J. ; Schueneman, G. T. ; Simonsen, J. Overview of Cellulose Nanomaterials, Their Capabilities and Applications. JOM 2016, 68 , 2383–2394. DOI: 10.1007/s11837-016-2018-7.
- Ma, I. A. W. ; Shafaamri, A. ; Kasi, R. ; Zaini, F. N. ; Balakrishnan, V. ; Subramaniam, R. ; Arof, A. K. Anticorrosion Properties of Epoxy/Nanocellulose Nanocomposite Coating. Bioresources 2017, 12 , 2912–2929. DOI: 10.15376/biores.12.2.2912-2929.
- El-Fattah, M. A. ; Hasan, A. M. ; Keshawy, M. ; El Saeed, A. M. ; Aboelenien, O. M. Nanocrystalline Cellulose as an Eco-Friendly Reinforcing Additive to Polyurethane Coating for Augmented Anticorrosive Behavior. Carbohyd. Polym. 2018, 183 , 311–318. DOI: 10.1016/j.carbpol.2017.12.084.
- He, Y. ; Boluk, Y. ; Pan, J. ; Ahniyaz, A. ; Deltin, T. ; Claesson, P. Corrosion Protective Properties of Cellulose Nanocrystals Reinforced Waterborne Acrylate-Based Composite Coating. Corros. Sci. 2019, 155 , 186–194. DOI: 10.1016/j.corsci.2019.04.038.
- Beck, S. ; Bouchard, J. ; Berry, R. Dispersibility in Water of Dried Nanocrystalline Cellulose. Biomacromolecules 2012, 13 , 1486–1494. DOI: 10.1021/bm300191k.
- Abitbol, T. ; Kloser, E. ; Gray, D. G. Estimation of the Surface Sulfur Content of Cellulose Nanocrystals Prepared by Sulfuric Acid Hydrolysis. Cellulose 2013, 20 , 785–794. DOI: 10.1007/s10570-013-9871-0.
- Beck-Candanedo, S. ; Roman, M. ; Gray, D. G. Effect of Reaction Conditions on the Properties and Behavior of Wood Cellulose Nanocrystal Suspensions. Biomacromolecules 2005, 6 , 1048–1054. DOI: 10.1021/bm049300p.
- Boluk, Y. ; Zhao, L. ; Incani, V. Dispersions of Nanocrystalline Cellulose in Aqueous Polymer Solutions: Structure Formation of Colloidal Rods. Langmuir 2012, 28 , 6114–6123. DOI: 10.1021/la2035449.
- Oguzlu, H. ; Boluk, Y. Interactions between Cellulose Nanocrystals and Anionic and Neutral Polymers in Aqueous Solutions. Cellulose 2017, 24 , 131–146. DOI: 10.1007/s10570-016-1096-6.
- Boluk, Y. ; Danumah, C. Analysis of Cellulose Nanocrystal Rod Lengths by Dynamic Light Scattering and Electron Microscopy. J. Nanopart. Res. 2014, 16 , 2174. DOI: 10.1007/s11051-013-2174-4.
- El Bakkari, M. ; Bindiganavile, V. ; Goncalves, J. ; Boluk, Y. Preparation of Cellulose Nanofibers by TEMPO-Oxidation of Bleached Chemi-Thermomechanical Pulp for Cement Applications. Carbohyd. Polym. 2019, 203 , 238–245. DOI: 10.1016/j.carbpol.2018.09.036.
- He, Y. ; Dobryden, I. ; Pan, J. ; Ahniyaz, A. ; Deltin, T. ; Corkery, R. W. ; Claesson, P. M. Nano-Scale Mechanical and Wear Properties of a Waterborne Hydroxyacrylic-Melamine anti-Corrosion Coating. Appl. Surf. Sci. 2018, 457 , 548–558. DOI: 10.1016/j.apsusc.2018.06.284.
- Saxon, R. ; Lestienne, F. C. Curing Relations of Hexakis (Methoxymethyl) Melamine and Its Combinations with Acrylic Polymers. J. Appl. Polym. Sci. 1964, 8 , 475–488. DOI: 10.1002/app.1964.070080131.
- Growcock, F. ; Jasinski, R. Time-Resolved Impedance Spectroscopy of Mild Steel in Concentrated Hydrochloric Acid. J. Electrochem. Soc. 1989, 136 , 2310–2314. DOI: 10.1149/1.2097847.
- Hsu, C. ; Mansfeld, F. Concerning the Conversion of the Constant Phase Element Parameter Y0 into a Capacitance. Corrosion 2001, 57 , 747–748. DOI: 10.5006/1.3280607.
- Saïd Azizi Samir, M. A. ; Alloin, F. ; Paillet, M. ; Dufresne, A. Tangling Effect in Fibrillated Cellulose Reinforced Nanocomposites. Macromolecules 2004, 37 , 4313–4316. DOI: 10.1021/ma035939u.
- Xu, X. ; Liu, F. ; Jiang, L. ; Zhu, J. ; Haagenson, D. ; Wiesenborn, D. P. Cellulose Nanocrystals vs. cellulose Nanofibrils: A Comparative Study on Their Microstructures and Effects as Polymer Reinforcing Agents. ACS Appl. Mater. Interfaces 2013, 5 , 2999–3009. DOI: 10.1021/am302624t.
- Wang, J. H. ; Claesson, P. ; Parker, J. ; Yasuda, H. J. L. Dynamic Contact Angles and Contact Angle Hysteresis of Plasma Polymers. Langmuir 1994, 10 , 3887–3897. DOI: 10.1021/la00022a080.
- Wei, L. ; Umesh, P. ; Kolby, C. ; Laurent, M. ; Ronald, C. ; Nicole, M. Chemical Modification of Nanocellulose with Canola Oil Fatty Acid Methyl Ester. Carbohydr. Polym. 2017, 169 , 108–116. DOI: 10.1016/j.carbpol.2017.04.008.