
 ?Mathematical formulae have been encoded as MathML and are displayed in this HTML version using MathJax in order to improve their display. Uncheck the box to turn MathJax off. This feature requires Javascript. Click on a formula to zoom.
Abstract
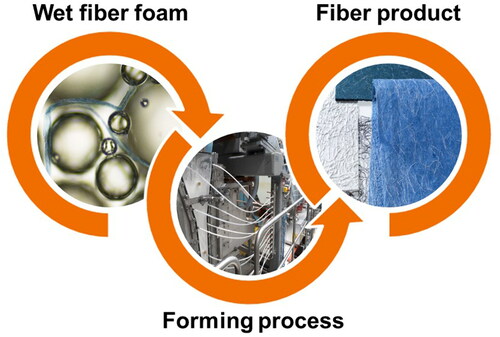
Aqueous foam can be used as a transfer medium to form lightweight materials from natural and man-made fibers together with other types of raw materials. This review discusses mechanisms that underlie the forming process and thus influence physical properties of formed fiber networks such as microporous structure, strength behavior, and transport properties. Homogeneous fiber materials can be formed from versatile raw materials, which makes the technology suitable for a vast range of product applications. An intriguing feature of the method is that the wet foam characteristics provide an additional tool to tailor the performance of the dried material. Understanding foam rheology and how that is affected by added fibers is important in developing the forming process. We introduce both fundamental foam properties and practical forming methods, and show how the material properties are affected by the foam–fiber interaction. The basic features of an industrial production process are also described. The potential material properties are compared against key requirements in typical product applications.
Graphical Abstract
1. Introduction
Foam forming is a process that enables the making of a variety of fiber products,[Citation1] ranging from paper[Citation2–6] and lightweight packaging[Citation7] to nonwoven fabrics[Citation8–10] and insulation,[Citation11–15] filtering[Citation13,Citation16,Citation17] and construction materials. In this method, the advantages of traditional water-forming technology are combined with the improved ability of handling very different kinds of raw materials such as long fibers[Citation10,Citation18] or particles with varied densities. Moreover, the foam process is generally efficient in terms of raw material, energy, and water use.[Citation11] Foam forming opens up the possibility to develop novel applications with accurate material layers, complex three-dimensional (3D) forms,[Citation19,Citation20] and tailored microstructures.[Citation21,Citation22]
The preparation of fiber products requires transferring fibers and attaching them together into a network structure. The most well-known example of this is papermaking, where the above basic operations guarantee an annual revenue of ca. USD 1000 billion for forest product industries. The 2000-year success of water forming comes from the fact that water acts simultaneously as a transfer medium and a glue for natural cellulose fibers. Because these fibers are hydroscopic and hydrophilic, water is able to swell and soften them to the extent that mechanical entanglement and short-range (<nm) interactions can bind their fibril surfaces tightly together. The result is a strong but light, sustainable, and biodegradable material such as paperboard.
A drawback to water affinity is the tendency of fibers to flocculate, showing up as heterogeneity in the formed material. A classic solution to partly avoid this problem is to create turbulent flow that breaks large flocs. This implies that a fiber network forms via a random deposition process. This leaves one with very limited control over structural details, such as pore-size distribution, fiber orientation, or local density. The consequence is that water-formed materials, despite their very large total market, are limited mainly to applications where strength is the key product property.
Foam forming keeps water as a gluing element, but solves the flocculation problem by using the bubble structure and rheological properties[Citation23] of wet foam to keep fibers apart. Thus, the flow of foam during forming can even be laminar, still providing control over the distribution and orientation[Citation24,Citation25] of the fibers. Moreover, foam stability affects final material density,[Citation12] and the average pore size can be tailored by adjusting the bubble size.[Citation21] In other words, the foam itself provides a new toolbox for material engineering. This toolbox includes factors like air content, bubble size, foam stability and rheology, surface area, and air–water interface properties such as strength, elasticity, and adhesion.
A challenge in using the foam toolbox is that there are several mutual interactions between foam and fibers. In particular, adding fibers to the wet foam usually affects the bubble size,[Citation26,Citation27] stability,[Citation28–30] rheology,[Citation23] and drainage[Citation28] of the foam. Thus, it is highly important to understand these interactions[Citation31] and take them into account in the forming process.
The type of forming method discussed here is not the only industrial process where foam plays an integral part in the production concept. Wet foams are extensively used, for example, in foods and cosmetics. As for material applications, wet foams are used to produce porous biomaterials[Citation32] and ceramics,[Citation33,Citation34] and one of the most common applications of dry foams is found in the foam extrusion and foam injection molding of polymer composites.[Citation35] Besides foam forming, foam coating is also being developed at the moment.[Citation36] In order to avoid severe moistening of the coated material, the air content of the foam is usually much higher (above 90%) in coating than in foam forming (below 80%). There are different foam generation methods, which give further options when developing these technologies. Here, we limit ourselves to the most typical of them – mixing and air injection – which lead to somewhat different bubble size distributions and thus can complement one another in fundamental studies and real industrial processes.
The structure of this review is as follows: In Section 2, we discuss the structural and rheological properties of wet foams as such and with added fibers. Section 3 follows this up with a brief description of the laboratory forming methods and of the way the interaction between foam and fibers becomes visible in the process. Section 4 gives an overview of an analogous industrial production process. Section 5 considers traces of the forming method in the microporous structure and their effects on properties of the dried fiber material. Section 6 summarizes how these specific properties can be used as assets in various product applications. Finally, Section 7 provides a brief summary of the key aspects of the technology and points out future research directions.
2. Properties of wet (fiber) foams
2.1. Structure of foams
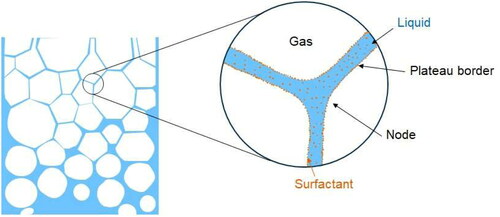
Foam is a multi-phase system consisting of dispersed gas bubbles, a continuous liquid phase, and surfactants ().[Citation37] The role of surfactants is to stabilize the foam by lowering the surface tension between the gas and liquid phases. Emulsion, on the other hand, is a mixture of two (or more) liquids that are normally immiscible. Foams and emulsions are both stabilized by surfactant molecules that are adsorbed at the interfaces, and they have similar aging mechanisms. They also exhibit similar rheological behavior, and a scientific result obtained for one is often applicable to the other.[Citation38]
Figure 1. The general structure of foams. Gas bubbles are surrounded by liquid that carries surfactant molecules. These molecules adhere to the liquid-gas interphase, improving its stability.
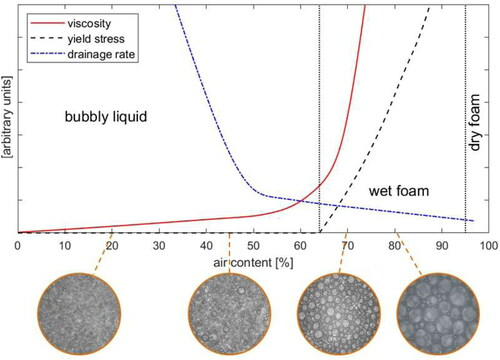
Depending on their air content aqueous foams are classified into three regions: bubbly liquids, wet foams, and dry foams (). In bubbly liquids, the bubbles are relatively free to move and the system can be considered as an aqueous suspension of bubbles. When air content exceeds the critical air content
0.64, a random monodisperse foam experiences a “jamming transition”, familiar from granular materials.[Citation39] Due to jamming, wet and dry foams have a yield stress, below which they behave elastically.
Figure 2. Aqueous foams are classified into three regions: bubbly liquids, wet foams, and dry foams. The curves show the qualitative behavior of foam viscosity (with a constant shear rate), yield stress, and drainage rate as the function of air content at a constant temperature. The foam experiences a jamming transition at ≈ 0.64. Above this air content, the foam has a yield stress. The distinction between wet and dry foams is not uniquely defined.
One distinction between wet and dry foams comes from the shape of bubbles. Because of the lack of external shear forces, the bubbles are perfectly spherical in bubbly liquids, approximately spherical in wet foams, and dominantly polyhedral in dry foams. As the shape of bubbles deforms gradually with increasing air content, the distinction between wet and dry foams is not uniquely defined. For example, Drenckhan and Hutzler[Citation40] and Sun et al.[Citation41] suggest = 0.85 and
= 0.88 as the transition value, respectively. As classical foam research is dominated by very dry foams, many sources have a much higher limit for dry foams as, for example,
= 0.99 given by Weaire et al.[Citation42] On the other hand, the air content in reported foam-forming studies varies in the range of 30–80%, being typically 50–70%. Therefore, the foams used in foam forming are either bubbly liquids or wet foams.
In addition to air content, the bubble size (or bubble size distribution) is another important parameter for characterizing foams. For each bubble diameter distribution (
one can calculate a volume average diameter DV,
[1]
[1]
which is related to the number of bubbles, and a volume-surface or Sauter diameter DS[Citation43]
[2]
[2]
which is related to the total interfacial area per unit volume. The flow behavior is dominated by DV for dilute emulsions and by DS for concentrated emulsions.[Citation44] In this review, we mostly consider the Sauter diameter, denoting it as D. In foams used generally for foam forming, DS varies typically in the range of 50–150 μm.[Citation45]
Another important parameter is the half-life time of the foam, that is, the time during which half of the foam volume has drained away as water. Traditionally, rather stable foams have been preferred in foam forming with a half-life time of typically several minutes.[Citation45] Half-life time increases with increasing air content and decreasing bubble size. These in turn can be controlled by mixing energy and the concentration of surfactant. Half-life time can be increased by decreasing temperature, increasing the viscosity of the fluid, or by using a foam stabilization chemical.
The bubble size, air content, and half-life time of foams used in forming depend on many process parameters such as generation method (tank and/or in-line generation), device geometry, mixing power and duration, surfactant type and dosage, and fiber consistency.[Citation26,Citation27,Citation45,Citation46] Here, the term consistency refers to the mass fraction of the solid fibers in the water suspension before mixing the foam. Some of these complex dependencies are discussed in Section 3.
shows two images of wood fibers in foam. We see that the spatial restrictions due to bubbles affect the location, shape, and orientation of fibers, but the fibers do not penetrate through the bubble interfaces. In some bubbles appear to be attached to fibers. This indicates that bubbles have an affinity to fiber surfaces.[Citation31,Citation47] The fibers inside the foam are thus locked between the bubbles so that direct collisions between fibers become rarer. This is the key mechanism that explains the improved homogeneity (in papermaking called “formation”[Citation48]) achieved with foam forming as compared to the water forming process.
Figure 3. Wood fibers in foam. The spatial restrictions due to bubbles affect the location, shape, and orientation of the fibers. Reprinted with permission from Ref. [Citation45].
![Figure 3. Wood fibers in foam. The spatial restrictions due to bubbles affect the location, shape, and orientation of the fibers. Reprinted with permission from Ref. [Citation45].](/cms/asset/5c93c090-8ee7-4bcd-8aee-271fdfd64eef/ldis_a_1869035_f0003_c.jpg)
2.2. Drainage and stability of foams
Foam drainage depends generally on the rate of liquid flow downwards due to gravity, coarsening (increase in average bubble size due to pressure-difference-driven gas diffusion from small to large bubbles), and the rate of foam destruction due to bubble coalescence. In wet and dry foams, liquid moves during drainage through a rigid bubble matrix; in bubbly liquids bubbles are relatively free to move and the drainage can (initially) also be considered as an upward motion of bubbles due to hydrostatic pressure. The foam drainage plays an important role in foam stability. When the foam dries, the liquid films become thinner and they can break, leading to the foam collapse. Unfortunately, most drainage studies have concentrated on foams with air content higher than 80% and are not directly applicable to foams used for foam forming.[Citation41,Citation49–51]
In dry foams, the liquid is located between the bubbles in the Plateau borders and in the nodes connecting them (). Stevenson[Citation52] used dimensional analysis to show that when inertial effects, coarsening, and coalescence are neglected, the dimensionless drainage rate of homogeneous foams follows a power law
[3]
[3]
where
is liquid volume fraction,
is drainage rate,
is the viscosity of the surfactant solution,
is the density of liquid, g is acceleration due to gravity, and D is the average bubble diameter. The values of the dimensionless parameters m and n depend on the relative strength of viscous losses in the Plateau borders (due to surface shear viscosity) to viscous losses in the nodes (as a result of shear viscosity).
Stevenson found that EquationEquation (3)[3]
[3] worked very well with experimental data sets of various foams found in the literature (here liquid volume fraction was always smaller than 0.2). For various foams made with anionic sodium dodecyl sulfate (SDS) surfactant, the fitted value of n was approximately 2 and m varied between 0.01 and 0.02. In the work of Koponen et al.,[Citation45] drainage was studied at laboratory scale with bubbly liquids and wet SDS foams, with softwood fibers included. It was discovered that EquationEquation (3)
[3]
[3] also worked in the range of
The drainage rate thus seems to follow EquationEquation (3)
[3]
[3] whenever the liquid volume fraction is smaller than 0.5. With higher liquid volume fractions, the qualitative behavior of the drainage changes, and the drainage rate increases rapidly with increasing liquid fraction ().[Citation45]
Koponen et al.[Citation45] also studied the drainage of foams in pilot conditions with softwood fibers included. SDS concentration was varied in the interval 10–180 ppm, and air content in the range of 30–70%. It was found that the half-life time of the process foam followed the power law
[4]
[4]
where
is the SDS content in ppm, and
= 0.33,
= 50 and n = 1.9 are regression coefficients. Note that even though the air content changes during the half-life time measurement, this result is similar to EquationEquation (3)
[3]
[3] ; even the obtained value of power n is similar. It is likely that in EquationEquation (4)
[4]
[4] the effect of SDS content on the half-life time was largely due to it affecting the bubble size.
The foam and emulsion stability has been studied quite a lot in the presence of small particles. In that case, they are called Pickering foams/emulsions.[Citation53] However, in addition to the results discussed above,[Citation45] there are only a few studies where the stability of fiber-laden foams has been studied. Mira et al.[Citation46] studied foams made with SDS and six other surfactants. They also studied similar foams with added chemithermomechanical (CTMP) fibers at 1.5 wt%. Examples of drained liquid volumes as a function of time are shown for various pure SDS foams and SDS–CTMP foams in . The stability of foam improved with increasing SDS concentration, until the critical micelle concentration was exceeded. The presence of fibers was found to slow down the drainage.
Figure 4. Time-evolution of drained liquid volume of (a) pure SDS foams and (b) foams with added chemithermomechanical (CTMP) fibers. The volume of the foaming liquid was 3 l. Critical micelle concentration was 2.3 g/l. Reprinted with permission from Ref. [Citation46]. The measurement setup is shown in (c), where drained liquid is seen in the bottom of the vessel.
![Figure 4. Time-evolution of drained liquid volume of (a) pure SDS foams and (b) foams with added chemithermomechanical (CTMP) fibers. The volume of the foaming liquid was 3 l. Critical micelle concentration was 2.3 g/l. Reprinted with permission from Ref. [Citation46]. The measurement setup is shown in (c), where drained liquid is seen in the bottom of the vessel.](/cms/asset/f7eadba2-2d42-47ca-b2df-f07e4405a90e/ldis_a_1869035_f0004_c.jpg)
Li et al.[Citation54] made fiber-laden foams from unrefined pine fibers by using water-soluble modified lignin as a foaming agent. The fibers increased the stability of the foam significantly: The half-life time of fiber-laden foams (at 0.6% concentration) was 10 times that of the pure foam. This behavior was accounted for by fibers limiting bubble collapse and the smaller bubble size of the fiber-laden foams.
Haffner et al.[Citation28] studied the drainage of SDS foams with bleached Kraft fibers up to 2% mass concentrations. They found that during the first five minutes, the observed slowdown of drainage with the presence of fibers was due to the corresponding foams having a decreased bubble size. With higher drainage times, the presence of fibers was found to slow down drainage considerably.
We can conclude that at low fiber consistencies (a few percent), the total area of fiber surfaces is very small when compared to the bubble surfaces. The viscous friction caused by fibers is thus minimal when compared to viscous losses due to bubble surfaces – at least during the initial part of drainage. Later fibers slow down drainage by limiting the coarsening and coalescence of bubbles due to attraction between the fibers and bubbles.
The stability of fiber-laden foams can be improved, not only with a higher surfactant concentration but also by including new substituents to the foam. Cervin et al.[Citation55] studied the effect of octylamine-coated, rod-shaped nanofibrillated cellulose on the stability of foam. The lifetime of the aqueous foam was significantly longer compared to that of a non-stabilized foam. They were able to make cellulose-based material with a porosity of 98% without freeze drying (FD). Also in Ref. [Citation56] foams containing cellulose nanofibers (CNF) were found to have improved stability due to CNF forming aggregates in the Plateau borders and nodes of the foam, which slowed down liquid drainage and bubble growth and thus improved foam stability.
2.3. Rheology
The rheology of foams has been a topic of intensive research for a long time.[Citation57–62] However, the studies have concentrated on dry foams. There is much less information on wet foams and bubbly liquids. Fortunately, rheological results obtained for emulsions can usually also be applied to foams.[Citation38,Citation63,Citation64]
The accurate measurement of foam rheology is often challenging due to drainage of foam and slip flow on walls. For bubbly liquids, another problem is the tendency of bubbles to migrate to the upper parts of the measurement device due to hydrostatic pressure. The rheology of particle-laden foams has mainly been studied with small particles.[Citation65,Citation66] There are few studies where the particle size is similar to or bigger than the bubble size. The rheology of fiber-laden foams has only been studied by Jäsberg et al.[Citation23,Citation67]
The rheology of foams can be split into three parts: yield stress behavior, bulk rheology, and boundary layer behavior. All of these are important in practical applications.
2.3.1. Yield stress
Yield stress is a material property defined as the stress at which the material begins to deform plastically. Prior to the yield point, the material deforms elastically, returning to its original shape, when the (applied) stress is relaxed. Above the yield point, some structural changes are permanent and nonreversible. shows a typical stress–strain curve when a viscoplastic fluid, such as foam, is sheared slowly. When foam has yielded, the stress drops to a slightly lower limiting level.
Figure 5. When shearing foam slowly, the foam initially behaves elastically and stress increases linearly. Finally, a plastic limit is achieved, at which the first structural changes occur and the foam yields. When foam has yielded, the stress drops to a slightly lower level and the foam behaves like a liquid.[Citation42]
![Figure 5. When shearing foam slowly, the foam initially behaves elastically and stress increases linearly. Finally, a plastic limit is achieved, at which the first structural changes occur and the foam yields. When foam has yielded, the stress drops to a slightly lower level and the foam behaves like a liquid.[Citation42]](/cms/asset/822fdf95-077c-4d5f-899d-9fc1ce5dc9bf/ldis_a_1869035_f0005_c.jpg)
Jamming transition is the point when, for example, suspended bubbles in foam begin to have permanent contact with several of their neighbors. Monodisperse foam experiences a jamming transition when its air content exceeds = 64%, above which it has a yield stress, see .[Citation39] The above threshold corresponds to the maximum volume fraction of randomly packed identical spheres. In slightly polydisperse foams, which are typically generated by many foaming techniques,[Citation40] the critical air content increases slightly from 64%.[Citation68]
Rouyer et al.[Citation69] studied oscillatory flows of foams and foam flow on an inclined plane. Their measurement data could be described with the simple formula with A = 667 Pa. They also obtained excellent data collapse with earlier oscillatory studies when normalizing yield stress by the elastic shear modulus of foam, G0:
[5]
[5]
They argued that the observed differences between the yield stress values obtained from oscillatory data and those deduced from steady shear experiments were due to shear banding taking place in steady shear experiments. Note that the elastic shear modulus of foam increases with decreasing bubble size. Yield stress thus increases with decreasing bubble size.
2.3.2. Bulk rheology of foam
The bulk rheology of foam is a very complex phenomenon. It depends on many parameters such as air content, surfactant type and concentration, and bubble size. Moreover, as discussed above, foams may exhibit yield stress behavior, and bubbles may either stay approximately spherical or they may deform under shear. Due to high compressibility of foams, induced pressure may alter the foam behavior significantly.
Similarly to suspensions of non-Brownian spherical particles, the rheological behavior of foams with low and moderate air content ()[Citation70] is Newtonian when the bubble Reynolds number
[6]
[6]
is well below one,[Citation71] and the capillary number
[7]
[7]
is below 0.05.[Citation44] Here, D is the average bubble diameter,
is the viscosity of the continuum (liquid) phase,
is shear rate,
is the density of the continuum phase, and
is surface tension. The capillary number reflects the deformation of bubbles in the shear field. Subject to the above-mentioned limitations, the viscosity of foams can be described as a function of air content with equations derived originally for suspensions, or some modifications of them.[Citation72] One possibility is
[8]
[8]
where
is the relative viscosity of foam, and A is dimensionless constant.[Citation44,Citation73]
When Ca is non-negligible and the bubbles deform due to shear, Ca must be included in the rheological models. Llewellin et al.[Citation74] reviewed several datasets found in the literature and concluded that viscosity is largely independent of Ca when or
Viscosity is strongly dependent on Ca only in the narrow region where the dynamic regime changes (Ca
O(1)). shows as an example the prediction for
given by a foam model of Pal,[Citation75] used by Llewellin et al.[Citation74] for the analysis of the pipe flow of foam.
Figure 6. Viscosity behavior of wet foams: (a) Relative viscosity of foam with air content of 30% as a function of capillary number (Ca) given by a foam model of Pal.[Citation75] Viscosity is strongly dependent on Ca only in the narrow region where the dynamic regime changes (Ca O(1)). (b) Above the air content of 50%, viscosity and shear thinning behavior of foam increase rapidly with increasing air content.[Citation76]
![Figure 6. Viscosity behavior of wet foams: (a) Relative viscosity of foam with air content of 30% as a function of capillary number (Ca) given by a foam model of Pal.[Citation75] Viscosity is strongly dependent on Ca only in the narrow region where the dynamic regime changes (Ca ≈ O(1)). (b) Above the air content of 50%, viscosity and shear thinning behavior of foam increase rapidly with increasing air content.[Citation76]](/cms/asset/88810f8f-8d87-484d-b679-ffe46a043ced/ldis_a_1869035_f0006_c.jpg)
Above air content of 50%, viscosity and shear thinning behavior of foam increase rapidly with increasing air content ( and ). When the capillary number is small, the shear stress of foams, with a given air content, is then well represented by the Herschel–Bulkley equation
[9]
[9]
where
is shear stress,
is yield stress,
is shear rate, K is consistency index, and n is power law index. Yield stress is often omitted from EquationEquation (9)
[9]
[9] as it is typically small compared to the applied stress. One can then alternatively write
[10]
[10]
where
is suspension viscosity. shows as an example the viscosity of an SDS foam as a function of shear rate with air content of 70% together with corresponding fit by EquationEquation (10)
[10]
[10] .
Figure 7. Effect of added fibers on foam viscosity: (a) Viscosity vs. shear rate for pure foam, fiber-laden foam (2% hardwood), and 2.5% MFC-laden foam. Air content is 70%, bubble size is ca. 50 µm, temperature is 25 °C, and molar concentration of SDS is 8.5 mM/l.[Citation67] (b) VTT’s foam rheology measurement setup used for obtaining data of (a).
![Figure 7. Effect of added fibers on foam viscosity: (a) Viscosity vs. shear rate for pure foam, fiber-laden foam (2% hardwood), and 2.5% MFC-laden foam. Air content is 70%, bubble size is ca. 50 µm, temperature is 25 °C, and molar concentration of SDS is 8.5 mM/l.[Citation67] (b) VTT’s foam rheology measurement setup used for obtaining data of (a).](/cms/asset/87558da7-fc4a-4c6f-9b4d-b1ed64e12b49/ldis_a_1869035_f0007_c.jpg)
We see in that the inclusion of hardwood fibers or microfibrillated cellulose (MFC) does not change the power law index of the foam. The solids, however, have here a significant effect on the consistency index and thus on viscosity. The consistency index increases by 100% with 2% of added hardwood fibers, whereas the effect on foam viscosity coming from synthetic fibers of a similar size (rayon) is minimal.[Citation67] Moreover, the induced changes in bubble size are much stronger for the hardwood fibers than for synthetic fibers.[Citation27] This suggests a different type of interaction with the bubbles for the two types of fibers. It is possible that the interaction is stronger for the hardwood fibers because of their chemical heterogeneity (amphiphilicity) and trapped air (nanobubbles) on rough fiber surfaces.[Citation31,Citation77] On the other hand, the addition of 2.5% of MFC increases the consistency index by 25%. The small size of MFC fibers limits their ability to distribute momentum, while hardwood fibers can interact simultaneously with tens or even hundreds of bubbles.
2.3.3. Wall slip
Foams are prone to wall slip, which refers to the sliding motion of foam bubbles along a smooth wall such as that of a pipe. Slipping is due to foam creating a liquid film a few micrometers thick on the wall (. In the analogy to yield stress, there is slip stress τsy, below which the foam does not slip. The thickness of the slip layer generally increases with increasing wall shear stress and decreasing air content. The slip also depends on the wall material – foam slips in glass and acryl pipes, but not in steel pipes, probably due to wetting and surface roughness.[Citation65] Slip may increase the flow rate of foam significantly, and it has been studied intensively for pure foams.[Citation78–81]
There are only a few studies on the slip behavior of fiber-laden foams. In the work of Jäsberg et al.,[Citation23] the slip of foam was studied both with and without hardwood fibers. shows the thickness of the liquid film for pure and fiber-laden foams, and shows the slip velocity as a function of wall shear stress. The slip velocity seems to depend approximately linearly on the wall shear stress. We also see that the slip velocity and the thickness of the slip layer are higher for the pure foam. The fibers probably decrease the flow of water along the bubble Plateaus to the slip layer. shows the contribution of slip to the total flow rate. With low shear stress, the contribution of slip is significant. Jäsberg et al.[Citation67] also studied the slip behavior for foams laden with 3.5 wt.% MFC and 2 wt.% rayon fibers. Rayon fibers did not affect the slip behavior. With MFC, the slip velocity was only slightly lower than for pure foam.
Figure 8. Wall slip behavior of foams: (a) Velocity profile of foam in a pipe (red curve). Slip flow of foams is due to a thin layer of pure liquid of thickness generated at the pipe walls. Slip velocity vslip increases with increasing
(b) The thickness of the slip film for pure foam and fiber-laden foam. (c) Slip velocity as a function of wall shear stress for pure foam and fiber-laden foam. (d) The contribution of slip to the total flow rate. Air content was 70%, bubble size was 50 µm, temperature was 25 °C, and molar concentration of SDS was 8.5 mM/l. The diameter of the glass pipe was 15 mm.[Citation23]
![Figure 8. Wall slip behavior of foams: (a) Velocity profile of foam in a pipe (red curve). Slip flow of foams is due to a thin layer of pure liquid of thickness δ generated at the pipe walls. Slip velocity vslip increases with increasing δ. (b) The thickness of the slip film for pure foam and fiber-laden foam. (c) Slip velocity as a function of wall shear stress for pure foam and fiber-laden foam. (d) The contribution of slip to the total flow rate. Air content was 70%, bubble size was 50 µm, temperature was 25 °C, and molar concentration of SDS was 8.5 mM/l. The diameter of the glass pipe was 15 mm.[Citation23]](/cms/asset/45dd9765-41cc-4a52-b30f-0d50935fd087/ldis_a_1869035_f0008_c.jpg)
2.3.4. Flow of foam in real geometries
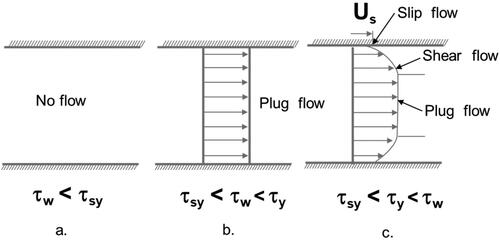
Assuming that yield stress is higher than slip stress, there are three different possibilities for the laminar pipe flow of foam (). When wall shear stress is below the slip stress, there is no flow (). When wall shear stress exceeds the slip stress, the foam flows as a plug; there is slipping on the walls, but no shearing in the bulk of foam (). When wall shear stress exceeds the yield stress, the foam starts to shear; inside the pipe there is a plug flow region, which decreases with increasing wall shear stress (). The determination of the flow rate of foam thus requires realistic models for slip flow, yields stress, and the viscous behavior of foam.[Citation74,Citation82–85]
Figure 9. The flow regimes of foam when (a) Wall shear stress is below slip stress. There is no flow. (b) Wall shear stress exceeds the slip stress. There is plug flow of foam. (c) Wall shear stress exceeds the yield stress. The foam starts to shear. There is plug flow in the middle of the pipe.
In the foam-forming process, in addition to pipes and other plant geometries, foam flow takes place through the filtered sheet in the forming section. In this case, the flow dynamics are reminiscent of foam flow through a fibrous porous medium. The flow of foam in the filtered sheet was studied by Lehmonen et al.[Citation86] with a vacuum-assisted sheet former. shows the dewatering time in this device as a function of vacuum level for water-laid and foam-laid forming. In water forming, the dewatering time is seen to be almost constant at all vacuum levels. This is expected; due to sheet compression, the hydrodynamic resistance of the sheet increases with water approximately linearly with the increasing vacuum level. In foam forming, dewatering time decreases with increasing vacuum. At the lowest vacuum level, dewatering time is on average 50% higher in foam forming than in water forming, but with higher vacuum levels dewatering times of water and foam forming are similar.
Figure 10. Dewatering of wet foams: (a) Dewatering time in vacuum-assisted sheet forming as a function of vacuum level for water-laid and foam-laid forming.[Citation86] (b) Foam flow in a fibrous porous material is a combination effect of bulk foam viscosity and bubble distortion.[Citation88] Reprinted from Ref. [Citation86] under the terms of the CC BY 4.0 license (http://creativecommons.org/licenses/by/4.0/).
![Figure 10. Dewatering of wet foams: (a) Dewatering time in vacuum-assisted sheet forming as a function of vacuum level for water-laid and foam-laid forming.[Citation86] (b) Foam flow in a fibrous porous material is a combination effect of bulk foam viscosity and bubble distortion.[Citation88] Reprinted from Ref. [Citation86] under the terms of the CC BY 4.0 license (http://creativecommons.org/licenses/by/4.0/).](/cms/asset/2ff06be6-aff0-4446-8ac4-0d31daeb04e9/ldis_a_1869035_f0010_c.jpg)
The relatively fast dewatering observed with foam () is surprising.[Citation87] The viscosity of foam is 1–2 decades higher than for water and shear thinning of foam is unlikely a sufficient explanation for this. shows a schematic of two limiting cases of the flow of foam in a porous material. If the pores are clearly bigger than the bubbles, the foam behaves as a continuum fluid and has a well-defined viscosity. On the other hand, if the bubbles are bigger than the pores, the flow consists of the movement of individual bubbles and bubble deformations. Lemmen and Wassink[Citation88] studied the flow of foam through metal screens. They found that the theoretical values of pressure loss calculated using the measured rheological behavior of foam was too high by a factor of two when compared with experiments. They concluded that foam flow in a porous material is a combinative effect of foam viscosity and bubble distortion. Hirasaki and Lawson[Citation89] found that the apparent viscosity of foam decreased by a factor of 104 when the ratio of bubble radius to capillary radius, increased from 0.1 to 10. With
= 10 the apparent viscosity of foam was found to be 60% below that of water. Indeed, during forming the average pore diameter of the filtered fiber sheet can be smaller than the typical diameter of bubbles and the foam flow is likely to be dominated by bubble deformations.
3. Foam as a transfer medium
As explained in the previous chapter, wet foam can be effectively used as a medium, with tunable viscosity, to carry fibers into a formed structure. Like in any process and product development, proper laboratory devices are important in simulating this process. In the paper and board industry, almost all product development begins with laboratory-made sheets. The procedure is well described and standardized. However, the merits of laboratory sheet-making when compared to real paper-machine production have been under a constant debate. There are many differences between laboratory and machine-made paper. Perhaps the most important of them is related to the orientation of fibers. In laboratory sheets, fibers are orientated randomly, whereas the continuous web forming orients fibers in the machine direction (MD).
In foam forming, the structures of laboratory sheets and machine-made webs resemble one another more than in the case of water forming. On one hand, foam damps the turbulence effects in pipes and at the forming section during continuous web production. On the other hand, laboratory devices used for foam forming orient fibers in the same way as a large-scale machine process. The procedure for making foam-laid handsheets varies depending on the purpose, but some basic features are repeated similarly and are introduced below.
3.1. Mixing effects on generated foam structure
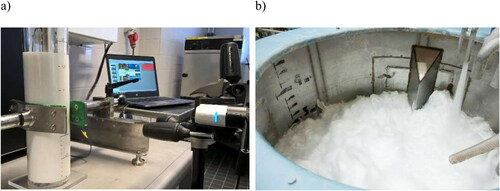
There are different methods to produce aqueous foam, such as (1) blowing gas through a nozzle or an array of nozzles into a liquid, (2) sparging gas through a porous membrane, (3) shaking or blending the liquid, or (4) producing foam through gas nucleation.[Citation37] However, for foam forming, the required foam suspension is usually generated by the mechanical mixing of water, pulp fibers, and foaming agent ().
Figure 11. Foam generation at different scales: (a) A laboratory vessel with bubble size imaging, where one disk with two opposing bends is used as the blade in a mixer (Netzsch, Hedensted, Denmark). Rotation speed can vary, being typically 2000–7000 RPM, depending on pulp consistency and targeted air content. Typical pulp consistency before foaming is 1–4%, and foaming time varies from 1 to 20 minutes. (b) On a larger pilot scale, foam generation can be done in a pulper.
Besides having good foaming properties, added surfactant should preferably be biodegradable, present low toxicity in aqueous environments and be compatible with other chemicals of the process. Surfactant molecules consist of a hydrophobic hydrocarbon chain and a hydrophilic head group. Besides the most common anionic sodium dodecyl sulfate (SDS, C12H25SO4Na),[Citation90] there are also many other options for foaming agent.[Citation91–94] Industrially interesting examples are nonionic polyoxyethylene (20) sorbitan monolaurate (Tween 20), nonionic alkyl glucosides or alkyl polyglucosides (APGs), and nonionic polyvinyl alcohol (PVOH or PVA). The advantage of SDS is that it enables achieving high air content at low concentration due to its small molecular weight. A drawback of anionic surfactants like SDS is their sensitivity to water hardness.[Citation90] That can be avoided by mixing SDS with other surfactants.
At the beginning of mixing, a vortex appears in the center of a vessel. Usually the mixing is continued until the targeted air content (50–70%) is reached or the vortex closes. Air content is perhaps the most important quality parameter, but other foam properties discussed in Section 2 such as bubble size or half-life time can be followed as well. Only a small fraction of the mixing energy is used to generate the actual foam structure. Almost all of the energy is dissipated as heat. In industrial applications, the efficiency of foam generation is important. The mixing efficiency can be improved, for example, by a proper choice of the mixing impeller(s) or by taking advantage of dynamic foam generation instead of batch operation.[Citation95]
Al-Qararah et al.[Citation26] studied how the mixing speed and the amount of surfactant affected mean bubble size and foam density. These foam properties are shown in later chapters to play an important role in defining the density of the formed material and the ability to, for example, handle very long fibers in the process. shows the measured air content as a function of rotation speed N for different SDS concentrations. The results shows two distinct flow regions: When the rotation speed is less than 5500 RPM, the final air content does not depend on the surfactant concentration. Above 5500 RPM, the air content becomes sensitive to the surfactant concentration. Between these two regimes, the flow changes qualitatively from rather regular (N < 5500 RPM) to chaotic (N > 5500 RPM), with visible vertical flow patterns for the chaotic flow. Adding kraft fibers does not change the flow behavior much (). The threshold rotation speed decreases slightly to N = 5000 RPM with added fibers, and the effect of varied consistency (mass fraction of the solid fibers in the water suspension before mixing the foam) is very small.
Figure 12. Effect of added fibers on air content in mixing: (a) Air content of pure foam as a function of rotation speed N for SDS concentrations 0.2 g/l, 0.3 g/l, 0.7 g/l, and 1.0 g/l. (b) Similar to (a), but with added kraft pulp with consistency of 0.33% and 0.66% for the SDS concentrations 0.2 g/l and 0.7 g/l.[Citation26]
![Figure 12. Effect of added fibers on air content in mixing: (a) Air content of pure foam as a function of rotation speed N for SDS concentrations 0.2 g/l, 0.3 g/l, 0.7 g/l, and 1.0 g/l. (b) Similar to (a), but with added kraft pulp with consistency of 0.33% and 0.66% for the SDS concentrations 0.2 g/l and 0.7 g/l.[Citation26]](/cms/asset/15d58062-e406-4f2e-a8de-77d9b0080fcc/ldis_a_1869035_f0012_c.jpg)
A possible explanation for this behavior is the amount of surfactant needed to stabilize foam bubbles. When N and thus shear rate are increased, the Sauter diameter decreases () to compensate changes caused by other parameters in the capillary number (EquationEquation (7)[7]
[7] ). This leads to an increasing total interface area of bubbles. If the concentration of surfactant is too low,[Citation96] the amount of surfactant molecules is too small to stabilize all bubbles. As a consequence, some bubbles break down and the air content decays. Thus, increasing rotation speed might cause poor foam quality if the amount of surfactant is not increased as well. The added fibers can further enhance this effect due to increased shear forces as shown in . In the unstable region, fibers have only a minor effect.
Figure 13. Mean bubble size in mixing: (a) Sauter diameter as a function of mixing speed N for both pure foams and those with added kraft pulp for two different surfactant concentrations. (b) Measured mean bubble size vs. the prediction of EquationEquation (11)[11]
[11] for pure foams. The air content varies between 0.6 and 0.82 among the shown data.[Citation26]
![Figure 13. Mean bubble size in mixing: (a) Sauter diameter as a function of mixing speed N for both pure foams and those with added kraft pulp for two different surfactant concentrations. (b) Measured mean bubble size vs. the prediction of EquationEquation (11)[11] D∼σN((1φ)−1)[11] for pure foams. The air content varies between 0.6 and 0.82 among the shown data.[Citation26]](/cms/asset/418d8003-d52c-49fe-a02c-7bf833dd838a/ldis_a_1869035_f0013_c.jpg)
To better understand this behavior, the effect of changing surface tension needs to be considered in addition to the rotation speed and air content. Al-Qararah et al.[Citation26] derived the following equation for the bubble diameter to describe this mutual dependency between different properties of the generated foam:
[11]
[11]
where σ is the surface tension and φ air content of the foam. compares the predicted bubble size obtained with EquationEquation (11)
[11]
[11] with experimental data. The agreement is very good.
As shown in , kraft fibers clearly affect the mean bubble size in the regular flow regime. To study this more carefully, shows bubble size distributions for pure foam, foam with kraft pulp, and foam with viscose fibers. Foam with added kraft pulp differs clearly from the other two. This indicates an interaction between kraft fibers and foam bubbles. Foam with viscose fibers has a very similar bubble size distribution to the pure foam, indicating much smaller interaction between viscose fibers and foam bubbles. The biggest differences between kraft and viscose fibers are surface chemistry and roughness together with the amount of small particles and fibrils (called fines), and released non-cellulosics from natural wood fibers.[Citation97] The kraft pulp is associated with a significant proportion of fines, and the fiber surfaces are rough and chemically heterogeneous. On the other hand, the surface of a viscose fiber is rather smooth, and the lack of fines and chemical surface heterogeneity[Citation31] can cause the interaction with bubbles to be minor.
Figure 14. Area-weighted bubble size distribution for pure foam (blue diamonds, solid curve), foam with viscose fibers (black circles, dotted curve), and foam with kraft pulp (red crosses, dashed curve). The rotation speed is 4000 RPM and the SDS concentration is 0.3 g/l. The curves are Gaussian distributions fitted to the data.[Citation27]
![Figure 14. Area-weighted bubble size distribution for pure foam (blue diamonds, solid curve), foam with viscose fibers (black circles, dotted curve), and foam with kraft pulp (red crosses, dashed curve). The rotation speed is 4000 RPM and the SDS concentration is 0.3 g/l. The curves are Gaussian distributions fitted to the data.[Citation27]](/cms/asset/e05c6f71-9605-4d53-b2af-7ef1ea2ab74a/ldis_a_1869035_f0014_c.jpg)
3.2. Laboratory forming
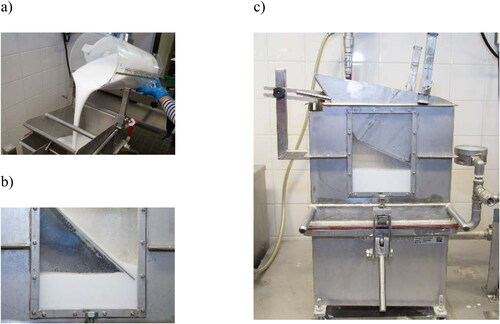
When the fiber foam suspension is ready, the mixing is stopped and the wet fiber foam is poured into a modified handsheet mold, where the flow is directed onto a forming fabric (or wire). It is possible to use similar forming fabrics as in water forming. Foam is often decanted into the handsheet mold using a tilted plate, which orients fibers along the flow direction. In this case, the usual ratio of tensile indices in machine and cross-machine direction is about 2. If foam was poured to the center of the mold directly from a container, the foam would spread radially along the fabric, causing circular patterns in the formed sheet. The working procedure for the foam-laid handsheets is described in .
Figure 15. The working procedure for the foam-laid handsheets: (a) Fiber foam is decanted into the handsheet mold; (b) fiber orientation is controlled with foam flow determined by a tilted plate and the gap between this plate and a mold boundary; (c) foam-forming handsheet mold before foam removal.
In a mold, gravity drives the drainage of foam through the forming fabric, which for some applications can be speeded up by vacuum-assisted dewatering. If the target is to make thin sheets, the effect of the vacuum can be further enhanced by putting a plastic film on top of the foam. On the other hand, making thick and highly porous structures allows the application of only very gentle or no vacuum at all. Density differences in the structure can be created by first applying a short vacuum pulse and then letting gravity drain the rest of the free water from a sample. In this way, the structure becomes denser on the wire side than the top side.
When making fairly thin sheets, a wet sheet and forming fabric are both removed from the mold. Pre-drying the wet sheet on a special suction table is optional. This operation mimics the role of vacuum boxes in a paper machine, and helps remove the free water from the structure and speeding up the drying phase. The operation also applies some pressure on the structure, densifying it slightly. The resulting sheets can be wet-pressed and dried in the same way as standard water-laid handsheets. Järvinen et al.[Citation98,Citation99] show that foam-formed sheets often recover better from compression and have lower density after wet pressing than similar water-formed sheets.
3.3. Preparation of low-density thick fiber structures
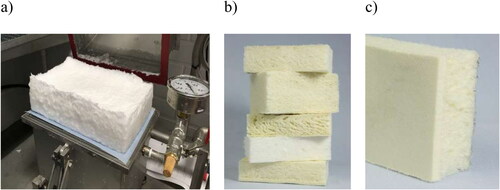
If the aim is to make highly porous, lightweight structures, the procedure differs from the one used for paper-like sheets. After making a thick sample, the targeted thickness and density are usually adjusted in a separate phase. This includes rewetting the dried samples again by water spraying and then pressing them to the target thickness manually or with the help of a pressing device. The obtained structure is then dried – for example, in an oven. This procedure to make lightweight cellulose structures is presented in . In Section 5.2, there is more discussion on the properties of such structures whose density can be as low as 5 kg/m3.[Citation25]
Figure 16. The procedure of making lightweight structures: (a) After dewatering, the wet sample is removed from the mold with the forming fabric, and the rest of the water is evaporated in an oven (70–105 °C) for about 12–24 h. This results in highly porous fibrous structures with a thickness of 10–100 mm. Density depends mainly on consistency and air content. (b) Dried sample made from chemithermomechanical (CTMP) and softwood kraft pulps. (c) A foam-formed CTMP structure having higher density on the side of the forming fabric (wire).
To save energy, as much water as possible should be removed from the fiber network through drainage before any heat application.[Citation100] A higher solids content after drainage can be achieved by increasing the initial pulp consistency or by increasing the mold height. The shrinkage of samples during drainage is then only slightly higher than the volume of the drained water. Drainage rate and final consistency can also be increased with a vacuum, or by using hot foam, but this can lead to severe sample compression. However, a light vacuum of the order of one kilopascal can be used to fasten the dewatering stage without significant compression.
Drying of the low-density laboratory sheets is usually done in an oven. To find a more efficient drying technique, Timofeev et al.[Citation101] carried out tests with several different drying methods for softwood kraft pulp samples. After 15 min of drainage, moisture content was 13–14 kg water/kg dry solids. They tested convective drying in an oven, impingement drying assisted with a vacuum, and combined impingement-infrared drying as well as through-air drying. The combined drying method turned out to be the most promising technique, in which the drying rate was highest and shrinkage was lowest compared to the other techniques. At a certain moisture content level, the sample appeared to become permeable for the air flow through it. From that point onward, one could use through-air drying to speed up the final drying. The drying rate was lowest in an oven, where the speed depended strongly on the air temperature. By increasing the air temperature from 90 to 150 °C, the drying rate could be doubled. However, high temperatures might lead to degradation of surfactant (indicated by a color change from white to brown).
Other drying methods for foam-formed samples were tested by Korehei et al.,[Citation102] with an interest in FD, vacuum-dewatered air-drying (VAD) as well as in vacuum-assisted dewatering followed by freeze-drying (VFD). VFD was used only in the last part of the drying process to reduce drying time and costs and to maintain the porous structure. They noticed that the lowest density and the most open structure was achieved with the FD method. The highest compression strength properties were achieved with VAD samples, and the VFD sample properties were between those of the other two techniques. The VFD samples had a lower density than the FD samples and had their compression properties between the corresponding values obtained for the FD and VAD samples.
3.4. Foam molding of 3D shapes
Foam forming enables the production of porous 3D shapes that can be used for various purposes, like packaging or interior decorative acoustic elements; see examples in . The product shape can be set during the manufacturing phase, for example, by placing obstacles against the forming fabric that affect foam/water flow or by using specially-designed molds.
Figure 17. Examples of 3D shapes formed using foam: (a) Glass shapes made with foam handsheet mold. (b) Acoustic panel formed with a triangular mold using colored fibers.[Citation19] (c) 3D structure that could be used to replace expanded polystyrene.[Citation103]
![Figure 17. Examples of 3D shapes formed using foam: (a) Glass shapes made with foam handsheet mold. (b) Acoustic panel formed with a triangular mold using colored fibers.[Citation19] (c) 3D structure that could be used to replace expanded polystyrene.[Citation103]](/cms/asset/5c7f77d9-424f-49db-a928-c7c239987562/ldis_a_1869035_f0017_c.jpg)
Härkäsalmi et al.[Citation19] tested different mold types to make foam-formed materials into various 3D forms. The molding was done using a similar technique to that used in molded pulp production. Different molds were produced, for example, from gypsum, polystyrene, and 3D-printed polylactic acid (PLA). The mold penetration channels affected the formed surface textures. Large holes speeded up drainage but also left stronger marking on the product surface. Dimensional stability was improved with restricted drying, where the kraft fiber structure was kept between two molds until the fibers were no longer wet. This led to an approximately 2% macroscopic shrinkage of the formed prototypes during drying.
4. Manufacturing process operations
The pioneering work on foam-laid webs was carried out by Bronislaw Radvan et al. in the 1960s[Citation1,Citation104] and early 70s at the Wiggins Teape Research & Development Laboratories, Beaconsfield, UK.[Citation2,Citation3,Citation105] Their original goal was to better understand the forming mechanisms and to create bulky fiber structures. In laboratory-scale experiments, they found that a good fiber dispersion and an exceptionally good sheet uniformity was achieved when a viscous foam was used as a carrier fluid.[Citation76] After a few decades in late 2000s, interest in foam-forming technology was raised again, and several pilot-scale studies have been published during the last 10 years.[Citation4–6,Citation18,Citation45,Citation106–108]
4.1. Unit operations on a manufacturing line
A manufacturing line of water-laid webs typically consists of different unit operations or sections. The first manufacturing process is the furnish preparation, which typically comprises refining, mixing, screening, and dilution processes. Typically, some papermaking chemicals such as sizing or retention agents and non-organic filler materials are mixed into a suspension before the forming section. Prepared fiber suspension is fed into a forming section through a headbox, which distributes the very dilute (consistency from 0.1% to 1.5%) fiber–water suspension evenly in a cross-MD. On a forming section, most of the water is removed by means of gravity and vacuum. On modern machines, the dewatering-forming process is completely (gab formers) or partly (hybrid formers) two-sided. After the forming section, the solids content is in the order of 20%, and the next step is mechanical pressing between the press felts on a press section. A press section may consist of several press nips or longer shoe nips. After the press section, the solids content of a web is between 40% and 50%. The last step is thermal drying, where the web passes over a series of steam-heated cylinders. After drying there are typically various finishing steps such as sizing, coating, and calendering.
The basic unit operations are quite similar if a paper or board production line is converted to a foam process (). When making highly porous webs or structures, the pressing of the web is avoided and the water is removed with vacuums and thermal drying. However, the processes of foam-laid and water-laid web production differ to some extent. Firstly, there has to be a system for generating the foam. Secondly, the properties of the foam have to be known and controllable. Thirdly, the process components have to be selected so that they can handle compressible foams. There is a risk that air is separated from the foam and may cause problems if the system is not designed to handle aqueous foams.
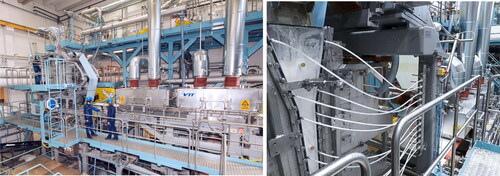
Figure 18. Pilot forming machine SUORA at VTT (Jyväskylä, Finland) that can be operated both in foam and water mode. For basic operating principles, see Ref. [Citation45]. The blowup shows the headbox region where wet foam is injected on a moving forming fabric.
![Figure 18. Pilot forming machine SUORA at VTT (Jyväskylä, Finland) that can be operated both in foam and water mode. For basic operating principles, see Ref. [Citation45]. The blowup shows the headbox region where wet foam is injected on a moving forming fabric.](/cms/asset/97d8846d-541e-43ec-aac2-868046d2cb52/ldis_a_1869035_f0018_c.jpg)
In the industrial scale, different kinds of mixers are typically used for foam generation. The geometry of a mixer may vary depending on a desired air content and the production rate of foam. For very light foams (density <200 kg/m3) that are typically used in foam-coating applications, a rotor-stator mixer[Citation109] is a commonly-used generator. Fibrous suspension foam can be generated in a large tank mixer[Citation18,Citation76] or by using a continuous flash mixer.[Citation110]
and present two foam-forming pilots at VTT in Finland. The first pilot SUORA was originally a paper machine in which the foam process was installed in 2013. The installation did not require any major changes to the system. The installation consisted of foam generation systems, air removal pumps, modifications to the vacuum systems, and foam quality monitoring systems. Today both foam- and water-laid processes can be run with the same machinery, just by turning the foam generation on and off. The second pilot SAMPO has been designed and built for non-pressed webs. The pilot consists of the vertical headbox and non-contact impingement, through-air and infrared dryers. There is no press section on this pilot. It is possible to form multi-ply products with both pilots. Foam can be generated in tanks or by utilizing the in-line generation system.[Citation110]
Figure 19. Foam-forming pilot SAMPO at VTT (Jyväskylä, Finland), with a closer view of the vertical foam headbox. There is no wet pressing in this process, and only non-contact dryers are used to allow the production of low-density webs.
4.2. Process waters and surfactant recovery
The cost-effectiveness of the foam-laid process depends largely on water and surfactant consumption within the process. The water consumption of today’s papermaking processes varies between 5 and 20 m3/t, and for some special grades, the consumption can be as high as 80 m3/t.[Citation111] Waste water is typically treated at the waste-water treatment plant, where key pollutants are removed by different methods. Separation technologies include physicochemical methods like sedimentation, flotation, coagulation, precipitation, membrane separation, adsorption, or oxidation, and biological techniques based on fungal or aerobic treatment or anaerobic digestion.[Citation112] When selecting surfactant for a foam-forming process, one must take into account the possible residues of the surfactants in the waste water and also the effect of surfactant on existing chemistry, for example, in the retention system.
Surfactants can be recovered from process waters by using different separation technologies. In addition to economic reasons, the surfactant recovery is beneficial due to environmental reasons since some surfactants are known to be harmful to various organisms.[Citation113] In sewage treatment, overly high surfactant concentrations may cause unwanted foaming and problems, for example, in pumps. There is very little information available related to surfactant dosages of industrial foam-laid forming processes. In laboratory-scale studies, the dosage of surfactant typically varies in the range of 0.3–4.0 g/l.[Citation21,Citation91] In the pilot and at the industrial scale, the surfactant level could be somewhat lower.
There are two technologies that can be used in industrial-scale processes that use large volumes of process waters: foam fractionation and membrane separation (). In a foam fractionation process, the solution containing the surfactant is placed in a tank and small air bubbles are generated by blowing pressurized air through a porous material at the bottom of the tank. Air bubbles then travel through the liquid volume and surfactant is adsorbed at the air–water interface of the bubbles. In a continuous process, the surfactant-rich froth is accumulated on the top of the tank and can be removed and concentrated. According to Du et al.,[Citation114] the foam fractionation can be used for diluted solutions in cases where other separation technologies do not work.
Figure 20. Principle of two surfactant separation technologies (a, b) and semi-pilot scale foam fractionator (c) and a membrane separation unit (d) at VTT.
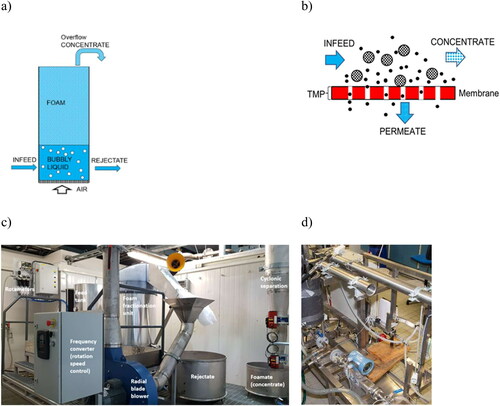
In a membrane separation process, the surfactant-containing water is pumped through a semi-permeable membrane. The membrane acts as a barrier for high molecular weight solutes while the water, a permeate, can pass through the membrane. Permeability of the membrane is determined by its pore size.[Citation115] In a membrane separation system, filtering of solids material is required before the membrane unit. Both systems have been studied in laboratory and semi-pilot scales at VTT (). With the foam fractionator, the level of enrichment varies between 25% and 60% depending on the surfactant concentration. Accordingly, with the membrane unit, the typical rejection level with the 400 Da membrane is in the order of 90%.
4.3. Process measurements
When designing a new process based on foam-laid forming technology or when changing from water forming to a foam-based process on paper and board machines, foam characteristics need to be determined online. In addition to that, information on flow rates, container levels, and jet speeds are needed for monitoring and controlling the foam processes. Some commonly-used measurement technologies and sensors can be directly transferred to the aqueous foams but some measurements must be adjusted.
4.3.1. Surface level of foam containers
The level of a process vessel containing foam can be measured with soundwave and ultrasound instruments. A sensor sends a high-powered acoustic pulse, which is then reflected from the surface of the material to be detected. Acoustic and ultrasonic sensors contain a wide selection of parameters to adjust the measurement so that the right reflected echoes from the fluid surface are recognized. Both sound and ultrasound measurements have worked well for most of the time, but problems have been encountered. Sometimes, fibers or dirt gather in the sound horn and the ultrasonic sensor. In some cases, the reasons for the malfunction of a sensor remain unclear. Inhomogeneity such as suspended particles, fog, and turbulence regions can weaken a sound beam substantially. Fog droplets can cause a substantial decrease in sound velocity.
Water and aqueous foam as acoustic media are quite rigid, compared to air. If a sound wave propagates in the air and is reflected from the water surface, the ratio of the reflected and incident sound pressure amplitudes is[Citation116]
[12]
[12]
where r1 = 415 Pa s/m is the acoustic impedance (resistance) of air, and r2 = 1.48 × 10⁶ Pa s/m that of water at temperature of 20 °C. According to EquationEquation (12)
[12]
[12] , the sound wave will reflect rather fully from the air–water interface. If an aqueous foam had a density of 300 kg/m3, and a sound velocity of 23 m/s,[Citation117] its acoustic impedance would be 300 kg/m3 · 23 m/s = 6900 Pa s/m. Also, in this case, foam would be a rigid fluid compared with air, and theoretically the reflected pressure amplitude from the air–foam interface would be 89% of the incident amplitude.
4.3.2. Volumetric flow of foam
The operation for an electromagnetic flowmeter at pipe flow is based on Faraday’s law of electromagnetic induction. In the flowmeter, the magnetic field, the direction of the flow of the conductor, and the electromotive force are perpendicular to each other. Electromagnetic flowmeters can be based on alternating current (AC), direct current (DC), or permanent magnets. If the magnetic field across the pipe is constant, and the diameter of the pipe is fixed, the magnitude of the induced voltage will be proportional to the mean velocity or the volumetric flow rate of the conductor flow in the pipe. The voltage induced is supplied to the amplifier using two measuring electrodes, for example, of stainless steel, mounted opposite each other inside the metering pipe. For accurate operation, the process liquid must have a minimum conductivity of 1–5 μS/cm.[Citation118]
In the case of fibrous foam, the assumption of the equal velocity of different phases is valid, and the conductivity requirement is very likely to be fulfilled (>5 μS/cm). A foam flow can have a different flow profile than a water flow, but this does not disturb the measurement. Successful use of an electromagnetic flowmeter in the case of fibrous foam requires that the density and corresponding pressure of foam are known at some point in the process line where the flowmeter is installed.
4.3.3. Density of foam
The density of foam can be measured by several methods, the simplest one being the weighing of a known volume of foam. More sophisticated automatic sample-taking and weighing can be applied. The measurement of foam density in a pipe can be based on differential pressures from the horizontal and vertical parts of piping. Gamma-ray attenuation or microwave methods can also be applied for foam density measurements.
In a weighting method, the known volume of foam flows continuously through a bucket. The flow rate of foam is adjusted with a valve in the inlet pipe and with an adjustable hole in the bottom of the bucket so that a small amount of foam goes over the edges of the bucket, and some foam (and water) leaks from the bottom hole or tube. The net weight of the foam bucket is measured continuously with a load sensor. The foam volume is known, and the density foam can be calculated in the process automation system. A cone-shape bottom to the bucket would be preferred, but a flat bottom also works. The measurement works quite well if the density and viscosity of fibrous foam does not vary significantly.
A more advanced method is to utilize a setup consisting of pressure-difference and absolute pressure sensors in the piping, where horizontal and vertical parts are near to each other (). It is good to have a straight pipe with the length of some pipe diameters before and after the pressure measurement ports, although foam can be viscous and flow laminar in many cases. When the density of foam or fibrous foam is known at pressure and temperature
the density of the same foam can be calculated for other process conditions.
Figure 21. Arrangement for the measurement of foam density with differential pressures.
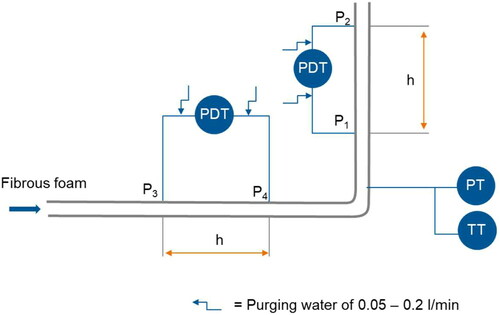
It is assumed that the quality of foam is constant through the 90° bend, and wall friction is the same for the horizontal and vertical pipe sections. Thus, the density of foam ρf at temperature T and pressure p is
[13]
[13]
where p1 − p2 and p3 − p4 are pressure differences over the vertical and horizontal pipe sections, and
is the acceleration of gravity. Typically, the length h could be 100–200 cm. If the length is not the same for the horizontal and vertical parts, the calculation can still be made with data on the pressure drop from the horizontal section. Pressure from the measurement point from the pipe under study is transmitted to the sensor through a small-diameter (plastic) tube. Each of the four measurement tubes is purged with a constant flow rate of deaerated water, for example, 0.05–0.2 l/min. Because of measurement accuracy, it is important that the flow rate of water is rather constant in a measurement tube and that air bubbles cannot accumulate there.
An effect of foam density on product quality is illustrated in . The best formation was obtained with the lowest foam density. In that case also the surfactant concentration was the highest. According to these results, quite significant quality improvements compared to water-laid references can be obtained with denser foams and lower surfactant concentrations. Optimal foam density for different products may vary and need to be determined experimentally.
Figure 22. The effect of foam density and surfactant content on specific formation of kraft pulp and CTMP-based sheets produced by a pilot machine.[Citation45]
![Figure 22. The effect of foam density and surfactant content on specific formation of kraft pulp and CTMP-based sheets produced by a pilot machine.[Citation45]](/cms/asset/d593d43f-4913-47e2-962d-d4939c559968/ldis_a_1869035_f0022_c.jpg)
4.3.4. Bubble size distribution of foam
A method for monitoring the bubble size distribution from the headbox of a paper machine has been presented by Koponen et al.[Citation119] The system consists of a flow-through cuvette. In a 3-mm thick cuvette,[Citation120] the bubble suspension is imaged with the optical imaging system utilizing the trans-immuminated geometry ().
Figure 23. Operation principle (a) and image (b) of the bubble size analyzator,[Citation119] together with measured distributions (c) from online images (d–e) of foam in foam-forming pilot conditions. The foams have been generated with a combination of tank and in-line generation. The foam density is 640 kg/m3. (d) Average bubble diameter is 67 µm, and the share of injected air is 19%. (e) Average bubble diameter is 83 µm, and the share of injected air is 45%. Reprinted with permission from Ref. [Citation45].
![Figure 23. Operation principle (a) and image (b) of the bubble size analyzator,[Citation119] together with measured distributions (c) from online images (d–e) of foam in foam-forming pilot conditions. The foams have been generated with a combination of tank and in-line generation. The foam density is 640 kg/m3. (d) Average bubble diameter is 67 µm, and the share of injected air is 19%. (e) Average bubble diameter is 83 µm, and the share of injected air is 45%. Reprinted with permission from Ref. [Citation45].](/cms/asset/d252de8b-ba93-4878-be81-5103de10303c/ldis_a_1869035_f0023_c.jpg)
From the images, several characteristics describing the quality of foam can be calculated. Typically, Sauter mean radius is used. The system provides 10 images per second and typically the results are averaged over a given period, for example, for 60 s. A pilot-scale experiment verified that the sheet uniformity improved with decreasing bubble size.[Citation119]
4.3.5. Velocity of slice jet
The velocity of a slice jet can be determined with a high-speed 3D scanner, applied, for example, for the detection of object location or for building 3D images of shapes. Shape profiles of the object are collected while the object moves through the measurement area. The combination of these shape slices is a description of the complete object shape. In the VTT pilot, a Sick Ruler-E4111 sensor was used for the determination of the slice-jet velocity. It uses laser wavelength 660 ± 15 nm, and can collect 10,000 3D profiles per second.[Citation121]
4.3.6. Consistency of fibers
In water-based technology, shear force sensors[Citation122] can be utilized for fiber consistency measurements. These are either blade-type or rotating-type sensors. They are sensitive to pulp grade, fiber length distribution, and freeness. A shear force sensor does not see pigments clearly. Depending on the pulp and blade type, a consistency transmitter can work well in the consistency range of 0.7–1.0% to a maximum of 4–16%.[Citation123] An optimal blade type can be selected for the application based on consistency range and pulp type. The optimum flow velocity of the measurement for a particular blade type varies from 0.1–0.5 m/s to the maximum of 2–5 m/s. At first glance, blade consistency transmitters could be suitable for the consistency measurement of fibrous foam. If consistency is higher than in water forming, it would be good to keep the flow velocity within a suitable range for a shear force sensor already available in an existing process pipe.
5. Unique microstructure and properties of foam-formed fiber networks
5.1. Structural analysis and physical testing methods
In order to develop material performance, it is important to characterize the structural features that are responsible for properties such as strength, permeability, or thermal insulation. There is a multitude of conventional and modern analytical tools for this purpose. The main challenges in the characterization are the relatively low density of the formed samples, their wide pore-size distributions, and multi-scale structures caused by fibers and fines of different dimensions. At very low density, it is difficult to define the boundaries of a sample or of an individual pore. Moreover, the forming process can cause variation, for example, in fiber orientation in different parts of a macroscopic sample. In spite of these challenges, the existing methods are sufficient for pointing out the fundamental characteristics of fiber network structures obtained with foam forming. In particular, the structural analysis indicates how the foam properties affect the microscopic structure.
Direct microscopic imaging is often an effective way of getting an idea of the overall structure of material. There are both 2D and 3D imaging methods whose differences have been discussed in detail by Al-Qararah et al.[Citation124] The average bubble diameter of typical wet foams is of the order of 100 µm, which leads to a slightly smaller average pore size of the formed fiber network. Thus, the 1 µm resolution of today’s X-ray microtomography is usually quite sufficient to obtain a good 3D image of the porous structure () and to benchmark other methods against the obtained results. Usually, it is most convenient to image the sample with different resolutions so that both fine details and the large-scale structural variation become visible. In general, the 2D methods such as SEM, light microscopy, or direct CCD imaging yield similar results as X-ray microtomography.[Citation124] However, because of the cumbersome sample preparation procedures, the available data are much more limited when using these methods than with X-ray microtomography, and therefore, for example, the 2D pore size analysis is less accurate. On the other hand, indirect methods such as mercury porosimetry[Citation124] can deform a low-density structure during the measurement, and extreme care is needed in interpreting such results.
Figure 24. X-ray tomographic images of foam-formed structures with varying densities: (a) 3D sample[Citation125] (density 32 kg/m3) consisting of viscose fibers and natural rubber latex (shown in green). The vertical fiber orientation is caused by the direction of foam flow in filling the mold. (b) A small part of a thick plate-like sample[Citation126] with natural wood fibers (density 60 kg/m3). (c) Sheet with CTMP fibers (density 111 kg/m3).[Citation21] (d) Nonwoven sample with natural and viscose fibers together with fiber yarn (density 290 kg/m3).
![Figure 24. X-ray tomographic images of foam-formed structures with varying densities: (a) 3D sample[Citation125] (density 32 kg/m3) consisting of viscose fibers and natural rubber latex (shown in green). The vertical fiber orientation is caused by the direction of foam flow in filling the mold. (b) A small part of a thick plate-like sample[Citation126] with natural wood fibers (density 60 kg/m3). (c) Sheet with CTMP fibers (density 111 kg/m3).[Citation21] (d) Nonwoven sample with natural and viscose fibers together with fiber yarn (density 290 kg/m3).](/cms/asset/2c25f659-342f-4449-bf54-bd0b6ad1511e/ldis_a_1869035_f0024_c.jpg)
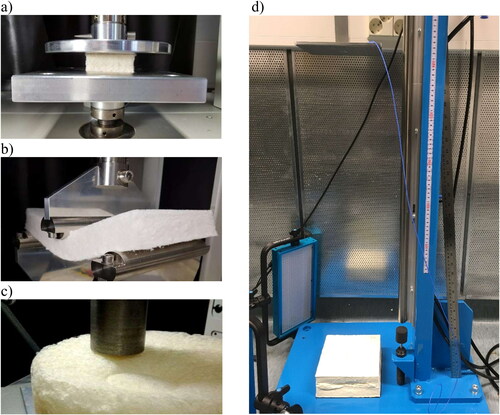
Suitable testing methods for mechanical properties of fibrous materials depend on sample geometry. There is a standardized testing method (Tensile strength, EN 1608) for tensile properties like strength, elastic modulus, and breaking strain. On the other hand, for insulation and construction materials, compression and bending strengths are often more relevant. The standardized method (Compression strength, EN 826) is for 10% strain, but it is often useful to also look at larger compression levels and the recovery of the deformation after compression. These kinds of features are particularly important for cushioning applications, where high impact forces impose large and fast deformations. Some specific tests for thick materials are illustrated in .
Figure 25. Mechanical testing methods for thick material samples: (a) Compression strength, EN 826 standard (at 10% strain). (b) Bending strength, EN 12089 standard. (c) Point load test. (d) Platen drop test for testing cushioning properties.
There is a multitude of other important properties for various material applications, which can be influenced by the foam-forming process. Some important characterizations are listed in .
Table 1. Special physical properties and related tests for fibrous materials.
5.2. Material density
The finite yield stress of foam above the critical air content of ≈ 64% (Section 2.3.1) helps in supporting the fiber network during drainage. Moreover, the forming process can orientate fibers away from the lateral direction. These two factors together can give rise to extremely low density of the final dried material.[Citation12,Citation25] The lowest density achieved in laboratory foam molding for normal wood pulp fibers (fiber wall density 1500 kg/m3) has been about 5 kg/m3.[Citation25] This implies that the porosity of such a material is over 99.5%. In this case, the fibrous structure is made with very stable foam and dried as gently as possible so that compressive stresses during drying are largely avoided. The density of the dried material can also be reduced by decreasing the fiber consistency of the liquid phase within the wet foam.[Citation127]
Higher densities can be produced by reducing the air content () and stability of the foam or by using shorter fibers.[Citation12,Citation128] Moreover, drainage affects the density a lot. Especially with the applied vacuum and wet pressing,[Citation98] it is possible to make fiber networks with a similar density (exceeding 300 kg/m3) as that obtained by water forming. The vacuum causes a collapse of the wet fiber foam, leading to planar fiber orientation. Despite this rather drastic change in the fiber foam structure, traces of bubble structure still remain visible in the final dried sheet.[Citation21,Citation77,Citation129,Citation130] Al-Qararah[Citation22] showed that lower density can be achieved in a sheet sample by using foam as the carrier phase instead of water with equal surfactant concentration. Thus, the bubble structure is essential in setting the density – not only the reduced bonding because of surfactant. Inside the wet foam, fibers are pushed into narrow gaps between the bubbles. This creates regions of higher local density, which resists network collapse during drainage. These effects on the fiber distribution are also seen later in the dried porous structure ().
Figure 26. Very low densities of the fiber network can be achieved by increasing the air content of the foam,[Citation12] which stabilizes the structure during drainage. The density can also be affected by fiber length, as shown in the figure.
![Figure 26. Very low densities of the fiber network can be achieved by increasing the air content of the foam,[Citation12] which stabilizes the structure during drainage. The density can also be affected by fiber length, as shown in the figure.](/cms/asset/431fb4f5-9ae2-44a6-be4c-79d2f1f44740/ldis_a_1869035_f0026_c.jpg)
Figure 27. Structural images of foam-formed fiber network as obtained with X-ray tomography: (a) In a thin slice viewed from above,[Citation77] the bubble structure of the wet foam is visible as a planar distribution of fibers (shown in light color) into polygonal patterns formed by gaps between the bubbles after drying. The vortex-type denser regions probably originate from instabilities in the foam flow. (b) A side-view of sample cross-section containing refined kraft pulp and hemp fibers (SDS surfactant). Re-moistening and pressing has led to higher local density near sample surfaces. Reprinted from Ref. [Citation77] under the terms of the CC BY 4.0 license.
![Figure 27. Structural images of foam-formed fiber network as obtained with X-ray tomography: (a) In a thin slice viewed from above,[Citation77] the bubble structure of the wet foam is visible as a planar distribution of fibers (shown in light color) into polygonal patterns formed by gaps between the bubbles after drying. The vortex-type denser regions probably originate from instabilities in the foam flow. (b) A side-view of sample cross-section containing refined kraft pulp and hemp fibers (SDS surfactant). Re-moistening and pressing has led to higher local density near sample surfaces. Reprinted from Ref. [Citation77] under the terms of the CC BY 4.0 license.](/cms/asset/fe833738-feef-49f6-a291-0e9ead2ce70d/ldis_a_1869035_f0027_b.jpg)
In the making of planar structures, it is quite common to re-moisten the dried material and press it into a target thickness or density.[Citation77,Citation126] In this way, the average density can be increased considerably but at the same time, the pressed smooth sample surfaces are densified compared to the middle parts of the material (). Moreover, the collapse of pores formed by the bubbles can be very large in the thickness direction. Still in the planar directions, the size and location of pores can follow the original bubble structure that was found before the drying, re-moistening, and pressing operations in the respective material layer.[Citation77]
5.3. Pore-size distribution
The porous structure is central for transport properties such as liquid and gas permeability,[Citation131] and heat insulation. The volume-weighted pore-size distribution is usually determined based on the local thickness map over a predefined sample region. In this method, for each point of the void space, one determines the largest sphere around that point which fits inside the void space. The diameter of the sphere is called the local thickness at that point. The normalized frequency of various diameters gives the volume-weighted pore-size distribution.[Citation21,Citation124]
As said earlier, the structure of the wet foam leaves special traces in the formed fiber network. This is seen in where we show the pore-size distribution characterized with X-ray microtomography for a foam-formed CTMP pulp sheet. Random deposition of fibers typically leads to a lognormal distribution of pore sizes, which is visible in in the small pore diameters. However, the foam carrier causes an additional Gaussian component in the distribution, so that the probability of large pores becomes much higher than in water forming. The total pore-size distribution can be presented as a linear combination,[Citation21]
[14]
[14]
where
and
describe the mean and standard deviation of the two distributions. These parameters can be fitted together with the coefficient
to the measured data. Al-Qararah et al.[Citation21] found the Gaussian component to dominate this fitting for foam-formed sheets (
). Moreover, a higher value of
was obtained for stiff CTMP fibers (
) than for flexible kraft fibers (
), probably because of the stronger collapse of the kraft sheet during drainage.[Citation21]
Figure 28. Relation between pore and bubble sizes: (a) Probability density function (volume-weighted pore-size distribution) for varied pore diameter for a chemithermomechanical (CTMP) pulp fiber network at the density of 115 kg/m3. A very broad Gaussian component describing the contribution from large pores exists besides the characteristic lognormal component at small diameters. Reprinted with permission from Ref. [Citation21]. (b) Mean pore diameter follows the mean bubble diameter extrapolating close to the mean pore size for water forming at vanishing bubble size.[Citation21]
![Figure 28. Relation between pore and bubble sizes: (a) Probability density function (volume-weighted pore-size distribution) for varied pore diameter for a chemithermomechanical (CTMP) pulp fiber network at the density of 115 kg/m3. A very broad Gaussian component describing the contribution from large pores exists besides the characteristic lognormal component at small diameters. Reprinted with permission from Ref. [Citation21]. (b) Mean pore diameter follows the mean bubble diameter extrapolating close to the mean pore size for water forming at vanishing bubble size.[Citation21]](/cms/asset/5971c55d-5381-4900-af3a-0e4bfd775890/ldis_a_1869035_f0028_c.jpg)
The mean bubble size is reflected in the Sauter mean pore size of the fiber network. The mean pore size is directly proportional to the mean bubble size, as shown in . The extrapolation to vanishing bubble diameter gives a value close to the mean pore size of water forming, using the same CTMP fibers. Similar qualitative features are obtained with flexible kraft fibers but the variation of mean pore size with bubble size is not as strong. In conclusion, the bubble size gives an additional way to tune the pore-size distribution besides the fiber type.
5.4. Fiber network structure
The strength properties of fibrous materials are determined mainly by the mechanical properties of fibers and their orientation and bonding. Moreover, small particles released from fibers (called fines) not only improve the strength of inter-fiber bonds, but also densify the material and increase the number of inter-fiber joints. The average number of inter-fiber joints is determined not only by material density but also by the geometric properties of fibers and their orientation. There are several classical models for the relationship between these factors. Assuming a random network made of idealized fibers with circular cross-section, the number of inter-fiber joints is given by[Citation132]
[15]
[15]
where D is the average fiber diameter, N is the number of fibers, L is the average length of fibers,
is volume, and J is the orientation density function having the value of
for isotropic fiber networks and the value of
for sheet-like networks. EquationEquation (15)
[15]
[15] suggests a rapid increase in the number of joints, if the volume in which the fibers are confined is reduced by voids of the structure:
[16]
[16]
Here, is the local density. Thus, the bonding of the network increases as the square of local density if fibers are well-bonded at contact points. As a consequence, possible large voids of a low-density structure can even increase the amount of network connections, when compared to a fully random fiber distribution.
Foam-formed fiber networks have a unique microporous structure with planar structural variation originating from bubbles,[Citation77,Citation130] as discussed earlier in Sections 5.2 and 5.3. Moreover, X-ray microtomography has shown that fiber networks tend to form separate layers in the thickness direction at very low average material density.[Citation130] Therefore, the structure can deviate a lot from a simple random fiber network, and one has to be cautious when using averaging formulas such as EquationEquation (15)[15]
[15] .
The fiber orientation in materials prepared using foam can be much more diverse than in water-formed samples.[96] This results from the initial thick foam layer, where fibers have fewer geometrical restrictions for their orientation and the foam has some structural rigidity sustaining even vertically orientated fibers until the water is removed. However, when the thickness of the dried sample becomes smaller than the fiber length, geometrical restrictions enforce fibers to align, mainly in the planar direction.
In a similar way to water-formed webs, shear stresses arising from the flow of viscous foam can orient fibers effectively. This strong orientating effect is seen both in foam-formed pilot webs[Citation108] () and in laboratory samples,[Citation98] where the direction of foam flow seems to affect the average fiber alignment.[Citation25] The shear forces are particularly strong near a forming fabric so that the bottom layer of the fiber network is strongly orientated along the relative direction of foam flow. However, in thick samples, the fiber orientation can vary in different layers of the sheet structure.[Citation98] For example, a tumbling instability inside the flow can affect the fiber orientation before the wet foam is removed. Such an instability has been seen in modeling studies[Citation133] for individual fibers. Moreover, the upper foam layer dries earlier than the bottom layer during drainage. The associated water flow can turn fibers toward the vertical direction in the dried material.[Citation130] This mechanism may be important, especially when increasing the foam volume, so that the upper network layers are formed by flow that enters the forming section later than the bottom flow. The delayed application of vacuum for the upper layers gives additional time for the vertical water flow before the structure collapses.
Figure 29. Kraft fiber orientation, described by tensile strength ratio between machine and cross-machine direction, and specific β-formation for (a) foam-laid paper (closed slice jet forming geometry), and (b) water-laid paper (open slice jet forming geometry) as a function of the jet-to-wire ratio.[Citation108]
![Figure 29. Kraft fiber orientation, described by tensile strength ratio between machine and cross-machine direction, and specific β-formation for (a) foam-laid paper (closed slice jet forming geometry), and (b) water-laid paper (open slice jet forming geometry) as a function of the jet-to-wire ratio.[Citation108]](/cms/asset/83a3c5c5-91ce-4e43-b325-50a3e17fdbb5/ldis_a_1869035_f0029_c.jpg)
5.5. Structural effects on mechanical performance
The density and fiber network structure of foam-formed samples have a direct impact on the strength properties. There is a vast literature on the mechanical properties of fibrous materials related to, for example, paper[Citation134] and wool. Paper has relatively high density, and the underlying fiber network is well bonded. On the other hand, the density of wool is much lower, and the fibers are mechanically entangled with one another with no similar chemical bonding, as there is in papermaking. Foam-formed bio-based materials with low density lie in between these two classical cases with a well-bonded fiber network but also with long free fiber segments between the bonded areas. A common denominator for all three types of random fiber network is the exponential distribution of the segment lengths, valid also for flocculated networks.[Citation135] This distribution can been taken as a starting point for theoretical models related to mechanical behavior.
5.5.1. Tensile and thickness-directional strength
For paper-like thinner fiber networks with a density of over 300 kg/m3, the so-called relative bonded area is quite high (even up to 50% of the surface area of fibers).[Citation134] In this case, network deformations are affine,[Citation136] which means that local strains follow the macroscopic strain. The tensile strength in this case is directly proportional to material density,[Citation137] assuming that the bond strength is not significantly affected by network density. The tensile strength properties obtained with foam forming can differ slightly from those in the water forming. Foam forming improves the homogeneity (or formation) of a sheet, see . In principal, this improves tensile strength but reduces, for example, tear strength, for which small flocs in the structure may be beneficial as they couple different fiber layers together in the thickness direction.
The type of foaming agent may affect the tensile strength by changing the strength of inter-fiber bonds or the network structure.[Citation94] For laboratory kraft sheets, Al-Qararah[Citation22] found a slight reduction in tensile strength with high SDS surfactant concentration when comparing with a water-formed structure at an equal density of ca. 200 kg/m3. For pilot-scale webs with a density of ca. 600 kg/m3, Lehmonen et al.[Citation107] found a similar tensile strength for both forming methods with SDS surfactant. However, this required that the foam density was high enough, in the range of 400–600 kg/m3. Interestingly, a slightly higher strain at break was obtained for foam forming because of the improved homogeneity of a web. On the other hand, the strength in thickness direction (often called Z-strength) was reduced by foam technology in the same foam density range.[Citation107,Citation108] This probably resulted from the structure having fewer fiber flocs and instead large pores that could act as failure sources.
5.5.2. Compression behavior
For thick materials with low density, compression behavior is often the most important strength characteristic. As suggested by EquationEquations (15)[15]
[15] and Equation(16)
[16]
[16] , the compression modulus and stress depend strongly on the density of the material together with the bending stiffness of the fibers and their bonding. This is shown in , where the stiffer CTMP fibers lead to much higher compression stress than the flexible kraft fibers. However, for both types of fibers, the stress increases with density as a power law with the power close to 2. This is explained by the increasing number of inter-fiber joints, as described by EquationEquation (16)
[16]
[16] .
Figure 30. Compression stress at 50% strain as a function of material density for samples made with unrefined bleached softwood kraft (BSKP0, left) and CTMP (right) fibers using three different foaming agents: SDS (triangles), Tween 20 (dots), and PVA (crosses). Reprinted from Ref. [Citation126] under the terms of the CC BY 4.0 license.
![Figure 30. Compression stress at 50% strain as a function of material density for samples made with unrefined bleached softwood kraft (BSKP0, left) and CTMP (right) fibers using three different foaming agents: SDS (triangles), Tween 20 (dots), and PVA (crosses). Reprinted from Ref. [Citation126] under the terms of the CC BY 4.0 license.](/cms/asset/3eea26f5-dd44-4782-bca6-687a156f1306/ldis_a_1869035_f0030_c.jpg)
The strength of foam-formed network structures can be improved by using polymeric foaming agents such as PVA or adding nanocellulose or lignocellulosic fines in the furnish.[Citation77,Citation138–140] However, the strengthening mechanisms can be different in these two cases. PVA acts as a cross linker for inter-fiber bonds but can also open larger voids in the microporous structure and at the same time densify certain local network regions.[Citation77] On the other hand, the addition of nanocelluloses or fines generally not only increases bonding but also makes the structure more homogeneous. In , slightly higher stress is seen with the PVA foaming agent, while the effects of SDS and Tween 20 surfactants are minor.
Based on EquationEquation (15)[15]
[15] , the mean segment length
(i.e., free span between neighboring inter-fiber joints) becomes[Citation132]
[17]
[17]
where
is fiber density. At material density
below 100 kg/m3, the free segment lengths between neighboring inter-fiber joints can get very long. This means that there are only a few contacts per 1–2 mm long natural fiber. In reality, possible voids can increase local density and thus also the number of joints.
The long free fiber segments make deformations non-affine so that local behavior can deviate strongly from the average strain.[Citation136] Moreover, new deformation modes appear. Subramanian and Picu[Citation141] found that fiber bending dominates the stress behavior of a compressed non-bonded fiber network until axial stresses and strains develop and take over at higher densities. Many later simulation models have also shown the importance of fiber bending for the general deformation behavior of bonded networks.[Citation142,Citation143] However, these models are based on uniform fibers without inherent heterogeneity. In reality, natural fibers include not only weak points like kinks but also varying fiber cross-section along the fiber axes. Thus, smooth bending appearing in model simulations of the idealized fiber systems can give a wrong picture of the real deformation behavior. In fact, the measurement of acoustic energy emissions in cyclic compression tests[Citation144] indicates that there has to be other causes for this energy emission than fiber bending. Bending also takes place during unloading but still significant acoustic energy emission is observed only when exceeding previous compression levels; see .
Figure 31. Measured stress and energy release behavior during compression are compared to model predictions: (a) Compression measurement with combined analysis of released acoustic energy (AE). (b) Measured number of acoustic events n in a cyclic compression test for a CTMP sample, where is the compressive strain as a function of time t (10 parallel measurements). Significant acoustic emission is observed only when the previous compression levels are exceeded.[Citation144] (c) Comparison of measured (average shown in blue) and predicted (red, EquationEquation (18)
[18]
[18] ) stress–strain curves of a foam-formed kraft-pulp sample. The cumulative AE energy (average shown in magenta) increases rapidly beyond
when collective phenomena take place. (d) The measured normalized number of acoustic events
(average shown in blue) follows the theoretical function
(red) in the region where stress behavior is predicted correctly by EquationEquation (18)
[18]
[18] . Reprinted from Ref. [Citation144] – Published by The Royal Society of Chemistry under the terms of the CC BY 3.0 license.
![Figure 31. Measured stress and energy release behavior during compression are compared to model predictions: (a) Compression measurement with combined analysis of released acoustic energy (AE). (b) Measured number of acoustic events n in a cyclic compression test for a CTMP sample, where ϵ is the compressive strain as a function of time t (10 parallel measurements). Significant acoustic emission is observed only when the previous compression levels are exceeded.[Citation144] (c) Comparison of measured (average shown in blue) and predicted (red, EquationEquation (18)[18] σ(ϵ)=σ0[s(ϵ)]2,[18] ) stress–strain curves of a foam-formed kraft-pulp sample. The cumulative AE energy (average shown in magenta) increases rapidly beyond ϵ=0.5, when collective phenomena take place. (d) The measured normalized number of acoustic events n* (average shown in blue) follows the theoretical function exp (−3s(ϵ)) (red) in the region where stress behavior is predicted correctly by EquationEquation (18)[18] σ(ϵ)=σ0[s(ϵ)]2,[18] . Reprinted from Ref. [Citation144] – Published by The Royal Society of Chemistry under the terms of the CC BY 3.0 license.](/cms/asset/c500f236-b974-45d6-968b-b69482480a60/ldis_a_1869035_f0031_c.jpg)
Ketoja et al.[Citation126] proposed that in low-density fibrous materials, axial stresses predicted by Subramanian and Picu[Citation141] can be released by bucklings of the corresponding fiber segments, causing abrupt displacements of neighboring fibers. By assuming that fiber segments longer than (
is the mean segment length) undergo buckling at ϵ (if they have not bent earlier), the mean compressive stress σ is given by[Citation126]
[18]
[18]
[19]
[19]
Here, the constant sets the absolute level of compression stress, while the stress-compression behavior is described by the same function
for all low-density random fiber networks with exponentially distributed segment lengths. In other words, the fiber type or bonding properties would affect only the coefficient
This strong prediction for the stress-strain behavior seems to be reasonably valid for very different types of materials and different densities at the intermediate strain values of 0.1–0.5, as exemplified in .[Citation77,Citation126,Citation144] Moreover, the exponential distribution of segments lengths gives an estimate
for the relative number of segment bucklings as a function of strain. The power 3.0 of this function appears to describe the number of acoustic events up to about strain 0.5 ().[Citation144] At higher strain levels, both collective phenomena and the formation of new contacts can lead to deviations from this simple behavior. Moreover, added nanocellulose and fines can change the behavior so that a relatively high value of strain is needed before the theoretical stress–strain behavior is approached.[Citation77]
5.6. Structural effects on transport properties
As discussed above, foam-formed sheets tend to have more big pores than water-formed sheets (). This is reflected in a higher permeability of foam-formed sheets. Koponen et al.[Citation131] studied the permeability with fluid flow simulations in structures obtained directly from X-ray tomographic images of the sheets (). At the porosity 0.9, the permeability was found to be even 90% higher for foam than water-formed sheets (). Moreover, for the sheets containing stiff CTMP fibers, the simulated permeability varied systematically with mean bubble size (recall ) as shown in . Lehmonen et al.[Citation86] made both types of sheets with a vacuum-assisted sheet former and compared the dry-sheet properties. shows the Bendtsen air permeability of the sheets at different SDS dosages. We can see that the air permeability of foam-formed sheets is generally higher. With the highest SDS dosages, they have almost 100% higher permeability than the water-formed sheets. This result is comparable with the simulations of . In this study, the densities of final sheets were similar and thus cannot explain the observed difference in the permeability.
Figure 32. Comparison of simulated and measured permeability: (a) Fluid flow simulation for a tomographic image of a foam-formed sheet. The image shows 1/10 of the original tomographic sample having dimensions of 1.7 mm 1.9 mm. (b) Simulated normalized permeabilities of foam-formed samples having porosity of 0.9 made from CTMP pulp with foam having varied bubble size.[Citation131] (c) Bendtsen air permeability of dry water-formed and foam-formed sheets at different SDS dosages. The sheets have been made from grade softwood pulp and the basis weight is 85 g/m2. The sheets have been wet-pressed before drying.[Citation86]
![Figure 32. Comparison of simulated and measured permeability: (a) Fluid flow simulation for a tomographic image of a foam-formed sheet. The image shows 1/10 of the original tomographic sample having dimensions of 1.7 mm × 1.9 mm. (b) Simulated normalized permeabilities of foam-formed samples having porosity of 0.9 made from CTMP pulp with foam having varied bubble size.[Citation131] (c) Bendtsen air permeability of dry water-formed and foam-formed sheets at different SDS dosages. The sheets have been made from grade softwood pulp and the basis weight is 85 g/m2. The sheets have been wet-pressed before drying.[Citation86]](/cms/asset/fc62e594-2dd4-48db-b0b7-a7627dcac97b/ldis_a_1869035_f0032_c.jpg)
6. Novel product properties in different application areas
All of today’s fiber products that are made using the water-laid process could be made with foam-forming technology in the future. These include especially paper, board, molded fiber structures, and some nonwoven fabrics. The main advantages of foam technology in these cases are the savings in energy and water use[Citation11] as well as good formation (homogeneity) of the produced material. Foam-forming technology also enables the preparation of porous and lightweight structures that could be used in thermal or sound insulation,[Citation12–14,Citation145] lightweight packaging,[Citation7] and filtering.[Citation16,Citation17] Novel applications such as complex 3D forms[Citation19] and growth media[Citation146] can also be produced with foam forming. Moreover, it is also possible to get tailored properties such as antibacterial properties[Citation147] in medical or hygienic applications,[Citation148,Citation149] designed microstructures,[Citation21] or conductive cellulose-based structures.[Citation150] Possible other high-tech applications include soft composites,[Citation151] sensors,[Citation152] chromatography and other diagnostics, substrates for biocatalytic and chemical conversion, and fiber materials with imbedded optics and electronics. In , we summarize the main potential application areas for foam forming and the characteristic features of each of them.
Table 2. Simplified list of potential application areas of foam-formed products together with target performances, characteristics, and challenges.
6.1. Nonwoven
Using foam-forming technology to produce nonwovens was mentioned as early as in the early 1970s by Radvan and Gatward[Citation2,Citation153] and in a 1977 paper written by Hanson.[Citation154] Hanson mentioned that a Wiggins Teape factory was running specialty papers using the foam process, but in the laboratory they had also tried some long fibers and made nice textile-like sheets. There are several advantages to make nonwovens using a foam manufacturing process. One is that different fibers can be easily mixed with foam enabling the use of longer fibers or filaments than in the wet-laid process. With longer fibers, higher strength properties can also be achieved. Compared to currently-employed methods like the air-laid process, the foam-laid process enables higher production speeds. Moreover, compared to the wet-laid process, a higher forming consistency and better formation can be achieved.
Koponen et al.[Citation18] published results in which hardwood kraft pulp fibers, softwood kraft pulp fibers (refined and unrefined), as well as 6-mm man-made lyocell (Tencel™) fiber were used in pilot trials. The target was to run long-fiber suspensions with the current paper-machine geometries and see the effects on strength properties and formation. They showed that foam forming yielded very good formation, even with the 20% addition of 6-mm lyocell fibers to softwood kraft pulp furnish. With shorter hardwood fibers, formation was also good with water forming, but when consistency increased from 0.45% to 0.9%, formation decreased in the water process. It was concluded that improvements in formation become more important when fiber length increases. This would be an interesting opportunity for making nonwovens with foam, although the fiber length in the trials was not as long as the typical lengths used in the nonwoven industry.
Lehmonen et al.[Citation155] presented a laboratory study where 6-mm, 12-mm, and 24-mm viscose fibers were used to make handsheets. The formation was very good, especially with 6-mm fibers, while it decreased a little with longer fibers. In their study, mechanical bonding (hydroentanglement) was used to increase both strength and breaking strain. Heikkilä et al.[Citation8] presented results on foam-laid nonwovens made in the laboratory from cellulosic fibers. They used 12-mm and 24-mm viscose fibers as such and when mixed with softwood kraft pulp fibers. It was concluded that textile-like nonwovens could also be made with foam forming when mechanical bonding, like hydroentanglement, was used. Asikainen et al.[Citation10] studied the mixing of 24-mm staple fibers with foam, and made fibrous sheets from the fiber-laden foam in a laboratory sheet mold. They found that the quality of final fiber sheets was very sensitive to mixing time, foam air content, and fiber weight consistency. Uniform sheets were obtained without the mechanical pretreatment of fibers, with up to 0.3% fiber consistency, which is ten times higher than in the water-laid non-woven industry.
Li et al.[Citation54] made foams with carboxymethylated lignin and compared the properties to similar sheets obtained with SDS surfactant as well as to water-formed sheets. They showed that foam-formed sheets made with carboxymethylated lignin had better bonding and tensile strength properties than those made with SDS. One challenge to using the foam process for nonwovens is to design preprocessing, like the opening of fibers and mixing them with foam so that pumps and mixers still work properly.
6.2. Packaging boards
Board manufacturers are targeting high bulk (here “bulk” refers to the inverse of density), which leads to better bending stiffness. With foam, improved water removal in the pressing section makes it possible to use lower loads in wet pressing, resulting in lower density for the final product.[Citation98] Furthermore, to increase the bulk, the use of longer or coarser fibers is possible, as foam offers high uniformity. Compensation for strength loss can be done with chemicals or additives.
Bunker et al.[Citation7] evaluated foam-forming technology in the laboratory and at pilot scale when making middle-ply for folding box board. They reported a 10% bulk increase in middle-ply at the equal internal strength level. Kiiskinen et al.[Citation6] reported pilot-scale results for a single-ply board from CTMP pulp. In their study, the increase in bulk of the foam-formed board was 18–20% higher compared to water-laid reverence at a given press solids content level ().
Figure 33. Bulk (inverse of density) and press solids content for water- and foam-formed webs made with CTMP. Three different foam density levels, 400, 500, and 650 kg/m3, were tested.[Citation6]
![Figure 33. Bulk (inverse of density) and press solids content for water- and foam-formed webs made with CTMP. Three different foam density levels, 400, 500, and 650 kg/m3, were tested.[Citation6]](/cms/asset/ee39c15b-8ed8-4af0-af7d-7863bedb3043/ldis_a_1869035_f0033_c.jpg)
Laboratory results of Bunker et al.[Citation7] indicated that with course CTMP fibers, material savings of up to 30% would be possible by changing from water forming to a foam-forming process. They tested different dry strength agents, sprayed on wet foam-formed sheets. The potential combination was the one where wet end cationic polymer and carboxymethyl cellulose (CMC) were added, and it showed a 35% increase in Scott bond in MD compared to the reference. In pilot-scale trials, equal basis weights and Scott bond results were achieved, while foam forming showed higher bulk and significantly better formation. After wet pressing, dryness increased by 5–7 percentage points in foam-formed samples compared to water-formed samples. Further pilot trials showed that with the right surfactant and other additives, like the addition of fines, the internal strength could be compensated to the reference level. Moreover, according to the study by Lehmonen et al.,[Citation107] strength loss often connected to foam forming could also be compensated for by wet pressing.
In the presentation given by Lindfors et al.,[Citation156] suitable strength additives were identified for foam-formed webs in the laboratory and their performance was verified at the pilot scale. They noticed that a cationic strength additive can be used with different anionic and nonionic surfactants when the dosing strategy is appropriate. If strength additives were applied after the addition of surfactant, anionic surfactant prevented the performance of cationic strength additives by making the additive more anionic and hydrophobic. When a strength additive was added before the surfactant, an increase in tensile strength was seen with lower dosage of cationic strength additive. It seemed that if anionic surfactant was used, there were still certain limitations, for example, with the dosing amount. With nonionic surfactant, the tensile index was increased in both dosing strategies. In pilot trials, they found a combination of cationic and anionic strength additives used with nonionic surfactant, which maintained the z-directional strength properties compared to water-formed reference. Also, their results indicate that foam forming with the right strength additives could be used for light-weighting of multi-ply board, but the addition of strength chemicals should be carefully planned for each case, and this strategy depends highly on the surfactant type.
The production of multi-ply products with foam is an interesting option. With foam-forming technology, good layer purity can be achieved and this might also lead to raw-material savings.
6.3. Specialty papers
In paper products, foam-forming technology offers good formation compared to the traditional water-laid process, especially with increasing fiber length. The effect of using foam to get superior formation was reported as early as in 1972 by Radvan and Gatward.[Citation2] Some special paper grades, like wallpaper, release papers, or industrial paper grades, could benefit from the possibility of mixing different fiber types and lengths. In addition, higher forming consistency can be seen as an advantage. However, in printing and writing paper grades, good formation is already gained with shorter fibers.
Higher surface porosity or deep surface pores can be a disadvantage if paper is coated. Forsström et al.[Citation157] coated water-formed and foam-formed papers and noticed that a more porous foam-formed structure led to a higher coat weight. Moreover, the coating penetrated deeper into the structure than in the case of water-formed papers when a traditional coating process was used. Koskela et al.[Citation158] aimed to improve the coating quality of foam-formed webs by closing the paper surface by pre-calendering or by applying starch-foam coating before pigment coating, which was done either with a metered size press (MSP) or curtain coating. Coating penetration was reduced both by pre-calendering and by starch-foam coating, while pre-calendering improved coating hold-out and smoothness more than starch but simultaneously density was increased. High bulk was maintained with starch-foam coating, and this operation closed the surface well. In their research, it seemed that the non-contact curtain coating led to lower coating penetration, maintained bulk well, and improved coating hold-out compared to MSP that uses a high-pressure pulse.
From the processing point of view, Lehmonen et al.[Citation107] reported that the achieved scale of jet-to-wire ratio as well as MD/CD-ratio were wider with foam forming than with water forming, indicating that this kind of behavior would be beneficial if the technology is scaled up to production scale. Surfactants can be selected depending on the required properties. Gottberg et al.[Citation92] reported trials in which PVA was used as a foaming agent for foam-formed paper or board produced at laboratory and pilot scale. They tested which type of PVA should be used when optimal foaming properties and strength are required. There were differences in foamability and strength properties, which depended on the molecular weight and degree of hydrolysis of PVA. By varying these parameters, one can tailor the characteristics of fiber foams and end-product properties. With paper and board pilot trials, PVA gave higher strength compared to anionic surfactant. The addition of PVA fibers improved strength significantly and gave higher Z-strength in thickness direction at low density.
6.4. Tissue
For tissue, foam forming offers improved formation, which at low basis weights can lead to higher in-plane strength[Citation149] and surface smoothness. For low basis-weight products, foam forming offers the highest potential for light weighting. Hellén et al.[Citation149] showed that tensile strength of foam-formed softwood kraft sheets was higher than that of water-laid sheets when the basis weight was below 70 g/m2. Moreover, at low basis weights, there was a significant strength difference (). Foam-formed papers also showed higher breaking strain at a certain density level and increased bursting strength compared to water-laid paper.[Citation155]
Figure 34. The effect of water and foam forming of softwood kraft pulp on tensile strength properties at different grammages.[Citation148]
![Figure 34. The effect of water and foam forming of softwood kraft pulp on tensile strength properties at different grammages.[Citation148]](/cms/asset/148172e1-cd06-48ba-8edd-7358d47915a1/ldis_a_1869035_f0034_c.jpg)
6.5. Filtering
Nowadays, filters are often made from synthetic fibers that are not biodegradable or recyclable. In air filtering, the main target is to achieve good particle capture with low pressure loss. Often, a large specific surface area and a tortuous structure improve the capturing properties. Foam forming could also be an interesting technology in this application area. As discussed in Section 5.3, pore-size distribution can be affected by changing the bubble size distribution of the foam. Tailor-made pore sizes could offer interesting opportunities for filter manufacturing. Korehei et al.[Citation102] tested how different refining energies of the MFC fiber affect filtration properties. Foam-formed samples were made by mixing of bleached softwood kraft pulp and MFC at a ratio of 90:10 wt%. They showed that when the refining energy was increased from 500 to 1500 kW/t, the filtration efficiency was improved. However, the highest refining energy level of 2500 kW/t reduced the filtration efficiency dramatically. At this refining level, the fiber length is shortest, which leads to a reduction in fiber entanglement in formed paper. The high hydrodynamic capillary forces during testing could then have caused holes and defects in the weak regions of the formed structure.
Jahangiri et al.[Citation13] found that the foam-formed papers made from bleached softwood kraft pulp and CTMP showed poor filtration efficiency due to the large pores in the material. They found the best submicron filtration properties when 10% and 30% of valley-beaten fibers were added to the bleached softwood kraft pulp as well as when freeze-drying was used with nano-fibrillated Lyocell fibers. However, FD deteriorated the strength properties dramatically. The higher filtration efficiency was achieved with shorter fibers, which also have a larger aspect ratio. The best structures captured between 85% and 90% of submicron particles, but the pressure drops were high compared to the commercial filters.
Filtratation for purifying (drinking) water would need a structure that is water-stable or water-resistant and has high wet-strength properties. There have been a few attempts by Heydarifard et al.,[Citation16,Citation17] Jain et al.,[Citation159] and Ottenhall et al.[Citation147] to improve the wet strength and antimicrobial activity of foam-formed structures to capture and deactivate micro-organisms. Heydarifard et al.[Citation17] improved wet strength by using high molecular weight, cationically modified poly(acryla-mide) (C-PAM). They showed that foam-formed paper could improve household water quality after adding antibacterial thermoplastic starch into the fiber network. The non-leaching effect of antimicrobial polymer was also proved. In another paper by Heydarifard et al.,[Citation16] wet-strength properties were improved by reacting hydroxyl-containing polymers with glutaraldehyde. They showed that wet strength was improved 10–12-fold if glutaraldehyde was used together with C-PAM. Jain et al.[Citation159] tested the antibacterial properties against Escherichia coli, Pseudomonas aeruginosa, Bacillus subtilis, and Bacillus cereus. Foamed cellulose filter, impregnated with Ag2O nanoparticles, showed higher antibacterial properties than filters impregnated with ZnO and CuO nanoparticles. Also, in this case glutaraldehyde and C-PAM were used.
Ottenhall et al.[Citation147] showed that structures with cationic chitosan had good water-stability as well as good antibacterial (against to E. coli) and antifungal (against to Aspergillus brasiliensis) properties.
6.6. Thermal insulation
Pöhler et al.[Citation14] have shown that foamed porous materials made from papermaking pulps had good thermal conductivity values in the range of 0.034–0.040 W/m K depending on the material density level (). When compared to the best cellulose-based insulation material, foam-formed materials were better than commercial ones, and they could even compete with mineral wools in thermal conductivity. Density seemed to affect thermal conductivity more than the fiber raw material. Some minor differences between different pulps were seen and thermomechnical pulp (TMP) showed the lowest thermal conductivity values. Jahangiri et al.[Citation13] also showed that the higher the air content in foaming, the better the thermal conductivity values were. The properties of their 100 g/m2 sheets were close to the commercial heat insulators like expanded polystyrene (EPS). Pöhler et al.[Citation14] mentioned that air flow resistance is important for minimizing the heat transfer by thermal convection, and it can be optimized by selecting fiber raw materials (particle size distribution) or by adjusting the z-directional density distribution,[Citation15] for example. The difference between foam-formed materials and current cellulose-based insulation mats is that foam forming enables 100% content of natural fibers in manufacturing. One advantage is also the low price of raw material compared to glass and polymer fibers.
Figure 35. Thermal conductivity as a function of bulk density. The studied pulps were softwood kraft pulp (SW), hardwood pulp (HW), cellulose microfibrils (CMF), and thermomechanical pulp (TMP). The CMF (SEC 10 MWh/t) addition was 5%, 10%, and 20% at bulk density levels 25, 42, and 48 kg/m3, respectively. Reprinted with permission from Ref. [Citation14].
![Figure 35. Thermal conductivity as a function of bulk density. The studied pulps were softwood kraft pulp (SW), hardwood pulp (HW), cellulose microfibrils (CMF), and thermomechanical pulp (TMP). The CMF (SEC 10 MWh/t) addition was 5%, 10%, and 20% at bulk density levels 25, 42, and 48 kg/m3, respectively. Reprinted with permission from Ref. [Citation14].](/cms/asset/eeeb9ebe-2e19-47bd-a5d3-b8ad1a417735/ldis_a_1869035_f0035_c.jpg)
Building products should meet fire safety regulations. The Euroclass is a classification system for building products based on the reaction-to-fire performance and used widely in the member countries of the EU. In the Euroclass system, A1 and A2 are noncombustible materials and materials certified from B to F are combustible in ascending order. One challenge is that poor reaction-to-fire properties of foam-formed materials need to be improved to meet the fire safety regulations. Zheng et al.[Citation160–162] showed that foamed cellulose insulation panels with commercial fire retardants (20% expandable graphite or 25% synergetic) passed fire class E according to the standard EN 13501-1. They also tested if coating of foam-formed materials would improve fire retardancy. A few bio-based fire retardants (sulfonated kraft lignin, kraft lignin, and nanoclay) and commercial fire retardants were mixed with MFC binder. The cellulose thermal insulation panels were then coated with those formulations. Nanoclay-coated samples showed the best fire retardancy properties. The coatings, however, increased the thermal conductivity compared to the reference without coating.
Another challenge is to improve water resistance and water absorption. Zheng et al.[Citation163] impregnated foam-formed CTMP sheets with hydrophobic extractives (from birch bark). Water resistance was improved, and the materials absorbed 50% less moisture within 24 h compared to the unmodified structures. Thermal insulation properties, fungal resistance, or compressive strength properties were not changed due to these modifications.
6.7. Sound absorption and other possible construction materials
The open pore structure of low-density cellulose fiber materials is ideal for sound absorption. Pöhler et al.[Citation144] benchmarked sound absorption properties of the fiber-based foam-formed materials to materials used commercially. In comparison with a typical acoustic product made of mineral wool, polyester fibers, or textile shoddy, similar or better sound absorption coefficients were reached. At the same density level, the air flow resistance of foam-formed softwood kraft pulp materials was higher than that of the different types of commercial materials.
Debeleac et al.[Citation164] performed experiments and computational analyses to evaluate the sound absorption properties of foam-formed structures made from bleached hardwood cellulose pulp and from recycled fibers. The results they gained were compatible with the computational experimental results, giving extended soundproof characteristics. Korehei et al.[Citation102] tested sound absorption properties of foam-formed materials using three microphone impedance tubes. The effect of the addition of MFC on the acoustical properties was on their interest. The tested materials were bleached softwood kraft, blend of softwood kraft and MFC, as well as a freeze-dried MFC sample. The first two samples were dried using the vacuum-assisted air-drying technique. Their results showed that the addition of the MFC into the structure improved sound absorption properties. The high surface area of MFC or the increased number of fibers per unit volume was given as an explanation for this. The freeze-dried MFC sample had a significantly higher sound absorption coefficient, especially at higher frequencies. Dong and Wang[Citation165] found similar improvement of sound absorption at high frequencies for foam-formed kraft fiber network with silicasol.
There are also many other interesting application areas in construction where foam-forming technology could be utilized. One example is the replacing of gypsum boards with all-cellulose structures, where foam-formed structures would be pressed into a higher density. Also, the replacement of polyurethane foam-like materials or 3D-printed insulation materials could be interesting future opportunities for foam technology. Foam forming has also been seen as a feasible technology for producing high-performance and cost-efficient thermoformable wood–plastic composite materials.[Citation166]
In future applications, addition of sensors or signaling into foam-formed products could let the material to communicate with its surroundings. In thermal insulation, a sensor could indicate, for example, increased moisture content between the walls. A printed electronic or sensor foil could be combined with a web in the foam forming or molding process. However, combining the interactive technology with the foam-formed structure should not jeopardize the specific material functionality. Some nice interior visual effects have already been demonstrated by merging led foils or optical fibers with foam-formed panels ().
Figure 36. Example of combining foam-formed material with visual elements: (a) Foam molding with included optical and wood pulp fibers. The high viscosity of wet foam helps in forming the structure. (b, c) Obtained panel after drying (photograph: Eeva Suorlahti).
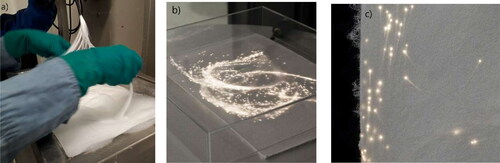
6.8. Fiber cushioning for EPS replacement
Foam-formed materials could substitute some non-biodegradable packaging solutions like inner packages based on EPS.[Citation103] One advantage is that lightweight fiber structures can be made in 3D forms, and density gradient in the structure can be adjusted in the processing stage. The foam-formed fiber products are based on 100% renewable material, and could be recycled in current streams, like cardboard is recycled nowadays. The material could also be burned or composted like paper. This is an interesting area when taking into account the fact that there might be some future limitations to the use or importation of EPS. Ketoja et al.[Citation126] and Pöhler et al.[Citation77] have studied the compression strength properties of the foam-formed fiber structures and those results are discussed in Section 5.5. On the other hand, for this kind of inner packaging material, the fast platen drop test () is probably more relevant for testing cushioning properties. Ketoja et al.[Citation20] showed in their conference presentation that foam-formed complex shapes can have high local density (>100 kg/m3), and in the meantime have reduced effective density (<20 kg/m3) because of empty regions. They showed a more than tenfold improvement in compression strength properties just by changing the geometry ().
Figure 37. Geometry of the complex foam-formed shapes also affects the strength properties, as can be seen from the picture where the ‘Pyramid B’ complex shape made with CTMP fibers is compared with different kinds of polymer foams and other materials.[Citation20]
![Figure 37. Geometry of the complex foam-formed shapes also affects the strength properties, as can be seen from the picture where the ‘Pyramid B’ complex shape made with CTMP fibers is compared with different kinds of polymer foams and other materials.[Citation20]](/cms/asset/14732b24-5ff8-499b-a4a6-69cff234215c/ldis_a_1869035_f0037_c.jpg)
7. Summary and future prospects
Foam forming is a new technology that helps the industry meet several urgent material development needs: replacing plastics with biobased alternatives, improving the material efficiency (i.e., lowering the density of a product), enabling novel material combinations (e.g., including very long fibers and components that are lighter than water), and creating added-value products with a tailored porous structure. Moreover, foam can give new life to old paper machines that lack the efficiency required to compete against modern paperboard production. It is relatively easy to update the forming section of a paper machine to operate with foam, keeping essential parts of the dewatering, pressing, and drying units unchanged. Their operation needs to be optimized for the foam forming, which requires systematic trials and planning work. The biggest burden is to modify the approach and the circulation systems so that they can handle and recover surfactants during the process. Process elements like pumps, screens, cleaning systems, and process instrumentation are specifically designed for water processes and do not necessary work for foam as they are. Efficient process may also need systems for recovering surfactant from the process water. However, there are already examples at the pilot scale showing that required process modifications are possible with reasonable costs.
Foam rheology is important for the mixing, transfer, and forming of fibers. Rheological studies using simple pipe geometries indicate that added fibers play a minor role in rheological behavior, which is an asset in developing simple and stable processes and homogeneous product structures. The physical and chemical properties of the foam itself become a toolbox for advanced process and product control. In particular, foam quality can be used to control the microporous structure beyond earlier possibilities.
Foam forming improves production efficiency in terms of significantly higher solids content after forming and wet pressing. A typical improvement in solids content is about 5%-units, which can lead to a ca. 20% saving in drying energy. Moreover, in web products, typically around 10% lower material density can be achieved without deteriorating other material properties like strength and stiffness. This reduction in material usage has been a long-standing target for paper and board makers, having a big impact on raw-material costs.
A main challenge in foam forming is associated with compensation of the strength loss caused by reduced density. Besides selecting proper raw materials, the choice of foaming agent may also be critical. For example, charges of surfactant molecules can interact with those of fibers and polymers, affecting their bonding. Moreover, the compatibility of surfactant with other process chemicals like hydrophobization agents has to be ensured. On the other hand, foaming agents like PVA can also be used as a strength additive and to functionalize the formed structure, which may help to reduce the amount of other chemicals in the process.
Despite well-established research tradition on fundamental foam physics and chemistry, there are several open scientific questions related to the foam-forming application. Most of the fundamental research has concentrated on relatively dry foams, whereas in foam technologies the carrier phase can extend from bubbly liquids, sufficient for web forming, to very stable foams needed to mold ultra-lightweight materials. The viscosity of foam changes dramatically between these two extremes. Moreover, the interaction between bubbles and fibers can depend on surfactant concentration and fiber surface properties. Rather little is still known about these fundamental phenomena related to wet fiber foams. Moreover, there are some results on how the formed structure can be altered using foam properties, but systematic understanding of these possibilities is still lacking. This also applies to the fiber orientation control that is one of the key process properties in web forming, having an impact on the anisotropy of strength properties.
The removal of wet foam from the formed structure is another essential part of the process. Very little is known about the structural evolution during the intermediate stages of this process, where drainage, foam coarsening, and structural collapse all take place simultaneously. Finally, it is difficult to define the most efficient drying procedure of the formed fiber network. This problem is particularly important for thick materials, where moisture removal can take a relatively long time and requires a lot of energy. The resulting questions are both fundamental and practical: When and how do the last liquid membranes disappear from a fiber network, and how does that influence the drying speed? What kind of drying technology should be used, and how does the chosen technology affect the product structure and properties?
| Abbreviations | ||
| Ca | = | Capillary number |
| CCD | = | charge-coupled device |
| CD | = | cross-machine direction |
| CMC | = | carboxymethyl cellulose |
| CNF | = | cellulose nanofiber |
| C-PAM | = | cationically modified poly(acryla-mide) |
| CTMP | = | chemithermomechanical pulp |
| 3D | = | three-dimensional |
| EPS | = | expanded polystyrene |
| FD | = | freeze-drying |
| MD | = | machine direction |
| MFC | = | microfibrillated cellulose |
| MSP | = | metered size press |
| PLA | = | polylactic acid |
| PVA | = | polyvinyl alcohol |
| Re | = | Reynolds number |
| SDS | = | sodium dodecyl sulfate |
| SEM | = | scanning electron microscope |
| VAD | = | vacuum-dewatered air-drying |
| VFD | = | vacuum-assisted dewatering followed by freeze-drying |
Acknowledgments
We are grateful for the support from the FinnCERES Materials Bioeconomy Ecosystem. We would like to thank Päivi Vahala-Partanen and Anastasia Ivanova for their help in preparing the figures and Eeva Suorlahti for photographs in the abstract graphic and in .
Disclosure statement
The authors declare that they have no competing interests.
Additional information
Funding
References
- Radvan, B. Basic Radfoam Process. British Patent 1329409, 20, 1964.
- Radvan, B.; Gatward, A. P. J. The Formation of Wet-Laid Webs by a Foaming Process. TAPPI J 1972, 55, 748–751.
- Smith, M. K.; Punton, V. W.; Rixson, A. G. The Structure and Properties of Paper Formed by a Foaming Process. TAPPI J 1974, 57, 107–111.
- Lehmonen, J.; Jetsu, P.; Kinnunen, K.; Hjelt, T. Potential of Foam-Laid Forming Technology in Paper Applications. Nord. Pulp Pap. Res. J 2013, 28, 392–398. DOI: https://doi.org/10.3183/npprj-2013-28-03-p392-398.
- Kinnunen-Raudaskoski, K. Foam as a Carrier Phase – a Multipurpose Technology for Industrial Applications, Doctoral Dissertation, Aalto University, 2017.
- Kiiskinen, H.; Salminen, K.; Lappalainen, T.; Asikainen, J.; Keränen, J.; Hellén, E. Progress in Foam Forming Technology. TAPPI J 2019, 18, 499–510. DOI: https://doi.org/10.32964/TJ18.8.499.
- Bunker, D.; Cecchini, J.; Hietaniemi, M.; Virtanen, M.; Torvinen, K.; Asikainen, J.; Salminen, K. Foam Forming Technology Folding Box Board Focused Developments. In Paper Conference and Trade Show (PaperCon 2017); TAPPI: Minneapolis, 2017; p 1802.
- Heikkilä, P.; Jetsu, P.; Pöhler, T.; Ketoja, J.; Tanaka, A.; Lehmonen, J.; Kinnunen-Raudaskoski, K.; Hjelt, T.; Koskela, H.; Forsström, U.; et al. Foam Technologies in Production and Finishing of Nonwoven Materials. In 15th AUTEX World Textile Conference 2015, Bucharest, Romania; 2015.
- Nikinmaa, M. S. Wet-Lay of Synthetic Fibers with Complex Fluids. PhD Dissertation, North Carolina State University, 2018.
- Asikainen, J.; Saharinen, E.; Koponen, A. Dispersion of 24 Mm Staple Fibers with Foam. J. Eng. Fiber. Fabr 2020, 15, 155892502094644. DOI: https://doi.org/10.1177/1558925020946441.
- Poranen, J.; Kiiskinen, H.; Salmela, J.; Asikainen, J.; Keränen, J.; Pääkkönen, E. Breakthrough in Papermaking Resource Efficiency with Foam Forming. In Proceedings of TAPPI PaperCon, Atlanta, GA, USA 2013, pp 807–814.
- Madani, A.; Zeinoddini, S.; Varahmi, S.; Turnbull, H.; Phillion, A. B.; Olson, J. A.; Martinez, D. M. Ultra-Lightweight Paper Foams: Processing and Properties. Cellulose 2014, 21, 2023–2031. DOI: https://doi.org/10.1007/s10570-014-0197-3.
- Jahangiri, P.; Korehei, R.; Zeinoddini, S. S.; Madani, A.; Sharma, Y.; Phillion, A.; Martinez, D. M.; Olson, J. A. On Filtration and Heat Insulation Properties of Foam Formed Cellulose Based Materials. Nord. Pulp. Pap. Res. 2014, 29, 584–591. DOI: https://doi.org/10.3183/npprj-2014-29-04-p584-591.
- Pöhler, T.; Jetsu, P.; Fougerón, A.; Barraud, V. Use of Papermaking Pulps in Foam-Formed Thermal Insulation Materials. Nord. Pulp. Pap. Res. J 2017, 32, 367–374. DOI: https://doi.org/10.3183/npprj-2017-32-03-p367-374.
- Lecourt, M.; Pöhler, T.; Hornatowska, J.; Salmén, L.; Jetsu, P. Density Profiles of Novel Kraft Pulp and TMP Based Foam Formed Thermal Insulation Materials Observed by X-Ray Tomography and Densitometry. Holzforschung 2018, 72, 397–403. DOI: https://doi.org/10.1515/hf-2017-0116.
- Heydarifard, S.; Nazhad, M. M.; Xiao, H.; Shipin, O.; Olson, J. Water-Resistant Cellulosic Filter for Aerosol Entrapment and Water Purification, Part I: Production of Water-Resistant Cellulosic Filter. Environ. Technol. 2016, 37, 1716–1722. DOI: https://doi.org/10.1080/09593330.2015.1130174.
- Heydarifard, S.; Pan, Y.; Xiao, H.; Nazhad, M.; Shipin, O. Water-Resistant Cellulosic Filter Containing Non-Leaching Antimicrobial Starch for Water Purification and Disinfection. Carbohydr. Polym. 2017, 163, 146–152. DOI: https://doi.org/10.1016/j.carbpol.2017.01.063.
- Koponen, A.; Torvinen, K.; Jäsberg, A.; Kiiskinen, H. Foam Forming of Long Fibers. Nord. Pulp Pap. Res. J. 2016, 31, 239–247. DOI: https://doi.org/10.3183/npprj-2016-31-02-p239-247.
- Härkäsalmi, T.; Lehmonen, J.; Itälä, J.; Peralta, C.; Siljander, S.; Ketoja, J. A. Design-Driven Integrated Development of Technical and Perceptual Qualities in Foam-Formed Cellulose Fibre Materials. Cellulose 2017, 24, 5053–5068. DOI: https://doi.org/10.1007/s10570-017-1484-6.
- Ketoja, J. A.; Ivanova, A.; Tanaka, A.; Nurminen, I.; Kääriäinen, P. Enhancing Mechanical Performance of Cellulose Materials with Designed Structural Complexity. In Abstract from 257th National Meeting of the American Chemical Society, Orlando, United States; 2019.
- Al-Qararah, A. M.; Ekman, A.; Hjelt, T.; Ketoja, J. A.; Kiiskinen, H.; Koponen, A.; Timonen, J. A. Unique Microstructure of the Fiber Networks Deposited from Foam-Fiber Suspensions. Colloid Surfaces A Physicochem. Eng. Asp. 2015, 482, 544–553. DOI: https://doi.org/10.1016/j.colsurfa.2015.07.010.
- Al-Qararah, A. M. Aqueous Foam as the Carrier Phase in the Deposition of Fibre Networks. PhD Dissertation, University of Jyväskylä, 2015. Jyväskylä.
- Jäsberg, A.; Selenius, P.; Koponen, A. Experimental Results on the Flow Rheology of Fiber-Laden Aqueous Foams. Colloids Surfaces A Physicochem. Eng. Asp. 2015, 473, 147–155. DOI: https://doi.org/10.1016/j.colsurfa.2014.11.041.
- Punton, V. 1975. Fibre Distribution in Foam and Foam-Laid Paper. In Int. Paper Physics Conf.; Ellenville, New York, USA.
- Alimadadi, M.; Uesaka, T. 3D-Oriented Fiber Networks Made by Foam Forming. Cellulose 2016, 23, 661–671. DOI: https://doi.org/10.1007/s10570-015-0811-z.
- Al-Qararah, A. M.; Hjelt, T.; Koponen, A.; Harlin, A.; Ketoja, J. A. Bubble Size and Air Content of Wet Fibre Foams in Axial Mixing with Macro-Instabilities. Colloids Surfaces A Physicochem. Eng. Asp. 2013, 436, 1130–1139. DOI: https://doi.org/10.1016/j.colsurfa.2013.08.051.
- Al-Qararah, A. M.; Hjelt, T.; Koponen, A.; Harlin, A.; Ketoja, J. A. Response of Wet Foam to Fibre Mixing. Colloids Surfaces A Physicochem. Eng. Asp. 2015, 467, 97–106. DOI: https://doi.org/10.1016/j.colsurfa.2014.11.034.
- Haffner, B.; Dunne, F. F.; Burke, S. R.; Hutzler, S. Ageing of Fibre-Laden Aqueous Foams. Cellulose 2017, 24, 231–239. DOI: https://doi.org/10.1007/s10570-016-1100-1.
- Hou, Q.; Wang, X. Effect of Fiber Surface Characteristics on Foam Properties. Cellulose 2018, 25, 3315–3325. DOI: https://doi.org/10.1007/s10570-018-1824-1.
- Xiang, W. Interfacial Stabilization of Multiphase Systems with (Ligno)Cellulosic (Nano)Materials and Surfactants. Doctoral Dissertation, Aalto University, 2019.
- Ketola, A. E.; Xiang, W.; Hjelt, T.; Pajari, H.; Tammelin, T.; Rojas, O. J.; Ketoja, J. A. Bubble Attachment to Cellulose and Silica Surfaces of Varied Surface Energies: Wetting Transition and Implications in Foam Forming. Langmuir 2020, 36, 7296–7308. DOI: https://doi.org/10.1021/acs.langmuir.0c00682.
- Ferreira, F. V.; Otoni, C. G.; De France, K. J.; Barud, H. S.; Lona, L. M. F.; Cranston, E. D.; Rojas, O. J. Porous Nanocellulose Gels and Foams: Breakthrough Status in the Development of Scaffolds for Tissue Engineering. Mater. Today 2020, 37, 126–141. DOI: https://doi.org/10.1016/j.mattod.2020.03.003.
- Kim, I. J.; Park, J. G.; Han, Y. H.; Kim, S. Y.; Shackelford, J. F. Wet Foam Stability from Colloidal Suspension to Porous Ceramics: A Review. J. Korean Ceram. Soc. 2019, 56, 211–232. DOI: https://doi.org/10.4191/kcers.2019.56.3.02.
- Stochero, N. P.; Guzi de Moraes, E.; Novaes de Oliveira, A. P. Influence of Wet Foam Stability on the Microstructure of Ceramic Shell Foams. Open Ceram. 2020, 4, 100033. DOI: https://doi.org/10.1016/j.oceram.2020.100033.
- Jin, F. L.; Zhao, M.; Park, M.; Park, S. J. Recent Trends of Foaming in Polymer Processing: A Review. Polymers (Basel). 2019, 11, 953. DOI: https://doi.org/10.3390/polym11060953.
- Kinnunen-Raudaskoski, K.; Hjelt, T.; Kenttä, E. A.; Forsström, U. A. Thin Coatings for Paper by Foam Coating. TAPPI J 2014, 13, 9–19. DOI: https://doi.org/10.32964/TJ13.7.9.
- Weaire, D.; Hutzler, S. The Physics of Foams; Oxford University Press: Oxford, 1999.
- Cohen-Addad, S.; Höhler, R. Rheology of Foams and Highly Concentrated Emulsions. Curr. Opin. Colloid Interface Sci. 2014, 19, 536–548. DOI: https://doi.org/10.1016/j.cocis.2014.11.003.
- Saint-Jalmes, A.; Durian, D. J. Vanishing Elasticity for Wet Foams: Equivalence with Emulsions and Role of Polydispersity. J. Rheol. (N.Y.). 1999, 43, 1411–1412. DOI: https://doi.org/10.1122/1.551052.
- Drenckhan, W.; Hutzler, S. Structure and Energy of Liquid Foams. Adv Colloid Interface Sci. 2015, 224, 1–16. DOI: https://doi.org/10.1016/j.cis.2015.05.004.
- Sun, Q.; Tan, L.; Wang, G. Liquid Foam Drainage: An Overview. Int. J. Mod. Phys. B. 2008, 22, 2333–2354. DOI: https://doi.org/10.1142/S0217979208039514.
- Weaire, D.; Cox, S.; Brakke, K. Liquid Foams—Precursors for Solid Foams. In Cellular Ceramics: Structure, Manufacturing, Properties and Applications; Scheffler, M., Colombo, P., Eds.; Wiley, 2006; pp 18–30. DOI: https://doi.org/10.1002/3527606696.ch1b.
- Denkov, N. D.; Tcholakova, S.; Golemanov, K.; Ananthpadmanabhan, K. P.; Lips, A. The Role of Surfactant Type and Bubble Surface Mobility in Foam Rheology. Soft Matter 2009, 5, 3389. DOI: https://doi.org/10.1039/b903586a.
- Herzhaft, B.; Kakadjian, S.; Moan, M. Measurement and Modeling of the Flow Behavior of Aqueous Foams Using a Recirculating Pipe Rheometer. Colloid Surfaces A Physicochem. Eng. Aspects 2005, 263, 153–164. DOI: https://doi.org/10.1016/j.colsurfa.2005.01.012.
- Koponen, A.; Jäsberg, A.; Lappalainen, T.; Kiiskinen, H. The Effect of in-Line Generation of Foam on the Foam Quality and the Sheet Formation in Foam Forming. Nord. Pulp Pap. Res. J. 2018, 33, 482–495. DOI: https://doi.org/10.1515/npprj-2018-3051.
- Mira, I.; Andersson, M.; Boge, L.; Blute, I.; Carlsson, G.; Salminen, K.; Lappalainen, T.; Kinnunen, K. Foam Forming Revisited Part I. Foaming Behaviour of Fibre-Surfactant Systems. Nord. Pulp Pap. Res. J. 2014, 29, 679–689. DOI: https://doi.org/10.3183/npprj-2014-29-04-p679-689.
- Whyte, D.; Haffner, B.; Tanaka, A.; Hjelt, T.; Hutzler, S. Interactions of Fibres with Simple Arrangements of Soap Films. Colloid Surfaces A Physicochem. Eng. Asp. 2017, 534, 112–119. DOI: https://doi.org/10.1016/j.colsurfa.2017.02.037.
- Smith, M. K.; Punton, V. W. Foam Can Improve Formation. Pulp Pap. Canada 1975, 76, 55–58.
- Kruglyakov, P.; Karakashev, S.; Nguyen, A.; Vilkova, N. Foam Drainage. Curr. Opin. Colloid Interface Sci. 2008, 13, 163–170. DOI: https://doi.org/10.1016/j.cocis.2007.11.003.
- Saint-Jaimes, A. Physical Chemistry in Foam Drainage and Coarsening. Soft Matter. 2006, 2, 836–849. DOI: https://doi.org/10.1039/b606780h.
- Guignot, S.; Faure, S.; Vignes-Adler, M.; Pitois, O. Liquid and Particles Retention in Foamed Suspensions. Chem. Eng. Sci. 2010, 65, 2579–2585. DOI: https://doi.org/10.1016/j.ces.2009.12.039.
- Stevenson, P. Dimensional Analysis of Foam Drainage. Chem. Eng. Sci. 2006, 61, 4503–4510. DOI: https://doi.org/10.1016/j.ces.2006.02.026.
- Lam, S.; Velikov, K. P.; Velev, O. D. Pickering Stabilization of Foams and Emulsions with Particles of Biological Origin. Curr. Opin. Colloid Interface Sci. 2014, 19, 490–500. DOI: https://doi.org/10.1016/j.cocis.2014.07.003.
- Li, S.; Xiang, W.; Järvinen, M.; Lappalainen, T.; Salminen, K.; Rojas, O. J. Interfacial Stabilization of Fiber-Laden Foams with Carboxymethylated Lignin toward Strong Nonwoven Networks. ACS Appl. Mater. Interfaces 2016, 8, 19827–19835. DOI: https://doi.org/10.1021/acsami.6b06418.
- Cervin, N. T.; Andersson, L.; Ng, J. B. S.; Olin, P.; Bergström, L.; Wågberg, L. Lightweight and Strong Cellulose Materials Made from Aqueous Foams Stabilized by Nanofibrillated Cellulose. Biomacromolecules 2013, 14, 503–511. DOI: https://doi.org/10.1021/bm301755u.
- Xiang, W.; Preisig, N.; Ketola, A.; Tardy, B. L.; Bai, L.; Ketoja, J. A.; Stubenrauch, C.; Rojas, O. J. How Cellulose Nanofibrils Affect Bulk, Surface, and Foam Properties of Anionic Surfactant Solutions. Biomacromolecules 2019, 20, 4361–4369. DOI: https://doi.org/10.1021/acs.biomac.9b01037.
- Heller, J. P.; Kuntamukkula, M. S. Critical Review of the Foam Rheology Literature. Ind. Eng. Chem. Res. 1987, 26, 318–325. DOI: https://doi.org/10.1021/ie00062a023.
- Herzhaft, B. Rheology of Aqueous Foams: A Literature Review of Some Experimental Works. Oil Gas Sci. Technol. Rev. IFP. 1999, 54, 587–596. DOI: https://doi.org/10.2516/ogst:1999050.
- Höhler, R.; Cohen-Addad, S. Rheology of Liquid Foam. J. Phys: Condens. Matter. 2005, 17, R1041–R1069. DOI: https://doi.org/10.1088/0953-8984/17/41/R01.
- Zhao, J.; Pillai, S.; Pilon, L. Rheology of Colloidal Gas Aphrons (Microfoams) Made from Different Surfactants. Colloids Surfaces A Physicochem. Eng. Asp. 2009, 348, 93–99. DOI: https://doi.org/10.1016/j.colsurfa.2009.06.037.
- Dollet, B.; Raufaste, C. Rheology of Aqueous Foams. Comptes. Rendus. Phys. 2014, 15, 731–747. DOI: https://doi.org/10.1016/j.crhy.2014.09.008.
- Prud’homme, R. K., Khan, S. A., Eds.; Foams: Theory, Measurements, and Applications; Marcel Dekker: New York, 1995.
- Princen, H. M. Rheology of Foams and Highly Concentrated Emulsions. I. Elastic Properties and Yield Stress of a Cylindrical Model System. J. Colloid Interface Sci. 1983, 91, 160–175. DOI: https://doi.org/10.1016/0021-9797(83)90323-5.
- Princen, H. M.; Kiss, A. D. Rheology of Foams and Highly Concentrated Emulsions. III. Static Shear Modulus. J. Colloid Interface Sci. 1986, 112, 427–437. (86)90111-6. DOI: https://doi.org/10.1016/0021-9797(86)90111-6.
- Thondavadi, N.; Lemlich, R. Flow Properties of Foam with and without Solid Particles. Ind. Eng. Chem. Proc. Des. Dev. 1985, 24, 748–753. DOI: https://doi.org/10.1021/i200030a038.
- Cohen-Addad, S.; Krzan, M.; Höhler, R.; Herzhaft, B. Rigidity Percolation in Particle-Laden Foams. Phys. Rev. Lett. 2007, 99, 168001–168022. DOI: https://doi.org/10.1103/PhysRevLett.99.168001.
- Jäsberg, A.; Selenius, P.; Koponen, A. The Effect of Fibrous Materials on the Rheology of Aqueous Foams. In 16th Fundamental Research Symposium; Oxford, 2017; pp 159–174.
- Lexis, M.; Willenbacher, N. Yield Stress and Elasticity of Aqueous Foams from Protein and Surfactant Solutions—The Role of Continuous Phase Viscosity and Interfacial Properties. Colloids Surfaces A Physicochem. Eng. Asp. 2014, 459, 177–185. DOI: https://doi.org/10.1016/j.colsurfa.2014.06.030.
- Rouyer, F.; Cohen-Addad, S.; Höhler, R. Is the Yield Stress of Aqueous Foam a Well-Defined Quantity? Colloids Surfaces A Physicochem. Eng. Asp. 2005, 263, 111–116. (1-3 SPEC. ISS.). DOI: https://doi.org/10.1016/j.colsurfa.2005.01.025.
- Mitchell, B. J. Test Data Fill Theory Gap on Using Foam as a Drilling Fluid. Oil Gas J. 1971, 69, 96–100.
- Shakib-Manesh, A.; Raiskinmäki, P.; Koponen, A.; Kataja, M.; Timonen, J. Shear Stress in a Couette Flow of Liquid-Particle Suspensions. J. Stat. Phys. 2002, 107, 67–84. DOI: https://doi.org/10.1023/A:1014598201975.
- Soleymanzadeh, A.; Gahrooei, H. R. E.; Joekar-Niasar, V. A New Empirical Model for Bulk Foam Rheology. J. Energy Resour. Technol. 2017, 140, 032911. DOI: https://doi.org/10.1115/1.4038385..
- Llewellin, E. W.; Mader, H. M.; Wilson, S. D. R. The Rheology of a Bubbly Liquid. Proc. R Soc. Lond. A. 2002, 458, 987–1016. DOI: https://doi.org/10.1098/rspa.2001.0924.
- Llewellin, E. W.; Manga, M. Bubble Suspension Rheology and Implications for Conduit Flow. J. Volcanol. Geotherm. Res. 2005, 143, 205–217. DOI: https://doi.org/10.1016/j.jvolgeores.2004.09.018.
- Pal, R. Rheological Behaviour of Bubble-Bearing Magmas. Earth Planet. Sci. Lett. 2003, 207, 165–179. DOI: https://doi.org/10.1016/S0012-821X(02)01104-4.
- Punton, V. The Use of an Aqueous Foam as a Fiber-Suspending Medium in Quality Papermaking. In Proceedings of a Symposium Organized by the Society of the Chemical Industry, Colloid and Surface Chemistry Group; Brunel University, 1975; pp 179–194.
- Pöhler, T.; Ketoja, J. A.; Lappalainen, T.; Luukkainen, V.-M.; Nurminen, I.; Lahtinen, P.; Torvinen, K. On the Strength Improvement of Lightweight Fibre Networks by Polymers, Fibrils and Fines. Cellulose 2020, 27, 6961–6976. DOI: https://doi.org/10.1007/s10570-020-03263-x.
- Gardiner, B. S.; Dlugogorski, B. Z.; Jameson, G. J. Rheology of Fire-Fighting Foams 1998, 31, 61–75.
- Enzendorfer, C.; Harris, R. A.; Valkó, P.; Economides, M. J.; Fokker, P. A.; Davies, D. D. Pipe Viscometry of Foams. J. Rheol. (N.Y.). 1995, 39, 345–358. DOI: https://doi.org/10.1122/1.550701.
- Tisné, P.; Doubliez, L.; Aloui, F. Determination of the Slip Layer Thickness for a Wet Foam Flow. Colloids Surfaces A Physicochem. Eng. Asp. 2004, 246, 21–29. DOI: https://doi.org/10.1016/j.colsurfa.2004.07.014.
- Marze, S.; Langevin, D.; Saint-Jalmes, A. Saint-Jalmes, A. Aqueous Foam Slip and Shear Regimes Determined by Rheometry and Multiple Light Scattering. J. Rheol. (N. Y.). 2008, 52, 1091–1111. DOI: https://doi.org/10.1122/1.2952510.
- Calvert, J. R. Pressure Drop for Foam Flow through Pipes. Int. J. Heat Fluid Flow. 1990, 11, 236–241. DOI: https://doi.org/10.1016/0142-727X(90)90042-A.
- Gardiner, B. S.; Dlugogorski, B. Z.; Jameson, G. J. Prediction of Pressure Losses in Pipe Fslow of Aqueous Foams. Ind. Eng. Chem. Res. 1999, 38, 1099–1106. DOI: https://doi.org/10.1021/ie980385i.
- Briceno, M. I.; Joseph, D. D. Self-Lubricated Transport of Aqueous Foams in Horizontal Conduits. Int. J. Multiph. Flow 2003, 29, 1817–1831. DOI: https://doi.org/10.1016/j.ijmultiphaseflow.2003.10.001.
- Deshpande, N. S.; Barigou, M. The Flow of Gas/Liquid Foams in Vertical Pipes. Chem. Eng. Sci. 2000, 55, 4297–4309. DOI: https://doi.org/10.1016/S0009-2509(00)00057-9.
- Lehmonen, J.; Retulainen, E.; Paltakari, J.; Kinnunen-Raudaskoski, K.; Koponen, A. Dewatering of Foam-Laid and Water-Laid Structures and the Formed Web Properties. Cellulose 2020, 27, 1127–1146. DOI: https://doi.org/10.1007/s10570-019-02842-x.
- Skelton, J. Foam Assisted Dewatering - a New Technology Emerges. Pap. Technol. Ind. 1987, 431–436.
- Lemmen, J.; Wassink, J. Flow of Foam through Plain Perforated and Woven Metal Screens. J. Soc. Dye. Colour 2008, 106, 235–240. DOI: https://doi.org/10.1111/j.1478-4408.1990.tb01260.x.
- Hirasaki, G.; Lawson, J. Mechanisms of Foam Flow in Porous Media: Apparent Viscosity in Smooth Capillaries. Soc. Pet. Eng. J. 1985, 25, 176–191. DOI: https://doi.org/10.2118/12129-PA.
- Viitala, J.; Lappalainen, T.; Järvinen, M. Sodium Dodecyl Sulphate (SDS) Residue Analysis of Foam-Formed Cellulose-Based Products. Nord. Pulp Pap. Res. J. 2020, 35, 261–271. DOI: https://doi.org/10.1515/npprj-2019-0058.
- Lappalainen, T.; Salminen, K.; Kinnunen, K.; Järvinen, M.; Mira, I.; Andersson, M. Foam Forming Revisited. Part II. Effect of Surfactant on the Properties of Foam-Formed Paper Products. Nord. Pulp Pap. Res. J. 2014, 29, 689–699. DOI: https://doi.org/10.3183/npprj-2014-29-04-p689-699.
- Gottberg, J. M.; Lappalainen, T.; Salminen, K. Polyvinyl Alcohol as Foaming Agent in Foam Formed Paper. In Paper Conference and Trade Show (PaperCon 2017); TAPPI: Minneapolis, 2017.
- Hou, Q.; Wang, X. The Effect of PVA Foaming Characteristics on Foam Forming. Cellulose 2017, 24, 4939–4948. DOI: https://doi.org/10.1007/s10570-017-1452-1.
- Xiang, W.; Filpponen, I.; Saharinen, E.; Lappalainen, T.; Salminen, K.; Rojas, O. J. Foam Processing of Fibers as a Sustainable Alternative to Wet-Laying: Fiber Web Properties and Cause-Effect Relations. ACS Sustainable Chem. Eng. 2018, 6, 14423–14431. DOI: https://doi.org/10.1021/acssuschemeng.8b03102.
- Kouko, J.; Prakash, B.; Luukkainen, V.-M.; Jäsberg, A.; Koponen, A. I. Generation of Aqueous Foams and Fiber Foams in a Stirred Tank. Chem. Eng. Res. Des. 2020, DOI: https://doi.org/10.1016/j.cherd.2020.12.013..
- Boos, J.; Drenckhan, W.; Stubenrauch, C. On How Surfactant Depletion during Foam Generation Influences Foam Properties. Langmuir 2012, 28, 9303–9310. DOI: https://doi.org/10.1021/la301140z.
- Xiang, W.; Preisig, N.; Laine, C.; Hjelt, T.; Tardy, B. L.; Stubenrauch, C.; Rojas, O. J. Surface Activity and Foaming Capacity of Aggregates Formed between an Anionic Surfactant and Non-Cellulosics Leached from Wood Fibers. Biomacromolecules 2019, 20, 2286–2294. DOI: https://doi.org/10.1021/acs.biomac.9b00243.
- Järvinen, M.; Pihko, R.; Ketoja, J. A. Density Development in Foam Forming: Wet Pressing Dynamics. Nord. Pulp Pap. Res. J. 2018, 33, 226–236. DOI: https://doi.org/10.1515/npprj-2018-3031.
- Järvinen, M.; Pihko, R.; Nurminen, I.; Ketoja, J. A. Unique Compression Behavior of Foam-Formed Sheets in Wet Pressing and Calendering. In Paper Conference and Trade Show, PaperCon 2019, 2019, 181–194.
- Koponen, A. I.; Timofeev, O.; Jäsberg, A.; Kiiskinen, H. Drainage of High-Consistency Fiber-Laden Aqueous Foams. Cellulose 2020, 27, 9637–9652. DOI: https://doi.org/10.1007/s10570-020-03416-y.
- Timofeev, O.; Jetsu, P.; Kiiskinen, H.; Keränen, J. T. Drying of Foam-Formed Mats from Virgin Pine Fibers. Dry. Technol 2016, 34, 1210–1218. DOI: https://doi.org/10.1080/07373937.2015.1103254.
- Korehei, R.; Jahangiri, P.; Nikbakht, A.; Martinez, M.; Olson, J. Effects of Drying Strategies and Microfibrillated Cellulose Fiber Content on the Properties of Foam-Formed Paper. J. Wood Chem. Technol 2016, 36, 235–249. DOI: https://doi.org/10.1080/02773813.2015.1116012.
- Pääkkönen, E. How to Replace Non-Renewable Packaging Materials? In European Paper Week, EPW 2017, Brussels, Belgium 2017.
- Gatward, A.; Radvan, B. Method and Apparatus for Forming a Non-Woven Fibrous Web from a Foamed Fiber Furnish. Patent US3716449A, 1973.
- Kidner, T. L. The Radfoam Process for Fine Paper. Pap. Technol. 1974, 346–351.
- Salminen, K.; Lappalainen, T.; Kiiskinen, H.; Sinkkonen, M. Foam Forming - Effects of Different Variables on Fiber Foam Characteristics. In Paper Conference and Trade Show, PaperCon 2015 2015, 2, 1425–1435.
- Lehmonen, J.; Rantanen, T.; Kinnunen-Raudaskoski, K. Upscaling of Foam Forming Technology for Pilot Scale. TAPPI J. 2019, 461–471.
- Lehmonen, J.; Retulainen, E.; Kraft, M.; Paltakari, J.; Kinnunen-Raudaskoski, K. Foam Forming under Dynamic Conditions. BioResources 2020, 15, 6309–6331. DOI: https://doi.org/10.15376/biores.15.3.6309-6331.
- Kroezen, A. B. J.; Groot Wassink, J.; Bertlein, E. Foam Generation in a Rotor-Stator Mixer. Schaumerzeugung in Einem Rotor-Stator Mischer. Chem. Eng. Process 1988, 24, 145–156. DOI: https://doi.org/10.1016/0255-2701(88)80018-7.
- Matula, J.; Matula, J.; Cecchini, J.; Vesala, R. Fast Flash Mixing in Generation of Micro Air Bubbles for Foam and Process Dynamics in Foam Forming. In Paper Conference and Trade Show (PaperCon 2017); TAPPI, 2017.
- Olejnik, K. Water Consumption in Paper Industry—Reduction Capabilities and the Consequences. In Security of Industrial Water Supply and Management; Atimtay, A. T., Sikdar, S. K., Eds.; Springer, 2011; pp 113–130. DOI: https://doi.org/10.1007/978-94-007-1805-0_8.
- Kamali, M.; Khodaparast, Z. Review on Recent Developments on Pulp and Paper Mill Wastewater Treatment. Ecotoxicol. Environ. Saf. 2015, 114, 326–342. DOI: https://doi.org/10.1016/j.ecoenv.2014.05.005.
- Boonyasuwat, S.; Chavadej, S.; Malakul, P.; Scamehorn, J. F. Anionic and Cationic Surfactant Recovery from Water Using a Multistage Foam Fractionator. Chem. Eng. J. 2003, 93, 241–252. DOI: https://doi.org/10.1016/S1385-8947(03)00043-3.
- Du, L.; Loha, V.; Tanner, R. D. Modeling a Protein Foam Fractionation Process. ABAB. 2000, 84–86, 1087–1099. DOI: https://doi.org/10.1385/ABAB:84-86:1-9:1087.
- Kowalska, I.; Kabsch-Korbutowicz, M.; Majewska-Nowak, K.; Winnicki, T. Separation of Anionic Surfactants on Ultrafiltration Membranes. Desalination 2004, 162, 33–40. DOI: https://doi.org/10.1016/S0011-9164(04)00024-4.
- Kinsler, L. E.; Frey, A. R.; Coppens, A. B.; Sanders, J. V. Fundamentals of Acoustics, 3rd ed.; Wiley, 1982.
- Pierre, J.; Guillermic, R. M.; Elias, F.; Drenckhan, W.; Leroy, V. Acoustic Characterisation of Liquid Foams with an Impedance Tube. Eur. Phys. J. E Soft Matter. 2013, 36, 113. DOI: https://doi.org/10.1140/epje/i2013-13113-1.
- Eren, H. Electromagnetic Flowmeters. In Measurement, Instrumentation, and Sensors Handbook: Spatial, Mechanical, Thermal, and Radiation Measurement, nd ed.; Webster, J. G., Eren, H., Eds.; CRC Press, 2014. DOI: https://doi.org/10.1201/b15474.
- Koponen, A.; Eloranta, H.; Jäsberg, A.; Honkanen, M.; Kiiskinen, H. Real-Time Monitoring of Bubble Size Distribution in a Foam Forming Process. TJ. 2019, 18, 487–494. DOI: https://doi.org/10.32964/TJ18.8.487.
- Lappalainen, T.; Lehmonen, J. Determinations of Bubble Size Distribution of Foam-Fibre Mixture Using Circular Hough Transform. Nord. Pulp Pap. Res. J. 2012, 27, 930–939. DOI: https://doi.org/10.3183/npprj-2012-27-05-p930-939.
- Sick Ruler-E4111 Datasheet. https://www.sick.com/ag/en/machine-vision/3d-machine-vision/ruler/ruler-e4111/p/p165852.
- Romaniuk, O.; Kril, B.; Kril, O. Algorithmic Method for Precision Enhancement of Paper Pulp Blade Consistometer. Energy Eng. control Syst. 2016, 2, 25–31. DOI: https://doi.org/10.23939/jeecs2016.01.025.
- Metso Blade Consistency Transmitter—Metso SP. http://valveproducts.metso.com/documents/cct/products/Metso_SP/Manuals/Metso. SP owner manual.pdf.
- Al-Qararah, A. M.; Ekman, A.; Hjelt, T.; Kiiskinen, H.; Timonen, J.; Ketoja, J. A. Porous Structure of Fibre Networks Formed by a Foaming Process: A Comparative Study of Different Characterization Techniques. J. Microsc. 2016, 264, 88–101. DOI: https://doi.org/10.1111/jmi.12420.
- Paunonen, S.; Timofeev, O.; Torvinen, K.; Turpeinen, T.; Ketoja, J. A. Improving Compression Recovery of Foam-Formed Fiber Materials. BioResources 2018, 13, 4058–4074. DOI: https://doi.org/10.15376/biores.13.2.4058-4074.
- Ketoja, J. A.; Paunonen, S.; Jetsu, P.; Pääkkönen, E. Compression Strength Mechanisms of Low-Density Fibrous Materials. Materials (Basel) 2019, 12, 384. DOI: https://doi.org/10.3390/ma12030384.
- Burke, S. R.; Möbius, M. E.; Hjelt, T.; Hutzler, S. Properties of Lightweight Fibrous Structures Made by a Novel Foam Forming Technique. Cellulose 2019, 26, 2529–2539. DOI: https://doi.org/10.1007/s10570-018-2205-5.
- Malekzadeh, H.; Md Zaid, N. S. B.; Bele, E. Characterization and Structural Properties of Bamboo Fibre Solid Foams. Cellulose 2020, DOI: https://doi.org/10.1007/s10570-020-03565-0.
- Al-Qararah, A. M.; Hjelt, T.; Kinnunen, K.; Beletski, N.; Ketoja, J. A. Exceptional Pore Size Distribution in Foam-Formed Fibre Networks. Nord. Pulp Pap. Res. J. 2012, 27, 226–230. DOI: https://doi.org/10.3183/npprj-2012-27-02-p226-230.
- Burke, S. R.; Möbius, M. E.; Hjelt, T.; Ketoja, J. A.; Hutzler, S. Analysis of the Foam-Forming of Non-Woven Lightweight Fibrous Materials Using X-Ray Tomography. SN Appl. Sci 2021, 3, 192. DOI: https://doi.org/10.1007/s42452-021-04172-9.
- Koponen, A.; Ekman, A.; Mattila, K.; Al-Qararah, A. M.; Timonen, J. The Effect of Void Structure on the Permeability of Fibrous Networks. Transp. Porous Med. 2017, 117, 247–259. DOI: https://doi.org/10.1007/s11242-017-0831-2.
- Komori, T.; Makishima, K. Numbers of Fiber-to-Fiber Contacts in General Fiber Assemblies. Text. Res. J. 1977, 47, 13–17. DOI: https://doi.org/10.1177/004051757704700104.
- Langlois, V. J.; Hutzler, S. Dynamics of a Flexible Fibre in a Sheared Two-Dimensional Foam: Numerical Simulations. Colloids Surfaces a Physicochem. Eng. Asp. 2017, 534, 105–111. DOI: https://doi.org/10.1016/j.colsurfa.2017.02.089.
- Alava, M.; Niskanen, K. The Physics of Paper. Rep. Prog. Phys. 2006, 69, 669–723. DOI: https://doi.org/10.1088/0034-4885/69/3/R03.
- Sampson, W. W. Unified Theory for Structural Statistics of Flocculated and Random Fibre Networks. J. Pulp Pap. Sci. 2008, 34, 91–98.
- Picu, R. C. Mechanics of Random Fiber Networks—A Review. Soft Matter. 2011, 7, 6768–6785. DOI: https://doi.org/10.1039/c1sm05022b.
- Deogekar, S.; Picu, R. C. On the Strength of Random Fiber Networks. J. Mech. Phys. Solids 2018, 116, 1–16. DOI: https://doi.org/10.1016/j.jmps.2018.03.026.
- Kinnunen, K.; Lehmonen, J.; Beletski, N.; Jetsu, P.; Hjelt, T. Benefits of Foam Forming Technology and Its Application in High MFC Addition Structures. In Proceedings of the 15th Pulp and Paper Fundamental Research Symposium; 2013; pp 837–850. DOI: https://doi.org/10.15376/frc.2013.2.837.
- Li, J.; Yang, X.; Xiu, H.; Dong, H.; Song, T.; Ma, F.; Feng, P.; Zhang, X.; Kozliak, E.; Ji, Y. Structure and Performance Control of Plant Fiber Based Foam Material by Fibrillation via Refining Treatment. Ind. Crops Prod. 2019, 128, 186–193. DOI: https://doi.org/10.1016/j.indcrop.2018.10.085.
- Liu, Y.; Kong, S.; Xiao, H.; Bai, C. Y.; Lu, P.; Wang, S. F. Comparative Study of Ultra-Lightweight Pulp Foams Obtained from Various Fibers and Reinforced by MFC. Carbohydr. Polym. 2018, 182, 92–97. (June 2017). DOI: https://doi.org/10.1016/j.carbpol.2017.10.078.
- Subramanian, G.; Picu, C. R. Mechanics of Three-Dimensional, Nonbonded Random Fiber Networks. Phys. Rev. E Stat. Nonlin. Soft Matter. Phys. 2011, 83, 056120. DOI: https://doi.org/10.1103/PhysRevE.83.056120.
- Alimadadi, M.; Lindström, S. B.; Kulachenko, A. Role of Microstructures in the Compression Response of Three-Dimensional Foam-Formed Wood Fiber Networks. Soft Matter. 2018, 14, 8945–8955. DOI: https://doi.org/10.1039/c7sm02561k.
- Bergström, P.; Hossain, S.; Uesaka, T. Scaling Behaviour of Strength of 3D-, Semi-Flexible-, Cross-Linked Fibre Network. Int. J. Solids Struct. 2019, 166, 68–74. DOI: https://doi.org/10.1016/j.ijsolstr.2019.02.003.
- Mäkinen, T.; Koivisto, J.; Pääkkönen, E.; Ketoja, J. A.; Alava, M. J. Crossover from Mean-Field Compression to Collective Phenomena in Low-Density Foam-Formed Fiber Material. Soft Matter. 2020, 16, 6819–6825. DOI: https://doi.org/10.1039/d0sm00286k.
- Pöhler, T.; Jetsu, P.; Isomoisio, H. Benchmarking New Wood Fibre–Based Sound Absorbing Material Made with a Foam-Forming Technique. Build. Acoust 2016, 23, 131–143. DOI: https://doi.org/10.1177/1351010X16661564.
- Erkkilä, A.; Immonen, K.; Kinnunen, K.; Oksanen, A.; Tahvonen, R.; Särkkä, L.; Näkkilä, J.; Hjelt, T.; Jokinen, K. Growing Medium Structures Based on Sphagnum Moss and Method for the Manufacture Thereof. Patent WO15044526 A1, 2015.
- Ottenhall, A.; Seppänen, T.; Ek, M. Water-Stable Cellulose Fiber Foam with Antimicrobial Properties for Bio Based Low-Density Materials. Cellulose 2018, 25, 2599–2613. DOI: https://doi.org/10.1007/s10570-018-1738-y.
- Harlin, A.; Jetsu, P.; Heikkilä, P.; Kinnunen, K. 2013Foam Forming Technology for Tailored Medical and Hygienic Applications. In International Conference on Medical Textiles and Healthcare Products (MedTex13).
- Hellen, E.; Jetsu, P.; Lehmonen, J. Foam Forming: What Could It Mean for Tissue? Pap. Technol. 2013, 54, 10–12.
- Siljander, S.; Keinänen, P.; Ivanova, A.; Lehmonen, J.; Tuukkanen, S.; Kanerva, M.; Björkqvist, T. Conductive Cellulose Based Foam Formed 3D Shapes-from Innovation to Designed Prototype. Materials (Basel) 2019, 12, 430. DOI: https://doi.org/10.3390/ma12030430.
- Beatrice, C. A. G.; Rosa-Sibakov, N.; Lille, M.; Sözer, N.; Poutanen, K.; Ketoja, J. A. Structural Properties and Foaming of Plant Cell Wall Polysaccharide Dispersions. Carbohydr. Polym. 2017, 173, 508–518. DOI: https://doi.org/10.1016/j.carbpol.2017.06.028.
- Kurppa, K.; Paananen, A.; Szilvay, G.; Pulli, T.; Sandberg, H.; Soikkeli, M.; Ketoja, J.; Ruotsalainen, T. Production of Graphene Structures. Patent FI 128434 B, 2020.
- Gatward, A. P. J. Long-Fibre Developments in the UK and Europe. Paper Technol. 1973, 272–274.
- Hanson, J. P. What’s Going on in Non-Wovens. Pulp Pap. 1977, 51, 97–102.
- Lehmonen, J.; Pöhler, T.; Hjelt, T.; Kiiskinen, H.; Hellén, E.; Tanaka, A.; Ketoja, J. Foam Forming for Tissue and Nonwovens. In Paper Conference and Trade Show: PaperCon 2015 (Vol. 2); TAPPI Press, 2015; pp 1390–1400.
- Lindfors, J.; Hietaniemi, M.; Virtanen, M.; Torvinen, K.; Asikainen, J.; Salminen, K. 2017, Strength Solutions for Foam Formed Webs. In Paper Conference and Trade Show, PaperCon 2017; TAPPI: Minneapolis.
- Forsstrom, U.; Uotila, J.; Torvinen, K.; Kiiskinen, H. Challanges and Possibilities in Coating of Foam-Formed Structure. In International Paperworld IPW; International Paperworld IPW 2016, 2–3, 20–27.
- Koskela, H.; Laine, C.; Kenttä, E.; Oksanen, A.; Turpeinen, T.; Forsström, U. Influence of Pretreatments on Pigment Coating of Foam Formed Structures. Int. Pap. IPW 2019, 22–27. 11–12.
- Jain, S.; Bhanjana, G.; Heydarifard, S.; Dilbaghi, N.; Nazhad, M. M.; Kumar, V.; Kim, K. H.; Kumar, S. Enhanced Antibacterial Profile of Nanoparticle Impregnated Cellulose Foam Filter Paper for Drinking Water Filtration. Carbohydr. Polym. 2018, 202, 219–226. DOI: https://doi.org/10.1016/j.carbpol.2018.08.130.
- Zheng, C.; Li, D.; Ek, M. Cellulose-Fiber-Based Insulation Materials with Improved Reaction-to-Fire Properties. Nord. Pulp Pap. Res. J. 2017, 32, 466–472. DOI: https://doi.org/10.3183/npprj-2017-32-03-p466-472.
- Zheng, C.; Li, D.; Ek, M. Mechanism and Kinetics of Thermal Degradation of Insulating Materials Developed from Cellulose Fiber and Fire Retardants. J. Therm. Anal. Calorim. 2019, 135, 3015–3027. DOI: https://doi.org/10.1007/s10973-018-7564-5.
- Zheng, C.; Li, D.; Ek, M. Improving Fire Retardancy of Cellulosic Thermal Insulating Materials by Coating with Bio-Based Fire Retardants. Nord. Pulp Pap. Res. J. 2019, 34, 96–106. DOI: https://doi.org/10.1515/npprj-2018-0031.
- Zheng, C.; Li, D.; Ottenhall, A.; Ek, M. Cellulose Fiber Based Fungal and Water Resistant Insulation Materials. Holzforschung 2017, 71, 633–639. DOI: https://doi.org/10.1515/hf-2016-0162.
- Debeleac, C.; Nechita, P.; Nastac, S. Computational Investigations on Soundproof Applications of Foam-Formed Cellulose Materials. Polymers (Basel). 2019, 11, 1223. DOI: https://doi.org/10.3390/polym11071223.
- Dong, K.; Wang, X. Development of Cost Effective Ultra-Lightweight Cellulose-Based Sound Absorbing Material over Silica Sol/Natural Fiber Blended Substrate. Carbohydr. Polym. 2021, 255, 117369. DOI: https://doi.org/10.1016/j.carbpol.2020.117369.
- Immonen, K.; Jetsu, P.; Keränen, J.; Torvinen, K. Feasibility of Foam Forming Technology for Producing Wood Plastic Composites. J. Appl. Polym. Sci. 2020, 137, 49404. DOI: https://doi.org/10.1002/app.49404.