
 ?Mathematical formulae have been encoded as MathML and are displayed in this HTML version using MathJax in order to improve their display. Uncheck the box to turn MathJax off. This feature requires Javascript. Click on a formula to zoom.
Abstract
Naphthenic Acids (NAs) are widely believed to universally act in a stabilizing capacity during the formation of water-in-crude oil emulsions. This work provides evidence to the contrary wherein differences between commercially acquired NAs and those extracted from crude exhibit opposing effects on emulsion stability. Addition of the commercial NAs to a crude oil prior to water-in-oil emulsion formation resulted in an increase in emulsion destabilization rate. This was demonstrated via quantification of water droplet coalescence using pulsed field gradient nuclear magnetic resonance (NMR) and, over long timescales in the visual observation of the disengagement of a free water phase. The efficacy of the commercial NAs to act in such a demulsification capacity was shown to be effective at concentrations as low as 0.5v/v% and in the presence of saline water of up to 3.5 wt% NaCl. Differences in NA demulsifying ability was observed between three crude oils of various origins with some demonstrating clear visual phase separation whilst others remained in an emulsified state. Conversely, addition of NAs extracted from a crude oil at similar concentrations had negligible effect on the rate of emulsion destabilization. Comparative characterization of the commercial and indigenous NAs was performed using 1H NMR, Diffusion Ordered Spectroscopy (DOSY), Rheometry, Pendant Drop Tensiometry, and Gas Chromatography–Mass Spectrometry. The results of this characterization indicated that differences in emulsion stability were governed not by differences in the reduction of emulsion droplet interfacial tension (IFT) but by the kinetics of molecular diffusion of the NAs during both the emulsification and destabilization phases.
Graphical Abstract
1. INTRODUCTION
The extraction of crude oil from reservoirs is often accompanied by a substantial quantity of (often salty) water, particularly during the latter stages of field life. Shear forces experienced during transport through porous rock, up the well-bore and through valves and pumps can result in the formation of water-in-crude oil emulsions.[Citation1] These consist of micron-sized water droplets dispersed within a continuous oil phase.[Citation2] The formation of such an emulsion is undesirable as their viscosity is usually greater than either phase in isolation, resulting in an increase in transportation costs.[Citation3] Furthermore, the presence of saline water can corrode transport and processing equipment.[Citation3] Thus, separation of the two phases and removal of the water is desirable. Current industrial methods for such emulsion elimination include the addition of chemical demulsifiers,[Citation4] gravitational settling,[Citation5] or electro-demulsification.[Citation6] These techniques are limited, to variable extents, by significant time, monetary and energy expenses and, therefore, it is of interest to discover alternative demulsification methods which mitigate these deficiencies.
The formation of stable water-in-crude-oil emulsions is widely believed to be due to the adsorption of certain surface-active components present in the crude oil to the water droplet interface.[Citation7] Of all the crude oil constituents, asphaltenes are arguably regarded as the most influential with regards to emulsion stabilization.[Citation8] Asphaltenes are a solubility class of crude oil and are defined as the components which are insoluble in n-pentane or n-hexane but soluble in toluene.[Citation9] These are believed to adsorb to the droplet interface and form a viscoelastic film to provide a barrier to coalescence. Naphthenic acids (NAs) are also believed to impart stabilizing effects on water-in-crude oil emulsions.[Citation3] Significant variability is found in the molecular composition of crude oil extracted from different reservoirs. As such, crude oils contain significant variation in the compositional distribution of NAs, rendering predictions of the effect they have on the crude oil physicochemical properties challenging.
With regards to identification of components which act as emulsifiers, emphasis is often placed on molecules which decrease interfacial tension (IFT) and hence increase emulsion stability.[Citation3,Citation10,Citation11] Based on the interfacial activity of NAs and the detection of NA components as part of the ‘loosely-bound material’ to certain tight water-in-oil emulsions,[Citation12] such molecules have until this time been widely assumed to be inherently demulsifying. There does exist some limited evidence to suggest that certain NA’s may be capable of softening the rigidity of asphaltenic films and thus increase the coalescence of water droplets.[Citation13] However, this work was performed using model oil (heptol) and deionized water and did not track the stability of emulsions as a function of time. To the best of our knowledge, no previous work has attempted to elevate the concentration of NA within crude oil samples and elucidate the resultant effect on water-in-crude oil emulsions. The aim of this work is to show that in certain crude oils, differences in emulsion stability can be clearly observed dependent on the origin of NA added. In particular, the effect of a commercially acquired mixture compared to NA extracted from the oil itself on emulsion destabilization is assessed and the molecular characteristics underpinning these macroscopic observations are probed.
Although visual observation of phase separation is the test of the true efficacy of a demulsification technique, emulsion destabilization can potentially occur over long (weeks, months) periods of time. The opaque nature of crude oils can make it challenging to monitor the coalescence of microscopic droplets optically before the occurrence of gravitational settling. To mitigate this issue, the technique of nuclear magnetic resonance (NMR) was used to monitor the microstructural changes in emulsion water droplet size distributions (DSDs). NMR also affords other advantages over alternative methods of droplet sizing such as optical microscopy, confocal microscopy, laser scattering or ultrasonics[Citation14] as these techniques are limited in the presence of high water concentrations, gas bubbles or suspended solids. Contrarily, NMR emulsion droplet sizing is not adversely affected by any of these factors and is in fact enhanced by high water concentrations due to an increase in signal to noise ratio (SNR).
2. BACKGROUND
2.1. Crude Oil Emulsion Stability Theory
The current theories underpinning water-in-crude oil emulsion stability are heavily predicated on the influence of asphaltenes on the water droplet surface. As a solubility class, there is no one well-defined ‘asphaltene’ molecular structure. However, there exists an approximate set of molecular properties that are currently widely accepted. In general, asphaltenes are considered to be the highest molecular weight (≥750 Da)[Citation15] and most polar of the crude oil constituents. They contain heteroatoms (nitrogen, oxygen, and sulfur) at approximately 2–10 wt% and transition metals (vanadium, nickel, and iron) in parts per million to part per trillion quantities.[Citation3] The bulk structure of a ‘typical’ asphaltene molecule is thought to consist of aromatic groups with aliphatic side chains (resulting in a carbon/hydrogen ratio of ∼1–1.2). If present in elevated concentrations, these single molecules will assemble into nanoaggregates or clusters both of which have small (<10) aggregation numbers[Citation15] due to the formation of a variety of intermolecular bonds, namely hydrogen, π–π and Lewis acid–base interactions.[Citation3] Such interactions have been indirectly observed via the formation of a viscoelastic film around the emulsified water droplets, the rigidity of which has been determined to be indicative of emulsion stability.[Citation16] The film has been identified as increasing in rigidity with aging[Citation17] and provides a physical barrier to droplet coalescence and separation of a free water phase.
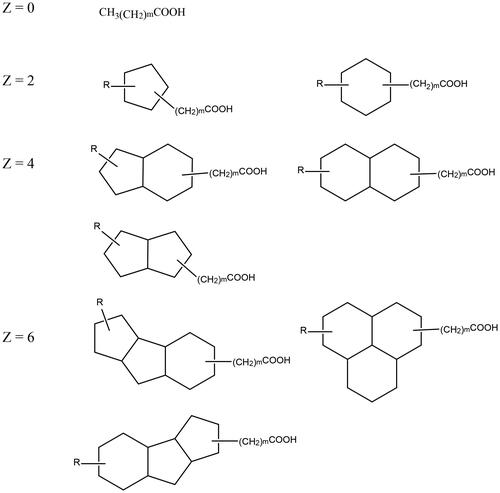
The significance of asphaltenes in emulsion stability is considered of principle importance as is evidenced by the comprehensive number of studies performed trying to elucidate their properties and mode of action. It is important not to emphasize the importance of asphaltenes at the expense of factoring in the effects of other crude oil components. In this sense, the role of NAs during emulsification has been identified but has not been analyzed to the extent of asphaltenes. NAs are also inherently surface active, with a hydrophobic aliphatic chain and at least one hydrophilic carboxylic acid head group. Moreover, their molecular structure is more similar to that of a traditional surfactant (with distinct hydrophilic and hydrophobic regions) than that of asphaltenes. NAs are broadly defined as a mixture of aliphatic carboxylic acids with at least one cyclic alkane functional group. Their general chemical formula is CnH2n+ZO2, where Z is a negative integer between 0 and −12, representing the degree of hydrogen deficiency due to cyclization.[Citation18] They are found in almost all crude oil deposits due to incomplete conversion of kerogens to hydrocarbons (via catagenesis) or bacterial biodegradation.[Citation19] The molecular weight of NAs is between 100 and 500 gmol−1 with some typical structures shown in .[Citation20] Currently, there are two predominant modes via which NA are hypothesized to contribute to emulsion stabilization.
Figure 1. Examples of naphthenic acid structures. R = alkyl group, m = number of CH2 units, and Z indicates the degree of cyclization.
The first is through the adsorption of the acids themselves to the water droplet interface. As a mixture of weak acids, NA interfacial activity and film stability is subject to the pH of the aqueous phase. In particular, elevated pH (>8) has a two-pronged effect in destabilizing water-in-oil emulsions as a result of the dissociation of the NAs into its constituent ions. First, adsorption of dissociated NAs at high pH results in the lowering of IFT to close to zero[Citation21] which implies that their adsorption is thermodynamically favorable–potentially over other species such as asphaltenes. Second, once adsorbed, the ionized species assemble into weaker interfacial films. This is due to the charged carboxylate head group which requires greater area per monomer due to electrostatic repulsion[Citation22] and possesses increased water solubility which creates films with increased compressibility. NA structures with increased water solubility have been identified as being able to form stable monolayers.[Citation23] The film strength of structures that did form stable films were shown to be enhanced by the presence of cations (Ca2+ and Na+) but the impact of these was lessened at low pH where NAs remain protonated and do not form metal naphthenates.
The second mode of NA stabilization is hypothesized to be due to the formation of the afore-mentioned naphthenate salts–in particular naphthenate soaps formed by tetra acids in the presence of alkaline earth metals such as calcium and magnesium. This subset of naphthenate soaps (referred to as ARN)[Citation24] poses a secondary problem to the oil industry in that their precipitation on processing facilities can result in the hindrance of asset production.[Citation25,Citation26] ARN acids consist of tetraprotic unsaturated cyclic acids with 4–6 cyclopentane rings.[Citation25,Citation27] The pressure drop associated with the production of crude oil causes CO2 evolution which increases the pH of the aqueous phase and results in the dissociation of acids which can interact with divalent ions present in the produced water.[Citation26] The stabilization of emulsions imparted by ARN is attributed to the presence of four carboxylate groups, which have been shown to have significantly increased interfacial activity relative to monoprotic acids.[Citation27]
As with asphaltenes, the elastic film formed by NAs and derivatives is attributed as being an emulsion stabilizing feature. Sodium naphthenates have been identified as forming a lamellar liquid crystal (LLC)[Citation28] which consist of alternating films of surfactant bilayers and solvent and result in a significant decrease in droplet coalescence.[Citation29] ARN acids and ARN calcium naphthenate salts also form a tertiary insoluble phase at a water-oil interface–thought to be held together via the cross linking of acids or acid–metal complexes.[Citation30] Calcium naphthenate films are more rigid relative to those formed by acid alone[Citation30], highlighting the importance of aqueous phase composition in the role of emulsions stability.
In summary, identification and quantification of the species which are responsible for the formation and stabilization of water-in-crude oil emulsions is challenging. Complexity is increased by the diverse origin of crude oil samples, with none having the exact same molecular composition. In general, water-in-oil emulsion stability is predicated on a) adsorption of surface-active species to the water droplet interface upon dispersion within the crude oil phase and b) the formation of a coalescence-inhibiting film around these droplets. These are formed by the surface active and film-forming components of the crude oil. In reality, it is most probable that these interact synergistically to promote (or impede) the formation of stable water-in-crude oil emulsions.
3. MATERIALS AND METHODS
3.1. Materials
Three crude oils were used in this study. These were obtained from the Northwest of Western Australia (Oil A), West Africa (Oil B), and the Gulf of Mexico (Oil C). These oils were initially prescreened for emulsion stability via bottle stability tests. At a water cut of 30 v/v%, Oil A emulsions remained stable over a 3-week-period whilst Oils B and C remain emulsified after months of visual observation. Since the presence of ions has been previously shown to significantly increase the stability of water-in-crude oil emulsions,[Citation31,Citation32] saline water emulsions were not generated for Oils B and C as they did not demonstrate appreciable separation of water only emulsions. A variety of physicochemical parameters were characterized, including the results of an extended SARA analysis (E-SARA)[Citation33,Citation34] which are presented in . A technical mixture of NAs (purchased from Sigma Aldrich St. Louis, MO, USA–catalog number = 70340, density = 0.92 gmL−1) was used and brine solutions were made using sodium chloride (purchased from Chem-Supply, Gillman, Australia) and Milli-Q Water.
Table 1. Selected properties of the Oils used in this work.
3.2 Emulsion Preparation
Water-in-oil emulsions were formed via the homogenization of a 30 v/v% aqueous phase (water or brine), NA (0–10 v/v% of the oil phase) and crude oil at 17,000 rpm for 120 seconds. Brine salt concentrations used in this work were 0.1 and 3.5 wt% NaCl. Immediately following emulsion formation, a sample (1 mL) from each emulsion was extracted for analysis in a 5 mm outer diameter NMR tube and the remainder monitored visually via bottle stability tests. The same extracted sample was analyzed in the NMR spectrometer throughout each experiment. The bottom 10 mm of each NMR tube was fully located within the spectrometer region of detection during these measurements.
3.3. NMR Theory
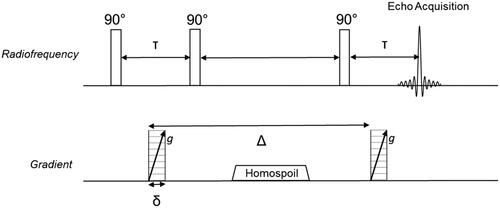
Monitoring of water droplet coalescence was achieved via determination of DSDs. These were obtained either over a 40-minute, 4-day or 6-day period post-emulsion formation; measurements were performed until significant phase separation was observed. Previous work[Citation32,Citation35–37] has extensively documented the underlying theory and credibility of NMR as a viable technique for determining DSDs. NMR analysis was performed using a benchtop 1 T Halbach array permanent magnet (Magritek, NZ) with a custom-built 5 mm inner diameter radiofrequency (rf) coil. This was tuned to the 1H NMR resonance of 43 MHz. A stimulated echo pulsed field gradient (PFG-STE) pulse sequence was applied (). In this work, the gradient (g) was varied between 0 and 1 T/m in 16 increments and δ and Δ were set constant to 4 and 200 ms respectively. All measurements were averaged over eight repetitions.
Figure 2. Stimulated echo (STE) pulse sequence with inclusion of magnetic field gradients to spatially encode the NMR frequency of each 1H. A homospoil gradient is required to prevent recombination of any remaining coherent transverse magnetization during signal acquisition.
Stejskal and Tanner[Citation38] first demonstrated that quantification of the unrestricted diffusion coefficient of liquid molecules could be achieved via monitoring of the NMR signal attenuation due to random molecular motion. The NMR signal loss due to this motion is described by:
(1)
(1)
where S is the observed signal intensity, S0 is the signal intensity when no gradient (g) is applied, D is the diffusion coefficient and δ and Δ are the length of time the pulse is applied for and the diffusion time respectively. The gyromagnetic ratio (γ) of 1H (2.68 × 10⁸ T−1s−1) was used for all NMR measurements in this study.
3.3.1. Signal Attenuation in Water Droplets
The Stejskal–Tanner equation is strictly only applicable to molecules undergoing unrestricted diffusion. To account for constraints imposed by the boundaries of assumed spherical water droplets with radius (a) the Block Gradient Pulse (BGP) method was used to interpret the NMR signal attenuation data observed from the PFG-STE pulse sequence. The BGP method involves solving the Bloch–Torrey equations using eigenfunction expansions;[Citation39] the interested reader is referred to reference[Citation40] for specific details concerning this method and its mathematical formulation which links the acquired NMR signal, S(a,g), to the emulsion droplet radius, a. Previous studies[Citation14,Citation32,Citation33,Citation35–37,Citation41,Citation42] have extensively utilized this approach as well. By acquiring NMR signal, S(a,g), as a function of gradient strength, g, rather than the gradient pulse duration, δ or observation time, Δ, the additional signal attenuation arising from surface (water-oil interface) relaxation can be eliminated as the δ and Δ were maintained at constant values. While alternative approaches employing PFG-Spin Echo (SE) with Carr–Purcell–Meiboom–Gill (CPMG) have been reported for estimating droplet size as discussed by Peña and Hirasaki [Citation43], the PFG-STE (with constant δ and Δ) in combination with BGP method is our preferred choice due to its consistent determination of emulsion droplet sizing, without the complexities associated with determining the empirical surface relaxivity value via CPMG.
Emulsions consist of a range of droplet sizes. Therefore the BGP method must be deployed whilst simultaneously accounting for signal attenuation due to the presence of a DSD.[Citation40] The normalized NMR signal can then be described by:
(2)
(2)
where P(a) is the DSD. For a given emulsion, the denominator is constant and can be neglected as a scaling factor. The numerator integral can then be Discretized to represent the experimental NMR data (which is acquired discretely) as follows:
(3)
(3)
where bi represents the intensity of the ith experimental data point, P(aj) the probability distribution of the jth quadrature interval and dj the interval spacing (weighting factor) of each given quadrature.
P(aj) can theoretically be extracted by the inversion of EquationEquation (3)(3)
(3) in matrix form. However, this is an ill-condition inversion problem and in order to determine a physically meaningful (non-oscillatory) solution, Tikhonov Regularization[Citation40] has to be employed to effect the extraction of P(a); this has also been validated in previous works.[Citation14,Citation37,Citation41,Citation42]
Despite the advantages afforded by this NMR-based emulsion droplet sizing technique, application of this approach for droplet sizing is limited by size constraints of the droplets detectable. In order for molecular diffusion to be sufficiently restricted by the emulsion droplet wall, the mean molecular diffusion length (lD) due to diffusion must be approximately equal to the droplet radius (a). Determination of this parameter, lD, is achieved via EquationEquation (4)(4)
(4) :
(4)
(4)
In order to probe longer diffusion lengths (larger droplets) for a given sample, Δ must be increased. However, extension of the observation time is limited by the spin-lattice relaxation constant (T1) of the fluid providing NMR signal. For all the droplet sizing referred to in this work, a Δ of 200 ms corresponds with an estimated maximum detectable emulsion droplet radius of 30 μm–signal from droplet sizes larger than this will not be readily distinguished from that of the equivalent free phase.
3.4. Bottle Stability Theory
In conjunction with NMR droplet sizing, the observation of a macroscopic free water phase was visually and independently monitored to assess demulsification efficacy, based on the standard bottle stability method. This was achieved via transfer of liquids (∼15 mL) into 25 mL graduated measuring cylinders for visual observation of evolving phase volumes (i.e. appearance of a distinct water phase). Samples were stored at atmospheric conditions and photographs taken to track phase separation.
3.5. Naphthenic Acid Extraction Procedure
Acid removal was achieved using an adsorption process developed by others[Citation44,Citation45] wherein acidic components are adsorbed onto a sorbent facilitated by ion-exchange interactions between a carboxylate head group and a cationic sorbent. The sorbent Supelclean LC-SAX (40 g) was activated for the adsorption of acidic components using 0.1 M NaHCO3/0.1 Na2CO3 (500 mL) followed by rinsing with H2O (600 mL), methanol (300 mL), and CH2Cl2 (1 L). Prior to adsorption, crude oil (50 mL) was diluted with CH2Cl2 (500 mL). After adsorption, the treated crude oil was stirred in an open beaker under a fume hood (48 hours, 25 °C) to allow evaporation of CH2Cl2. To ensure removal of residual solvent (b.p. 40 °C), the sample was then heated to ∼50 °C for 10 minutes. The absence of CH2Cl2 was confirmed gravimetrically.
3.6. Naphthenic Acid Characterization Comparison
A summary of techniques used to characterize differences in NA molecular and emulsion stabilizing properties is shown in . These methods are fully detailed in the Supporting Information.
Table 2. Summary of characterization methods used in this work.
4. RESULTS AND DISCUSSION
4.1. Oil A: Commercial NA and Saline Water (0.1 wt%)
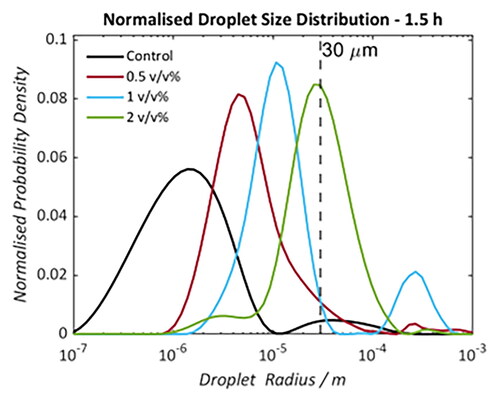
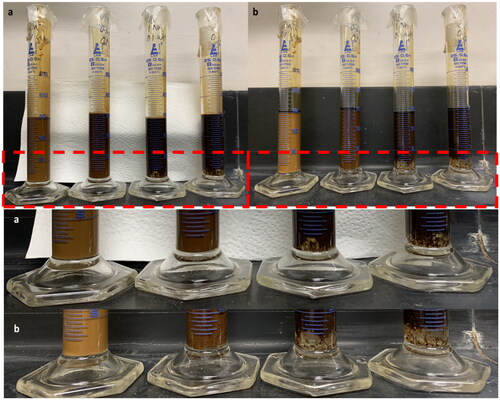
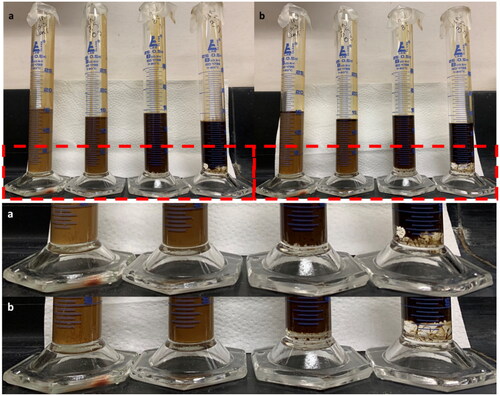
shows the DSDs of each water-in-oil emulsion formed using Oil A at four time points over a 92 hours period. In all DSDs, samples with elevated commercial NA concentrations exhibit larger droplet radii relative to the Control. summarizes the mean radii of each distribution which accounts for the volume-based contribution of water in the system below the 30 μm limit. The position of mean radii does not change significantly with time for the Control or 0.5 v/v% NA sample. Samples doped with 1 and 2 v/v% NA do indicate droplet coalescence as a function of time. This is evident from the relative proportions of apparent free water and emulsified water () with the boundary for this classification being the upper detectable droplet radius. These boundaries are indicated by the brown and blue background in each DSD. The population fraction of emulsified droplet volume below this 30 μm limit decreases by 46% (1 v/v %) and 19% (2 v/v %) over the 92 hour time period whilst for the Control and 0.5 v/v% samples all of the water remains in an obviously emulsified state. Importantly, the results detected using NMR were visually validated by bottle stability tests () where a small volume of free water can be observed in the 2 and 1 v/v% added NA samples after one day () with significant phase separation visible 1 week () post-emulsion formation.
Figure 3. Droplet size distributions of saline (0.1 wt% NaCl) water-in-crude oil emulsions (formed using Oil A). Samples doped with 0 (black), 0.5 (red), 1 (blue), and 2 (green) v/v% naphthenic acid. Measurements were taken at 1.5 (a), 25.5 (b), 46 (c), and 92 (d) hours post-emulsification. Dotted lines at 30 μm indicate the estimated maximum radius detectable by the NMR PFG-STE method.
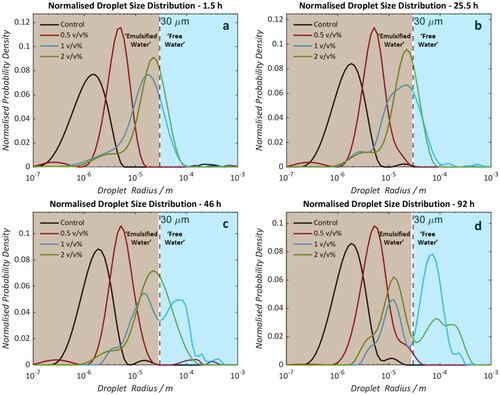
Figure 4. Summary of Results obtained from DSD’s of saline (0.1 wt% NaCl) water-in-crude oil emulsions (formed using Oil A). (a) Distribution mean. (b) Percentage of water signal which remains in an obviously emulsified state (at a radius of <30 μm). Increasing mean radii and a decrease in emulsified intensity for samples doped with 1(blue) and 2 (green) v/v% NA indicates increased droplet coalescence.
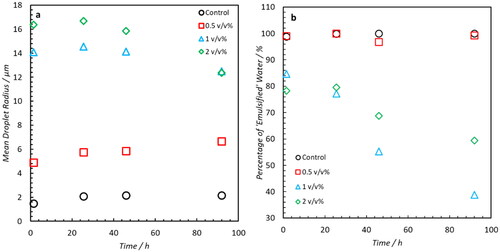
Figure 5. Bottle stability tests of saline (0.1 wt%) water-in crude oil (using Oil A) emulsions. Samples (L-R) Control, 0.5 v/v%, 1 v/v%, 2 v/v% NA. Images taken 24 hours (a) and 1 week (b) post emulsification. Samples doped with 1 and 2 v/v% NA have resulted in the separation of free water which is visible at the bottom of the measuring cylinders (highlighted by the red box). This area has also been enlarged for clarity.
4.2. Oil A: Commercial NA and Saline Water (3.5 wt%)
shows that the demulsifying efficacy of NA is replicable using a 3.5 wt% saline solution as the dispersed phase. The DSDs obtained 1.5 hours post emulsification show a clear a correlation between NA concentration and droplet radius. This is presumably due to the competitive adsorption of the added NAs and the intrinsic emulsifiers within the crude oil. Increasing concentrations of NAs may result in increased disruption of the viscoelastic film on the droplet surface causing emulsion destabilization. As with the 0.1 wt% saline solution, summarizes the evolution of the distribution means and the percentage of ‘emulsified’ water. Relative to the Control (which shows no significant change in emulsion DSD over 92 hours) samples doped with NA demonstrate a clear shift in population distributions to larger radii. The rate of coalescence and free water disengagement increases monotonically with increasingly NA content. Again, bottle stability tests corroborate the NMR-derived results (), wherein formation of a free water phase can be seen in samples doped with 1 and 2 v/v% after only 1 day (). Significant water clarification can be seen after 7 days () from these samples whilst the Control and 0.5 v/v% remain emulsified. The results clearly indicate that the presence of elevated concentrations of NA aid in the destabilization of water-in-crude oil emulsions.
Figure 6. A). Saline (3.5 wt %) crude oil A emulsion samples doped with 0 (black), 0.5 (red), 1 (blue), and 2 (green) v/v% Naphthenic Acid. Measurements were taken at 1.5 (a), 25.5 (b), 46 (c), and 92 (d) hours post-emulsification. Dotted line at 30 μm indicates the maximum radius detectable by this method.
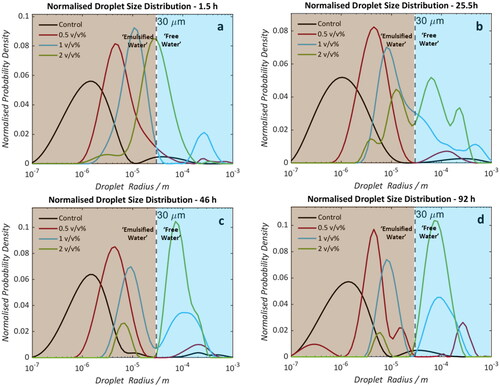
Figure. 7. Summary of Results obtained from DSD’s of saline (3.5 wt% NaCl) water-in-crude oil emulsions (Oil A). (a) Distribution mean. (b) Percentage of water signal which remains in an obviously emulsified state (at a radius of <30 μm). The degree of droplet coalescence observed trends with NA concentration.
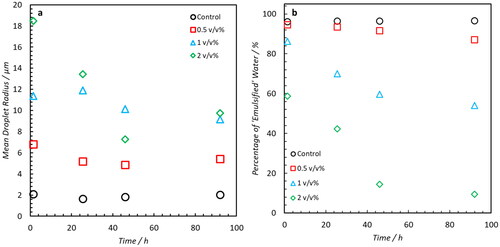
Figure 8. Bottle stability tests of saline (3.5 wt%) water-in crude oil emulsions. Samples (L-R) Control, 0.5 v/v%, 1 v/v%, 2 v/v% NA. Images taken 24 hours (a) and 1 week (b) post emulsification. Samples doped with 1 and 2 v/v% NA have resulted in the separation of free water during this time period as can be seen at the bottom of the measuring cylinders.
Importantly for general oilfield applicability, the effect of NAs was reproducible in saline water samples of 0.1 and 3.5 wt%. Addition of salt has been previously demonstrated to result in an increase in water-in-oil emulsion stability.[Citation46] This stabilization has been attributed to the ability of salts to inhibit water droplets from coalescence and sedimentation. Rocha et al.[Citation47] found that emulsions generated from a brine with a NaCl concentration of as low as 0.1 wt% demonstrated increased stability relative to those without salt. Ling et al.[Citation32] observed that the long term (5 days) stability of emulsions increased with salinity and was independent of the valency of salts (Mg2+ or Na+) used. The exact mechanism behind the stabilization imparted by ionic salts has not been fully rationalized in the literature. However, a reduction in oil-water IFT has been observed to occur as a function of salinity,[Citation47,Citation48] leading to speculation that increased surfactant surface concentration results in increased emulsion stability. Other hypotheses include observations of reduction in initial droplet size,[Citation49] reduction in the droplet–droplet attraction due to a decreased dielectric permittivity difference between the phases and increased phase density differences due to the presence of salts.[Citation32]
4.3. Oil B and C: Deionized Water
The DSD’s of emulsions formed with Oil B and C doped with 0 to 2 v/v% NA are shown in the Supporting Information (Figures S1 and S2, respectively). None of these samples exhibited the presence of droplets greater than 30 μm but a summary of the mean radii as a function of time post emulsion formation is shown in . At the end of the sampling period, Oil B samples doped with 1 and 2 v/v% NA exhibited the presence of larger droplets relative to the Control. However, this evidence is limited. For Oil C, the trend is even weaker and any change in mean radius is possibly due to artifacts of the regularization process used to fit the data. In an attempt to prove the ability of NA addition to induce free water clarification across the range of oils, a secondary study involving Oil B and C was performed. In this work, the concentration of NA was elevated up to 10 v/v% and measurements taken over an initial 40-minute period to assess whether the effect of NA addition could be quantified immediately post-emulsification. The DSD’s are shown in the Supporting Information–Figures S3 and S4 and a summary of mean radii is shown in . For Oil B, increased NA concentration trends with a clear increase in droplet coalescence–as evident from the increase in mean radius. However, increases as a function of time are limited. This implies that any destabilizing effects on Oil B occur predominately during the initial formation of emulsions and that any resultant weakening of the interfacial film with aging is minimal. Despite the observed increase in droplet size with increasing NA concentration, no water phase was visually observed from bottle stability tests (after 2 weeks of monitoring).
Figure 9. Mean droplet radius of DSD’s shown in Supporting Information Figures S1 and S2. The presence of 1 (blue) and 2 v/v% (green) NA results in the formation of larger droplets for Oil B–these do not significantly increase over the 6-day period. The same trend is not observable in Oil C until 72-hour post-emulsification.
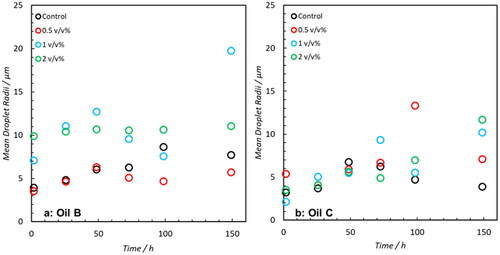
Figure 10. Mean of emulsion DSDs shown Supporting Information Figures S3 and S4. For Oil B, an increase in droplet radius is correlated with concentration of NA concentration. For Oil C, this trend is less evident with maximum variations in mean radii of 5.5 μm. However, the DSDs in Figure S4 show that samples doped with 10 v/v% generate distributions which are slightly shifted to larger radii than the Control and 2 v/v%.
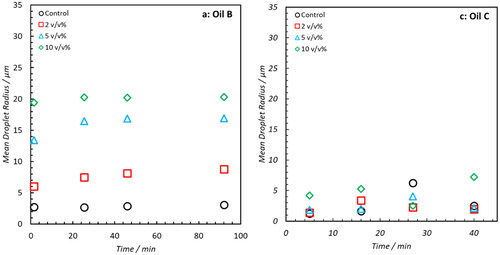
The demulsifying efficacy of NAs is much less apparent in Oil C, whose DSD’s display very minor differences between samples. After the 40-minute time period, differences between samples doped with 0 (Control) and variable amounts of NA are negligible. The reasons underpinning the difference between the emulsion stability of oils B and C cannot be fully determined from this work. However, as is evident from , significant compositional differences exist between the two. Oil C has approximately 7.5 times the mass of asphaltenic material present which is likely to influence emulsion stability. Furthermore, the stabilizing capacity of NA emulsion films in model oil systems has been shown to exhibit solvent dependence.[Citation50]
4.4. Oil A: Indigenous NA and Deionized Water
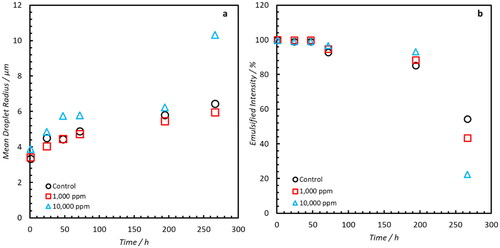
Emulsions were generated using the NAs extracted from Oil A at the same concentrations as those used for the commercial NAs. summarizes the mean droplet radii and emulsified water intensity over an 11-day period. All samples indicate a similar rate of droplet coalescence and only exceed the 30 μm limit of detection at the final time point. At 260 hours, the sample with the greatest concentration (1 v/v%) has the largest mean droplet radius and the least ‘emulsified’ water intensity which is indicative of an increased rate of emulsion destabilization. However, these results do not vary significantly from the control sample and the bottle stability results (Supplementary Information–Figure S5) do not exhibit the noticeable clarification of a free water phase that was observed from the commercial NAs with almost no water volume visible at the bottom of all the measuring cylinders even after 10 days.
Figure 11. (a) Mean Droplet radii of samples with elevated concentrations of indigenous NAs. Minimal differences between samples are observed until after 10 days. (b) Analogous emulsified intensity of water within samples. Significant decreases of emulsified water molecules are only observable at the final time point.
4.5. Relative Effect of Commercial and Indigenous NAs
To assess the effects of NAs already present relative to the addition of commercial NAs, a series of emulsions were made using various combinations of crude oil A and crude oil A with NA removed. A summary of the composition of the oil phase used in each emulsion is shown in .
Table 3. Summary of oil and NA oil phase combinations.
It is assumed that the effects of removing components have negligible effect on the viscosity of the continuous phase; all solvents were evaporated prior to emulsification. The DSDs produced were all multi-modal. As such, encapsulation of the data is best achieved using a summary of the emulsion fraction (). Whilst the emulsified signal intensity of the control (black circles) remains relatively constant over the experimental window, removing indigenous NA and/or adding commercial NA result in a decrease in the emulsified signal intensity. Monitoring the emulsion stability of each sample as a function of time facilitates a qualitative ‘ranking’ as to the most effective method of emulsion destabilization.
Figure 12. Percentage of signal intensity which is less than 30 μm for samples described in indicates emulsion destabilizing and stabilizing effects for commercial and indigenous samples, respectively.
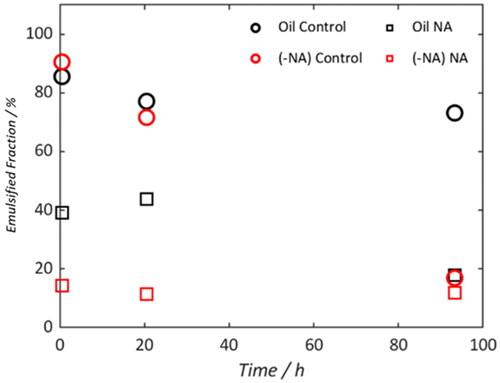
These results indicate that the most efficient method of destabilization is to both add commercial NA and remove the indigenous NA. The second most efficient mode of destabilization is through addition of commercial NA to pure oil A followed by solely removal of the indigenous. These results suggest that the indigenous NAs are acting in a stabilizing capacity whilst commercial NAs cause destabilization. This is potentially due to competitive adsorption at the droplet interface. However, the destabilization of the commercial NAs occurs at a faster rate than the stabilization of the indigenous NAs and act in such a way to eventually counter any stabilizing effects observed in a pure crude oil sample.
To determine an understanding of the molecular mechanism underpinning this behavior, a comparative study of the physicochemical properties of each NA was performed. This analysis focused on properties commonly associated with emulsion stability.
4.6. NA Characterization Comparison
4.6.1. Pendant Drop Tensiometry
The role of IFT is highly influential with regards to emulsion stability. During droplet formation, droplet size is inversely related with surface free energy which is a thermodynamic driving force for droplet coalescence.[Citation51] A reduction in surface free energy can be achieved via adsorption of surface active emulsifiers which reduce the IFT of droplets and promote emulsion stability. displays the IFT of samples as a function of NA concentration as determined by pendant drop tensiometry. The maximum concentration was chosen to mimic that of the samples used in the emulsion formation in the sections above. The reduction in IFT is similar for both types of NA which suggests that the thermodynamic driving force for interfacial adsorption is equivalent between samples. This highlights the potential for competitive adsorption which may have been adsorbed during the addition of commercial NA to oil with and without indigenous NAs (Section 4.5).
4.6.2. Rheometry
The viscosity of the continuous phase is an important factor in governing emulsion stability[Citation52]. Increasingly viscous solutions inhibit diffusion of droplets and their subsequent collisions, which are required for coalescence. To determine whether the addition of NA affects the viscosity of the continuous phase, a pure crude oil and crude oil with added commercial or indigenous samples to the same concentrations used in the emulsion samples described above (2 v/v%) were analyzed. All samples display pseudoplastic or shear-thinning behavior wherein increased shear rates result in lower apparent viscosity which is not uncommon for heavy crude oil.[Citation53,Citation54] Furthermore, all samples exhibited the existence of a small yield stress.[Citation55] The ramifications of this are that a comparison between the different fluids is difficult to perform. In order to facilitate a comparison between the three fluids, the viscosities at low-shear rates were calculated wherein the definition of this region is defined as the range of shear rates over which the fluid exhibited Newtonian behavior.[Citation55,Citation56] Viscosity was then determined through the linear correlation:
(5)
(5)
where τ is the shear stress,
the shear rate, and
the viscosity. In this work, this ‘low-shear region’ was arbitrarily defined by the data range over which fitting of EquationEquation (5)
(5)
(5) to all data sets gave an R2 value of 0.99. For all fluids and repeat measurements this corresponded with a zero-shear range of 10–350 s−1 and the viscosities obtained over these ranges are those which are summarized in . Crude oil adulterated with 20,000 ppm of the indigenous NA resulted in a 10% increase in viscosity over the shear rate range measures. Conversely, the average viscosity of a sample with 20,000 ppm of commercial NA resulted in a small (2%) decrease in sample viscosity suggesting it has negligible effect on the viscosity of the continuous phase.
Figure 13. (a) Interfacial tension of crude oil A with elevated concentrations of each NA. (b) Newtonian fluid fit viscosity values for each sample ± 95% confidence intervals.
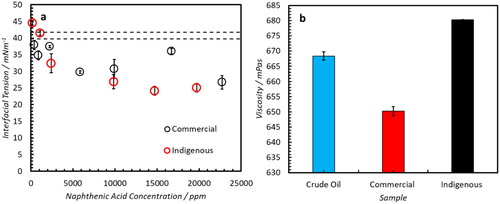
In general, an increase in viscosity results in an increase in emulsion stability[Citation57] due to retarding the movement of droplets and reducing the rate of collisions . However, the relationship is variable and orders of magnitude increases in viscosity are typically required for a significant increase in stability to be observed. Thus, the 62% increase in continuous phase viscosity caused by the addition of excess indigenous NAs is unlikely to significantly hinder droplet recombination. However, continuous phase viscosity is also correlated with the diffusion of individual molecules within the continuous phase–in particular those which are involved with stabilization of the interface. Molecular simulations have shown that reduced rates of NA molecular diffusion result in increased emulsion stability due to inability to diffuse away from the interface during the formation of a water bridge in the initial stages of coalescence.[Citation50] Therefore, the increase in viscosity observed here for the oil containing extra indigenous NAs may result in an increase in emulsion stability due to a reduction in the diffusion coefficients during the droplet collision phase of destabilization–which would negate any initial reduction in IFT that may have occurred in the adsorption of indigenous NAs. To assess the impact of relative molecular diffusivity, Diffusion Ordered Spectroscopy (DOSY) was performed.
4.6.3. Diffusion Ordered Spectroscopy (DOSY)
1H DOSY can be used to determine average diffusion coefficients of each proton environment. Within emulsions, the kinetics governing a reduction in IFT of a droplet have been rationalized as being diffusion-dominated.[Citation58,Citation59] Therefore, determination of relative diffusion coefficients may provide insight as to the competitive adsorption rate of each NA species and its resultant effect on emulsion stability.
Diffusion coefficients were determined via fitting of a mono-exponential decay curve, which exhibited good fitting for most of the data sets and suggests each distinct NMR peak is representative of a single 1H environment. The position of any water impurities–identified by their chemical shift and high diffusion coefficient–are indicated and other solvent peaks were removed. The average diffusion coefficient for each detectable peak is shown in , along with a 95% confidence interval error boundary. Both samples indicate the presence of predominantly hydrocarbon aliphatic molecules. Clear delineation of the diffusion coefficients of the aliphatic region of each sample () can be detected. Many of the different 1H environments within each species have the same calculated diffusion coefficient which implies that they are likely part of the same molecule. The results indicate than there is more hydrogen environment diversity within the commercial sample–as indicated by an increased number of resolvable peaks at unique chemical shifts. On average, within the aliphatic region (0–3 ppm), the diffusion coefficients of the commercially acquired sample are 19.5% and 20% larger than those of the indigenous acids within CDCl3 and d6-benzene respectively.
Figure 14. DOSY Spectra of commercial (black) and indigenous (red) samples in (a), (b) CDCl3 and (c), (d) d6-benzene. Figure (b) and (d) emphasize the aliphatic region (0–3 ppm).
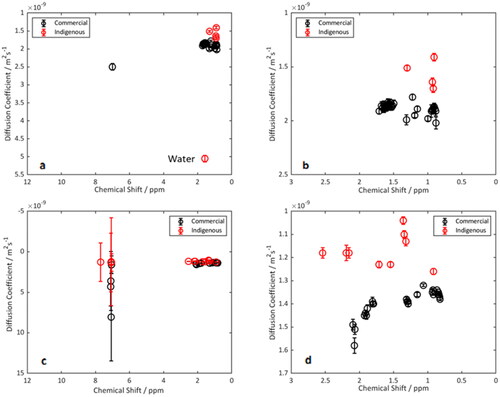
The difference in diffusion coefficients provides a twofold argument for rationalizing the relative differences in demulsification efficacy. These differences may influence the system in both the immediate period after emulsion formation and during the coalescence of droplets which promotes phase separation and destabilization. First, during the initial stages of emulsion settling and equilibration–immediately after the cessation of mixing–the slower diffusing indigenous NAs adsorb at the droplet interface at a slower rate than the commercial ones. The rate of adsorption at the interface hence affects the relative ability of each species to interact with other surface-active material (e.g. asphaltenes) and influence the mechanical properties of the interfacial film. The rapid adsorption of the commercial NAs is evident even from Oil B (which did not fully destabilize) but did form larger droplets with increasing NA concentration. This was evident from the initial droplet sizing (10 min after formation) and indicated the importance of the kinetics of adsorption on emulsion stability. Second, during droplet coalescence, NA diffusion coefficients have been modeled to be inversely correlated with emulsion film stability.[Citation50,Citation60] NAs with larger diffusion coefficients were suggested to depart from the droplet surface at higher rates, thus promoting droplet coalescence.
It must be noted that these measurements were performed in pure deuterated solvents, thus the interactions of each sample with other molecules in the crude oil (such as asphaltenes) is not captured in this data. These interactions may affect the diffusion coefficient of the NAs in the emulsion sample.
4.6.4. Gas Chromatography–Mass Spectrometry (GC-MS)
NA samples were derivatized according to a standard method to increase the volatility and stability of samples. The chromatograms obtained for each sample are shown in the Supporting Information–Figure S6. The structural diversity of the commercially acquired NA sample is evident through the range of retention times which exhibited detectable peaks. Matching of peaks to a library of compounds indicated the presence of a range of cyclic and linear alkane chains attached to a carboxylic acid group. The only resolvable peaks of the indigenous sample were those corresponding to self-derivatization of the MTBSTFA. The mass/charge range of compounds detectable was 45–550 gmol−1. The absence of peaks in the indigenous sample with this method suggests that the molecules present either contain lower mass to charge ratios or larger and failed to volatilize under experimental conditions. The physical properties of the indigenous sample, a black viscous solid, coupled with its increased diffusion coefficient indicate the latter as being likely. These results thus corroborate results from DOSY analysis which indicate the indigenous sample to contain larger molecular species. Typically, larger molecules have smaller diffusion coefficients which have reduced mobility during interfacial adsorption and desorption.[Citation61]
4.6.5 1H Nuclear Magnetic Resonance (1H NMR)
High field 1H NMR can be used to determine average structural parameters of crude oil and its sub-fractions.[Citation62] Integration was performed on the regions outlined in [63] to determine the relative signal contributions to each region. Hγ refers to paraffinic CH3 type hydrogens, γ position and greater to an aromatic system. Hβ refers to a naphthenic hydrogen, CH2, β to an aromatic system and Hα refers to CH, CH2 and CH3 groups linked to aromatics in the alpha position. HAr and HAcid refer to aromatic and acidic environments, respectively. Samples were analyzed in different solvents for increased accuracy and to account for detection of solvent and impurity peaks. The presence of a water peak in the indigenous sample occurs at 0.4 and 1.56 ppm in the d6-benzene and CDCl3, respectively, and was excluded from the integration region. The residual solvent peaks occur at 7.26 and 7.16 ppm, respectively.
Table 4. Relative integrals (%) of 1H NMR spectra (500 MHz).
The results shown in indicate that both samples contain negligible aromatic content. The structural diversity of compounds present is observable in the variety of hydrogen species observed. These results are in agreement with multiple other characterization studies performed on NA extracts.[Citation63,Citation64] The predominantly alkyl nature of both samples is evidenced by the relative contribution of Hα, Hβ, and Hγ. Previous studies have determined that increasing chain length is associated with an increase in the relative abundance of Hβ and a decrease of both Hα and Hγ[Citation63]. Based on this, the indigenous sample exhibits the presence of longer chained molecules on average. The absence of acidic protons should not be considered indicative of an absence of carboxylic acid groups, due to rapid proton exchange occurring faster than the timescale of spectra acquisition. If the acidic end groups are not present at appreciable levels, then it is possible that signal intensity will not be detected. This has been observed previously for samples with long (C20) chain length.[Citation63]
shows that the indigenous sample has a longer average chain length and a lower relative percentage of aromatic and carboxylic acid units. This suggests that the indigenous molecules have lower polarity which may result in decreased affinity for an oil-water interface as it has been shown that tendency for adsorption decreases with increasing chain length.[Citation65] These results also substantiate the hypothesis that the differences in emulsion stability are governed by the relative kinetics of adsorption and desorption from the droplet interface. Emulsion film stability was simulated to not only be dependent on NA molecular mass but also on aliphatic chain length. Longer chains were correlated with decreased molecular mobility during diffusion away from the interface and the formation of an increasingly compact structure which prevent droplet coalescence.[Citation50]
4.7 Results Comparison
The demulsification efficacy dependence on oil composition is clearly evident from the differing effects that the commercial NAs had on emulsion stability. Furthermore, the ability of NAs to act as either emulsion stabilizing or have negligible stabilization effects was shown to be highly dependent on the molecular characteristics of the species. This was made evident through a comparison of commercial NAs and those manually extracted from a crude oil. Predominant differences in physicochemical characteristics were observed in the molecular mass distributions, diffusion coefficients, molecular structure, and in the effects of their elevated concentration on oil viscosity. These indicated the indigenous sample to, on average, contain larger molecules with longer aliphatic chains and smaller diffusion coefficients. They also suggested that elevated concentrations of the indigenous sample resulted in an increase in continuous phase viscosity whilst similar concentrations of the commercial NA resulted in a minor decrease.
These molecular parameters indicate that differences in emulsion stability are dominated by the kinetics of adsorption and desorption to the droplet interface and not driven by differences in the thermodynamics of interfacial adsorption. The indigenous NAs are hypothesized to diffuse to the interface at slower rates, form stronger interfacial structures with reduced mobility due to their long aliphatic side chains and diffuse away from the interface more slowly during droplet collisions, thus forming more stable emulsions than their commercial equivalents. These results are significant as they justify hypotheses made based on simulations[Citation50] whilst rationalizing why a component of the oil most commonly associated with emulsion stability (NA), can sometimes cause destabilization despite resulting in a similar decrease in IFT of the system. It is therefore of importance not to unequivocally categorize NAs as being a factor contributing to emulsion stability without first performing system-specific analysis to confirm this.
5. CONCLUSION
Addition of NAs mixtures to crude oil was observed to destabilize or have negligible effects on emulsion stability depending on whether the NAs were sourced from a commercial mixture or from the crude oil itself. The destabilization effect was identified to be significantly variable across three oils of varying origin as might be expected from the significant variability in chemical composition. In all instances, elevated commercial NA concentrations resulted in an increase in droplet radius (monitored using NMR PFG-STE) indicating the occurrence of water droplet coalescence during the early stages of emulsion destabilization. For one oil, this phenomenon was accompanied by the disengagement of a free water phase which could be observed visually. For this same oil, free water clarification was reproducible in the presence of saline water with NaCl concentrations up to 3.5 wt%. This latter effect is encouraging with regards to field application as saline water-in-oil emulsions are generally stable relative to those without salts. Conversely, elevation of indigenous acid concentration had minimal effect on emulsion stability. A comparison of the molecular characteristics of the commercial and indigenous NAs was performed to ascertain the mechanism behind the differences in stabilization observed dependent on NA origin. Analysis was performed using 1H NMR, GC-MS, pendant drop tensiometry, rheology and DOSY. These indicated both sets of NAs to consist of primarily aliphatic alkane species. The commercial NA exhibited the presence of smaller molecules with shorter aliphatic chains and increased diffusion coefficients which did not increase the viscosity of the oil phase, suggesting that this is not the predominant driving force for demulsification. Differences between the reduction in IFT imparted by both NA species were also negligible. Therefore, the resultant theory for the differences in emulsion stability is hypothesized to be due to the increased rates of diffusion both to the interface during emulsification and away from the interface during droplet coalescence. This work is influential in emphasizing that not all NA are inherently emulsifying as could be misconstrued from reading the current literature.[Citation12,Citation13,Citation66–69] It is important to avoid categorizing NAs as a contributing factor in emulsion stability without conducting a system-specific analysis to confirm it.
Supplemental Material
Download MS Word (5.4 MB)Disclosure statement
The authors report there are no competing interests to declare.
Additional information
Funding
References
- Abdel-Aal, H. K. Petroleum and Gas Field Processing; CRC Press: New York, NY, 2003.
- Lissant, K. J. Emulsification and Demulsification—an Historical Overview. Colloid. Surf. 1988, 29, 1–5. DOI: 10.1016/0166-6622(88)80168-9.
- Kilpatrick, P. K. Water-in-Crude Oil Emulsion Stabilization: Review and Unanswered Questions. Energy & Fuels 2012, 26, 4017–4026. DOI: 10.1021/ef3003262.
- Raya, S. A.; Mohd Saaid, I.; Abbas Ahmed, A.; Abubakar Umar, A. A Critical Review of Development and Demulsification Mechanisms of Crude Oil Emulsion in the Petroleum Industry. J. Pet. Explor. Prod. Technol. 2020, 10, 1711–1728. DOI: 10.1007/s13202-020-00830-7.
- Zolfaghari, R.; Fakhru’l-Razi, A.; Abdullah, L. C.; Elnashaie, S. S. E. H.; Pendashteh, A. Demulsification Techniques of Water-in-Oil and Oil-in-Water Emulsions in Petroleum Industry. Sep. Purif. Technol. 2016, 170, 377–407. DOI: 10.1016/j.seppur.2016.06.026.
- Eow, J. S.; Ghadiri, M. Electrostatic Enhancement of Coalescence of Water Droplets in Oil: A Review of the Technology. Chem. Eng. J. 2002, 85, 357–368. DOI: 10.1016/S1385-8947(01)00250-9.
- Sullivan, A. P.; Zaki, N. N.; Sjöblom, J.; Kilpatrick, P. K. The Stability of Water-in-Crude and Model Oil Emulsions. Can. J. Chem. Eng. 2008, 85, 793–807. DOI: 10.1002/cjce.5450850601.
- McLean, J. D.; Kilpatrick, P. K. Effects of Asphaltene Solvency on Stability of Water-in-Crude-Oil Emulsions. J. Colloid Interface Sci. 1997, 189, 242–253. DOI: 10.1006/jcis.1997.4807.
- Alshareef, A. H. Asphaltenes: Definition, Properties, and Reactions of Model Compounds. Energy Fuels 2020, 34, 16–30. DOI: 10.1021/acs.energyfuels.9b03291.
- Sjöblom, J.; Aske, N.; Auflem, I.; Brandal, Ø.; Havre, T.; Sæther, Ø.; Westvik, A.; Johnsen, E. E.; Kallevik, H. Our Current Understanding of Water-in-Crude Oil Emulsions. - Recent Characterization Techniques and High Pressure Performance. Adv. Colloid Interface Sci. 2003, 100–102, 399–473. DOI: 10.1016/S0001-8686(02)00066-0.
- Ghannam, M. T. Water-in-Crude Oil Emulsion Stability Investigation. Pet. Sci. Technol. 2005, 23, 649–667. DOI: 10.1081/LFT-200033001.
- Muller, H.; Pauchard, V. O.; Hajji, A. A. Role of Naphthenic Acids in Emulsion Tightness for a Low Total Acid Number (TAN)/High Asphaltenes Oil: Characterization of the Interfacial Chemistry. Energy Fuels 2009, 23, 1280–1288. DOI: 10.1021/ef800620e.
- Gao, S.; Moran, K.; Xu, Z.; Masliyah, J. Role of Naphthenic Acids in Stabilizing Water-in-Diluted Model Oil Emulsions. J. Phys. Chem. B 2010, 114, 7710–7718. DOI: 10.1021/jp910855q.
- Fridjonsson, E. O.; Graham, B. F.; Akhfash, M.; May, E. F.; Johns, M. L. Optimized Droplet Sizing of Water-in-Crude Oil Emulsions Using Nuclear Magnetic Resonance. Energy Fuels 2014, 28, 1756–1764. DOI: 10.1021/ef402117k.
- Mullins, O. C.; Sabbah, H.; Eyssautier, J.; Pomerantz, A. E.; Barré, L.; Andrews, A. B.; Ruiz-Morales, Y.; Mostowfi, F.; McFarlane, R.; Goual, L.; et al. Advances in Asphaltene Science and the Yen–Mullins Model. Energy Fuels 2012, 26, 3986–4003. DOI: 10.1021/ef300185p.
- Yang, F.; Tchoukov, P.; Qiao, P.; Ma, X.; Pensini, E.; Dabros, T.; Czarnecki, J.; Xu, Z. Studying Demulsification Mechanisms of Water-in-Crude Oil Emulsions Using a Modified Thin Liquid Film Technique. Colloid. Surf. A 2018, 540, 215–223. DOI: 10.1016/j.colsurfa.2017.12.056.
- Czarnecki, J.; Tchoukov, P.; Dabros, T. Possible Role of Asphaltenes in the Stabilization of Water-in-Crude Oil Emulsions. Energy Fuels 2012, 26, 5782–5786. DOI: 10.1021/ef300904a.
- Brient, J. A.; Wessner, P. J.; Doyle, M. N. Naphthenic Acids. Kirk-Othmer Encyclopedia of Chemical Technology; John Wiley & Sons: Hoboken, NJ, 2000. DOI: 10.1002/0471238961.1401160802180905.a01.
- Brown, L. D.; Ulrich, A. C. Oil Sands Naphthenic Acids: A Review of Properties, Measurement, and Treatment. Chemosphere 2015, 127, 276–290. DOI: 10.1016/j.chemosphere.2015.02.003.
- Clemente, J. S.; Fedorak, P. M. A Review of the Occurrence, Analyses, Toxicity, and Biodegradation of Naphthenic Acids. Chemosphere 2005, 60, 585–600. DOI: 10.1016/j.chemosphere.2005.02.065.
- Havre, T. E.; Sjöblom, J.; Vindstad, J. E. Oil/Water-Partitioning and Interfacial Behavior of Naphthenic Acids. J. Dispersion Sci. Technol. 2003, 24, 789–801. DOI: 10.1081/DIS-120025547.
- Brandal, Ø.; Sjöblom, J. Interfacial Behavior of Naphthenic Acids and Multivalent Cations in Systems with Oil and Water. II: Formation and Stability of Metal Naphthenate Films at Oil‐Water Interfaces. J. Dispersion Sci. Technol. 2005, 26, 53–58. DOI: 10.1081/DIS-200040145.
- Havre, T.; Ese, M.-H.; Sjöblom, J.; Blokhus, A. Langmuir Films of Naphthenic Acids at Different pH and Electrolyte Concentrations. Colloid Polym. Sci. 2002, 280, 647–652. DOI: 10.1007/s00396-002-0665-4.
- Brocart, B.; Bourrel, M.; Hurtevent, C.; Volle, J. L.; Escoffier, B. ARN-Type Naphthenic Acids in Crudes: Analytical Detection and Physical Properties. J. Dispersion Sci. Technol. 2007, 28, 331–337. DOI: 10.1080/01932690601107161.
- Mediaas, H.; Wolf, N. O.; Baugh, T. D.; Grande, K. V.; Vinstad, J. E. The Discovery of High Molecular Weight Naphthenic Acids (ARN Acid) Responsible for Calcium Naphthenate Deposits. In SPE International Symposium on Oilfield Scale, Society of Petroleum Engineers, Aberdeen, United Kingdom, May 2005, p. 7. DOI: 10.2118/93011-MS.
- Juyal, P.; Mapolelo, M. M.; Yen, A.; Rodgers, R. P.; Allenson, S. J. Identification of Calcium Naphthenate Deposition in South American Oil Fields. Energy Fuels 2015, 29, 2342–2350. DOI: 10.1021/acs.energyfuels.5b00414.
- Lutnaes, B. F.; Brandal, Ø.; Sjöblom, J.; Krane, J. Archaeal C80 Isoprenoid Tetraacids Responsible for Naphthenate Deposition in Crude Oil Processing. Org. Biomol. Chem. 2006, 4, 616–620. DOI: 10.1039/b516907k.
- Horváth-Szabó, G.; Czarnecki, J.; Masliyah, J. Liquid Crystals in Aqueous Solutions of Sodium Naphthenates. J. Colloid Interface Sci. 2001, 236, 233–241. DOI: 10.1006/jcis.2000.7412.
- Friberg, S.; Jansson, P. O.; Cederberg, E. Surfactant Association Structure and Emulsion Stability. J. Colloid Interface Sci. 1976, 55, 614–623. DOI: 10.1016/0021-9797(76)90072-2.
- Magnusson, H.; Hanneseth, A. M. D.; Sjöblom, J. Characterization of C80 Naphthenic Acid and Its Calcium Naphthenate. J. Dispersion Sci. Technol. 2008, 29, 464–473. DOI: 10.1080/01932690701718966.
- Wang, X.; Alvarado, V. Effects of Aqueous-Phase Salinity on Water-in-Crude Oil Emulsion Stability. J. Dispersion Sci. Technol. 2012, 33, 165–170. DOI: 10.1080/01932691.2010.548689.
- Ling, N. N. A.; Haber, A.; Graham, B. F.; Aman, Z. M.; May, E. F.; Fridjonsson, E. O.; Johns, M. L. Quantifying the Effect of Salinity on Oilfield Water-in-Oil Emulsion Stability. Energy Fuels 2018, 32, 10042–10049. DOI: 10.1021/acs.energyfuels.8b02143.
- Graham, B. F.; May, E. F.; Trengove, R. D. Emulsion Inhibiting Components in Crude Oils. Energy Fuels 2008, 22, 1093–1099. DOI: 10.1021/ef700529m.
- Ghloum, E. F.; Oskui, G. P. Investigation of Asphaltene Precipitation Process for Kuwaiti Reservoir. Pet. Sci. Technol. 2004, 22, 1097–1117. DOI: 10.1081/LFT-120038727.
- Johns, M. L. NMR Studies of Emulsions. Curr. Opin. Colloid Interface Sci. 2009, 14, 178–183. DOI: 10.1016/j.cocis.2008.10.005.
- Lingwood, I. A.; Chandrasekera, T. C.; Kolz, J.; Fridjonsson, E. O.; Johns, M. L. Emulsion Droplet Sizing Using Low-Field NMR with Chemical Shift Resolution and the Block Gradient Pulse Method. J. Magn. Reson. 2012, 214, 281–288. DOI: 10.1016/j.jmr.2011.11.020.
- Haber, A.; Akhfash, M.; Loh, C. K.; Aman, Z. M.; Fridjonsson, E. O.; May, E. F.; Johns, M. L. Hydrate Shell Growth Measured Using NMR. Langmuir 2015, 31, 8786–8794. DOI: 10.1021/acs.langmuir.5b01688.
- Stejskal, E. O.; Tanner, J. E. Spin Diffusion Measurements: Spin Echoes in the Presence of a Time‐Dependent Field Gradient. J. Chem. Phys. 1965, 42, 288–292. DOI: 10.1063/1.1695690.
- Torrey, H. C. Bloch Equations with Diffusion Terms. Phys. Rev. 1956, 104, 563–565. DOI: 10.1103/PhysRev.104.563.
- Hollingsworth, K. G.; Johns, M. L. Measurement of Emulsion Droplet Sizes Using PFG NMR and Regularization Methods. J. Colloid Interface Sci. 2003, 258, 383–389. DOI: 10.1016/S0021-9797(02)00131-5.
- Ling, N. N. A.; Haber, A.; May, E. F.; Fridjonsson, E. O.; Johns, M. L. NMR Studies of Emulsion Microstructure Approaching the Phase Inversion Point. Colloid. Surf. A 2014, 462, 244–251. DOI: 10.1016/j.colsurfa.2014.08.031.
- Ling, N. N. A.; Haber, A.; Fridjonsson, E. O.; May, E. F.; Johns, M. L. Shear-Induced Emulsion Droplet Diffusion Studies Using NMR. J. Colloid Interface Sci. 2016, 464, 229–237. DOI: 10.1016/j.jcis.2015.11.013.
- Peña, A. A.; Hirasaki, G. J. Enhanced Characterization of Oilfield Emulsions via NMR Diffusion and Transverse Relaxation Experiments. Adv. Colloid Interface Sci. 2003, 105, 103–150. DOI: 10.1016/S0001-8686(03)00092-7.
- Gaweł, B.; Lesaint, C.; Bandyopadhyay, S.; Øye, G. Role of Physicochemical and Interfacial Properties on the Binary Coalescence of Crude Oil Drops in Synthetic Produced Water. Energy Fuels 2015, 29, 512–519. DOI: 10.1021/ef501847q.
- Simon, S.; Nordgård, E.; Bruheim, P.; Sjöblom, J. Determination of C80 Tetra-Acid Content in Calcium Naphthenate Deposits. J. Chromatogr. A 2008, 1200, 136–143. DOI: 10.1016/j.chroma.2008.05.091.
- Zhu, Q.; Pan, Y.; Jia, X.; Li, J.; Zhang, M.; Yin, L. Review on the Stability Mechanism and Application of Water-in-Oil Emulsions Encapsulating Various Additives. Compr. Rev. Food Sci. Food Saf. 2019, 18, 1660–1675. DOI: 10.1111/1541-4337.12482.
- Rocha, J. A.; Baydak, E. N.; Yarranton, H. W.; Sztukowski, D. M.; Ali-Marcano, V.; Gong, L.; Shi, C.; Zeng, H. Role of Aqueous Phase Chemistry, Interfacial Film Properties, and Surface Coverage in Stabilizing Water-in-Bitumen Emulsions. Energy Fuels 2016, 30, 5240–5252. DOI: 10.1021/acs.energyfuels.6b00114.
- Jones, T. J.; Neustadter, E. L.; Whittingham, K. P. Water-In-Crude Oil Emulsion Stability and Emulsion Destabilization by Chemical Demulsifiers. J. Can. Pet. Technol. 1978, 17, 10. DOI: 10.2118/78-02-08.
- Márquez, A. L.; Medrano, A.; Panizzolo, L. A.; Wagner, J. R. Effect of Calcium Salts and Surfactant Concentration on the Stability of Water-in-Oil (W/O) Emulsions Prepared with Polyglycerol Polyricinoleate. J. Colloid Interface Sci. 2010, 341, 101–108. DOI: 10.1016/j.jcis.2009.09.020.
- Li, C.; Li, Z.; Choi, P. Stability of Water/Toluene Interfaces Saturated with Adsorbed Naphthenic Acids—a Molecular Dynamics Study. Chem. Eng. Sci. 2007, 62, 6709–6715. DOI: 10.1016/j.ces.2007.08.001.
- Friberg, S. E.; Larsson, K.; Sjöblom, J. Food Emulsions; Marcel Dekker Inc.: New York, NY, 2004.
- Dreher, T. M.; Glass, J.; O'Connor, A. J.; Stevens, G. W. Effect of Rheology on Coalescence Rates and Emulsion Stability. AIChE J 1999, 45, 1182–1190. DOI: 10.1002/aic.690450604.
- Hou, L-t.; Liu, S.; Zhang, J.; Xu, J-y Evaluation of the Behavioral Characteristics in a Gas and Heavy Oil Stratified Flow according to the Herschel–Bulkley Fluid Model. ACS Omega 2020, 5, 17787–17800. DOI: 10.1021/acsomega.0c02482.
- Sami, N. A.; Ibrahim, D. S.; Abdulrazaq, A. A. Investigation of non-Newtonian Flow Characterization and Rheology of Heavy Crude Oil. Pet. Sci. Technol. 2017, 35, 856–862. DOI: 10.1080/10916466.2017.1280505.
- Liu, H.; Zeiada, W.; Al-Khateeb, G. G.; Shanableh, A.; Samarai, M. Characterization of the Shear-Thinning Behavior of Asphalt Binders with Consideration of Yield Stress. Mater. Struct. 2020, 53, 105. DOI: 10.1617/s11527-020-01538-0.
- Zeiada, W.; Liu, H.; Al-Khateeb, G. G.; Shanableh, A.; Samarai, M. Evaluation of Test Methods for Measurement of Zero Shear Viscosity (ZSV) of Asphalt Binders. Constr. Build. Mater. 2022, 325, 126794. DOI: 10.1016/j.conbuildmat.2022.126794.
- Hemmingsen, P. V.; Silset, A.; Hannisdal, A.; Sjöblom, J. Emulsions of Heavy Crude Oils. I: Influence of Viscosity, Temperature, and Dilution. J. Dispersion Sci. Technol. 2005, 26, 615–627. DOI: 10.1081/DIS-200057671.
- Sheu, E. Y.; Storm, D. A.; Shields, M. B. Adsorption Kinetics of Asphaltenes at Toluene/Acid Solution Interface. Fuel 1995, 74, 1475–1479. DOI: 10.1016/0016-2361(95)00120-T.
- Sheu, E. Y.; De Tar, M. M.; Storm, D. A. Interfacial Properties of Asphaltenes. Fuel 1992, 71, 1277–1281. DOI: 10.1016/0016-2361(92)90054-R.
- Li, Z.; Cranston, B.; Zhao, L.; Choi, P. Molecular Dynamics Studies of the Stability of Water/n-Heptane Interfaces with Adsorbed Naphthenic Acids. J. Phys. Chem. B 2005, 109, 20929–20937. DOI: 10.1021/jp053048d.
- Delgado, C.; Merchán, M. D.; Velázquez, M. M.; Anaya, J. Effect of Surfactant Structure on the Adsorption of Carboxybetaines at the Air–Water Interface. Colloid. Surf. A 2006, 280, 17–22. DOI: 10.1016/j.colsurfa.2005.12.058.
- Poveda, J. C.; Molina, D. R. Average Molecular Parameters of Heavy Crude Oils and Their Fractions Using NMR Spectroscopy. J. Pet. Sci. Eng. 2012, 84–85, 1–7. DOI: 10.1016/j.petrol.2012.01.005.
- Barros, E. V.; Dias, H. P.; Pinto, F. E.; Gomes, A. O.; Moura, R. R.; Neto, A. C.; Freitas, J. C. C.; Aquije, G. M. F. V.; Vaz, B. G.; Romão, W. Characterization of Naphthenic Acids in Thermally Degraded Petroleum by ESI(−)-FT-ICR MS and 1H NMR after Solid-Phase Extraction and Liquid/Liquid Extraction. Energy Fuels 2018, 32, 2878–2888. DOI: 10.1021/acs.energyfuels.7b03099.
- Saab, J.; Mokbel, I.; Razzouk, A. C.; Ainous, N.; Zydowicz, N.; Jose, J. Quantitative Extraction Procedure of Naphthenic Acids Contained in Crude Oils. Characterization with Different Spectroscopic Methods. Energy Fuels 2005, 19, 525–531. DOI: 10.1021/ef049930k.
- Terreros, A.; Galera Gomez, P.; Lopez-Cabarcos, E. Influence of the Surfactant Chain Length and the Molecular Weight of Poly(Oxyethylene) on the Stability of Oil-in-Water Concentrated Emulsions. Prog. Colloid Polym. Sci. 2000, 115, 50–54. DOI: 10.1007/3-540-46545-6_11.
- Facanali, R.; Porto, N.; Crucello, J.; Carvalho, R. M.; Vaz, B. G.; Hantao, L. W. Naphthenic Acids: Formation, Role in Emulsion Stability, and Recent Advances in Mass Spectrometry-Based Analytical Methods. J. Anal. Methods Chem. 2021, 2021, 6078084. DOI: 10.1155/2021/6078084.
- Varadaraj, R.; Brons, C. Molecular Origins of Heavy Crude Oil Interfacial Activity Part 2: Fundamental Interfacial Properties of Model Naphthenic Acids and Naphthenic Acids Separated from Heavy Crude Oils. Energy Fuels 2007, 21, 199–204. DOI: 10.1021/ef060425s.
- Varadaraj, R.; Brons, C. Molecular Origins of Heavy Oil Interfacial Activity Part 1: Fundamental Interfacial Properties of Asphaltenes Derived from Heavy Crude Oils and Their Correlation to Chemical Composition. Energy Fuels 2007, 21, 195–198. DOI: 10.1021/ef0604240.
- Yang, X.; Czarnecki, J. Tracing Sodium Naphthenate in Asphaltenes Precipitated from Athabasca Bitumen. Energy Fuels 2005, 19, 2455–2459. DOI: 10.1021/ef058017w.