
ABSTRACT
For this study, the 100 most highly cited items from Scopus were examined for each Big Ten Academic Alliance school (plus University of Chicago) to determine format use, subjects covered, citation counts, publisher trends, and other details. In all, 1,223 unique items were examined. Journals and commercial publishers dominated, but were not exclusive. Similarly, expected titles Science and Nature appeared, but did not overwhelmingly dominate the citation counts nor the number of appearances in the results. The publication title list included 479 unique titles, with many journal titles appeared only once. Science titles dominated, with some social sciences (especially psychology) titles showing up in the highly cited list. Total citation counts varied widely across institutions. The schools examined had a good degree of inter-institution collaboration.
Introduction
The Big Ten Academic Alliance (BTAA) is a consortium of some of the largest universities in the United States. Established in 1958 as the Committee on Institutional Cooperation. This collaborative group has grown beyond the original schools, adding new institutions as recently as 2013 (Big Ten Academic Alliance Citationn.d.). These institutions are all high-level research institutions with a large output of scholarship. The author’s institution is a member of the BTAA. The institutions examined are outlined in , with information about their research expenditures, enrollment, and faculty numbers. Adding in the University of Chicago (which often collaborates with BTAA, such as with library initiatives), these 15 schools combined represent 10,907,383,681 USD in research spending, 615,205 students, and 53,390 faculty as of 2017. Thus, the scholarly output by those affiliated with these universities represents a significant number of researchers, students, and research expenditure.
Table 1. Schools examined
Given the size and scope of these institutions, the highest-cited items from these schools is thus able to give a good representation of scholarly output of the United States’ colleges and universities. This paper will examine the 100 most highly cited items for each school retrieved from the Scopus database. The formats of items retrieved, subject areas for the items, publishers, and titles trends are examined for these items. These details can help inform libraries and universities in general, but also serve as metrics and directions that may be of use for research scholars making decisions about publication.
Literature review
Citation rates give an idea of how much a specific title is being used in the literature. While no database tracking of citations is completely thorough, these citation counts can be used as an indicator of the value of a particular title. Databases like Web of Science, Scopus, and Google Scholar are used in multiple studies of citation counts and the characterization of such works.
Aksnes (Citation2006) examined the works of Norwegian scientists and sought their judgments about citation counts. Their findings were (182):
In the study the citation counts of the publications corresponded moderately well with the authors’ own assessments of scientific contribution. Generally, citations proved to have the highest accuracy in identifying either major or minor contributions. Nevertheless, at the level of the individual article citations are not, according to these judgments, a reliable indicator of a paper’s scientific contribution. In particular, review articles were considered to be divergent in the way that the citation counts did not reflect the scientific contribution of these papers adequately – the scientific value was largely overestimated.
When inquiring about the extent that citation counts during a title’s first 5 years reflects its scientific contribution, Aksnes (Citation2006) found that a majority of those responding indicated that the extent was large. However, this was a bare majority of 50.9%. indicating that many researchers rate it as less important (36.7% some extent, 8.7% no extent, with 3.7% unanswered/ambiguous). However, it is worth noting that review articles were singled out as a type of item that got higher citation counts compared to their contribution to the field. Also noted is that the views are based on perceptions of those surveyed.
Levitt and Thelwall (Citation2008) examined whether items in multidisciplinary journals got better citation rates than those in more discipline-specific (monodisciplinary) journals. Their findings indicated multidisciplinary journals did not get more citations, especially in the sciences.
Martín-Martín et al. (Citation2016) examined highly cited items from Google Scholar, and found that 51% of the items were from journals, 18% from books/book chapters, 29% unknown, 1% from conference proceedings, and 1% from other types. However, the authors noted that when focused solely on the 25 most cited items, books outpaced journals. These high citation rates for books may be analogous to the findings of Aksnes (Citation2006) related to review article citations.
Noorhidawati et al. (Citation2017) examined characteristics of highly cited Malaysia-authored articles. The findings related to quantities of authors were particularly interesting, indicating about two-thirds of the items examined having four or more authors. A number of titles had a large number of authors, with 6.4% having 1,000 or more authors and 17.1% having 11–999 authors. Dorta-González and Santana-Jiménez (Citation2019) found in their study of highly-cited articles that the median number of authors was 5. They examined other factors, such as page count, number of references, and even the total number of characters, and even more specifically certain punctuation marks, in the titles and abstracts.
Figg et al. (Citation2006) examined three years (1975, 1985, and 1995) of articles from six highly cited science journals and found functional relationships between the number of collaborating authors, and to a lesser extent institutions, and high citation rates. The authors also noted a trend for more authors, especially for clinical topics. They pointed out a concern about author inflation and its potential to have biased their study.
Marx and Bornmann (Citation2015) studies citation rates by broad subject discipline using Web of Science and examined works published every five years 1990–2010. The findings saw medical and health sciences and natural sciences as the subject areas showing the most citations on average (although uncategorized items sometimes did better on average). While humanities titles tended to have lower citations on average compared to most disciplines, the social sciences were often the third most cited category.
In terms of formats, Lee (Citation2019) found that 78.7% of the sampled conference papers received less than ten citations in a five-year time period, with 24.2% of the papers getting no citations. The same study also found that some conference series produced over a thousand papers, but saw over a fifth of the papers getting no citations within five years.
A final consideration is whether an author’s institution affects citation rate. According to Slyder et al. (Citation2011), a work’s author affiliation does not significantly affect citation rates. However, this article also indicates their results differed from multiple other studies that indicated the exact opposite to be the case. The authors also proposed several possible reasons for affiliation bias in citations found in other works. It is interesting that while there seems to be evidence of bias, this work found none. At the very least, this seems to indicate that there is some evidence, despite the differing findings by the authors, that affiliation bias that could result in higher citation counts.
It seems clear from these studies that citation rates matter when it comes to deeming a given item’s importance to the field, that collaborative efforts tend to get better citation rates, and that multidisciplinary journals do not always get the best citation counts. The mention of the number of authors increasing is intriguing given that science publications have long been associated with a hefty author list – and that list seems to be growing, on average. It also seems that there is some indication of bias toward heavy citation for certain formats and potentially institutional bias. So, what are the characteristics of highly cited items, especially those of the BTAA?
Materials and methods
For each school, Scopus (https://www.scopus.com) was searched for an affiliation and sorted by times cited. Scopus usually has affiliation information for each author of a given title. The 100 most cited items meeting these criteria for each school were recorded in Excel, with the following details about each item recorded:
Citation
Document Type
Source Type
Citations Received
Source Title
LC Call number for Publication
Publisher
Ranking (1–100) according to the times cited per Scopus.
There were thus 1,500 publications (100 for each of the 15 institutions), but only 1,223 unique titles (indicating a good deal of inter-institution collaboration). The data were then analyzed to determine information about:
What were the year ranges for the items?
What were the most common publication and document types?
What source titles and publishers were most common?
What subject areas dominate? The author assigned each publication type an LC call number.
What were the total citations per school for its 100 articles?
What schools had the highest rates?
Why scopus?
Scopus was chosen as it has a larger title coverage than Web of Science, but allows for easy affiliation identification, which Google Scholar does not. It is worth noting, however, that Scopus and Web of Science perform less well with arts, humanities, and social science titles tracking. Martín-Martín et al. (Citation2019) found that Google Scholar by far outperformed these two databases for examined non-science disciplines. Scopus, however, did slightly better than Web of Science for discovery in these disciplines. As noted, the other key reason for Scopus was its ease with author affiliation searching.
Results
Year of publication
Titles ranged 1943–2018, with most of the titles from after 2000. The median year was 2001 and the most common publication year was 2003. While newer items dominated, the presence of older content indicates continued interest in and citation of older items. About 42% of the items were pre-2000 content, indicating older items are showing decent citation rates and showing up as highly-cited items in these schools’ Top 100 lists. gives the distribution of titles for each decade, 1940 s-present.
Figure 1. Decade distribution
Publication type & document type
In terms of publication type, journals by far outpaced all other formats for the highly-cited content, with 96.3% of the items examined being in journals. Books, conference proceedings, magazines, and a newsletter comprised the remaining items in that order, but accounted for only 3.7% of the content. See for the distribution of these titles. The popularity of journals is similar as found of a study of Google Scholar (although far less of an extreme), as found by Martín-Martín et al. (Citation2016). Only 1.1% of the items examined were conference papers. The findings regarding the low number of conference papers by Lee (Citation2019) seems to align with the presence of few conference papers in the items identified as highly cited in this article.
Figure 2. Publication type
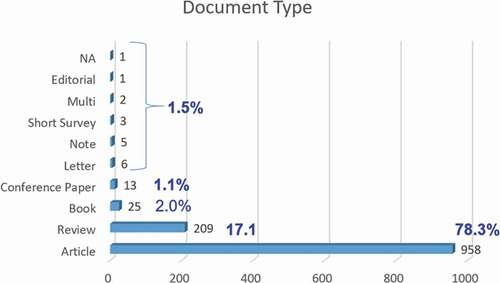
Scopus assigns a document type to items. Most of the items (78.3%) examined were listed as articles, but the document type review was assigned to 17.1% of the items. Additional types were assigned at much smaller numbers, as outlined in . Note that one item was not assigned (NA) as a document type. As mentioned in the literature review, Aksnes (Citation2006) found that scientists felt highly-cited review articles got more citations than their contributions to the discipline warranted. Thus, a large number of citing items being review articles is reflective of their popularity, despite being seen as lesser value per the Aksnes study.
Figure 3. Document type
Source titles & publishers
In terms of individual publication titles (mostly composed of journal titles), there were 479 unique publication titles. Thirteen of these had more than ten items representing, with Science, Nature, and New England Journal of Medicine being the top titles and being the publication for 20.9% of the items examined. indicates the titles with more than 10 items in the highly cited list.
Table 2. Top journal titles
However, there was a wide distribution of titles, with 309 publications having only one matching title, indicating a wide variety of publication venues for highly-cited content. Referring back to Levitt and Thelwall (Citation2008), they found that multidisciplinary journals did not get higher citation rates. The findings about journal titles here indicates that while some of the multidisciplinary journals were at or near the top of the list of titles in terms of number of corresponding articles, the majority of items were not published in multidisciplinary titles like Science or Nature.
Publishers were assigned to each publication by examining the publication titles in tools like Scopus, the OSU Library Catalog (https://library.ohio-state.edu), and Ulrichs (http://ulrichsweb.serialssolutions.com). shares the distribution of publishers. Imprints were listed under one publisher and titles were assigned to the publisher currently controlling the publication title rather than at the time of publication. For example, Academic Press items were assigned to Elsevier.
Table 3. Publisher distribution
A total of 77 publishers were identified for the publications. Note the top publishers, accounting for items with more than 10 matches, is a mix of commercial, society, and university press publications. However, commercial publishers occupy the top three spots, which account for 35.7% of the items examined. SpringerNature was the top publisher, partially, but not exclusively, due to its control over the suite of Nature titles. It is worth noting that several societies had more than 50 items among these highly-cited items.
Subject matter
Using the publication title (journal, book, conference proceedings, etc.), the item was searched in library catalogs (primarily the OSU Library Catalog and WorldCat) and the same LC call number was assigned to all items with that publication. A minor number of items were online-only journal publications with no discoverable LC call number, so one was assigned based on the LCSH assigned to the title in library catalogs. Computer Science titles were separated from mathematics by using the more specific QA76 call number. See .
Figure 4. LC distribution
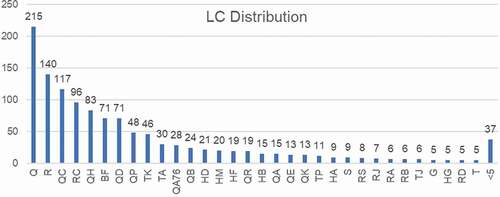
From this information, it is clear that the sciences by far dominate the publications. About 53% of the publications are assigned to LC call numbers Q, R, QC, RC, and QH. See in the Appendix for the subject areas aligned to these call numbers.
The social sciences show some representation, for example with BF call numbers being in sixth place. Psychology titles were thus very highly represented. No humanities call numbers had more than four matching publications. Note some of these titles may publish interdisciplinary research despite their call number. Also note that some call numbers, usually considered non-science, tend to have science items. For example, HA has statistics titles and G has titles related to physical geography and climate.
These findings should be in context of subject coverage by Scopus. Martín-Martín et al. (Citation2019) point out the stronger indexing in Scopus for science and social sciences. Indexing does not necessarily correspond to items getting cited, but it also means citation data cannot be tracked when they are cited.
Looking at the LC distribution more broadly (e.g., Q call numbers combined), all Q through T call numbers account for about 84.9% of the total publication titles, indicating a strong bent toward the sciences for the highly cited research. See for the broader distribution. These broader call numbers are also outlined in in the Appendix.
Figure 5. Broader call number groupings
This roughly corresponds to Marx and Bornmann (Citation2015), which had medical and health sciences and natural sciences as the most cited, with social sciences showing up often in third place in the different years studied.
Citation rates & top schools
Given this study examined most cited items from these schools, the citation rates of the titles were examined. Over 4.6 million citations total were received from these 1,223 items, ranging from a high of 58,005 to a low of 873. shares the findings about citation counts.
Table 4. Total citation data
Each school’s list of top 100 cited items was examined to determine the total citations for its 100 titles. The total citations ranged from 162,650 to 605,401. The school with the most citations was University of Michigan and the one with the least was University of Nebraska – Lincoln. gives the total citations for each school.
Figure 6. Cumulative citations per schools’ top 100 most cited items
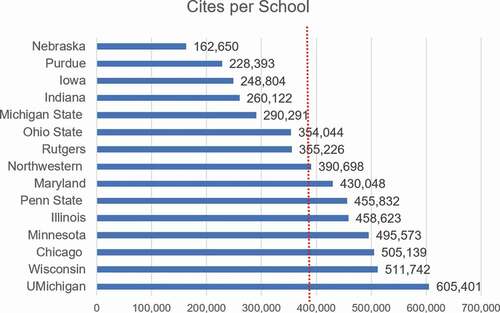
The vertical dashed line is placed in to indicate the average of these counts, at 383,506. Which is just below the count for Northwestern. Also note the numbers add up to more than the total number of citations for all documents as the items in include overlapping titles (for as many as 11 institutions).
Referring back to Slyder et al. (Citation2011), their findings found no evidence of affiliation significantly influencing citation rates, but indicated that this differed with others’ findings. Therefore, it is worth noting that given the size of the schools examined, it is possible these works were cited because of a BTAA affiliation.
Institutions sharing top 100
When seeing there were only 1,223 total items, the titles were examined to see what the overlap was amount the Top 100 lists. Note that a title may be lower on a school’s list of cited items – it just did not make it to that school’s Top 100. Thus, it is likely there is more institutional overlap if the full list of institutions were examined for each individual item.
Most titles were from just one of the 15 schools, but a decent number (10.2%, 125 titles) appeared on the list of Top 100 titles for 2–11 schools (none had more than 11 for the Top 100 lists). This indicates a decent amount of overlap for research between these schools. See for a breakdown.
Table 5. Schools per title
While not directly related to the number of schools, Dorta-González and Santana-Jiménez (Citation2019) and Noorhidawati et al. (Citation2017) both found large numbers authors being common, indicating a good degree of collaboration is happening in research. Figg et al. (Citation2006) found more explicitly multi-institution collaborations lead to higher citation rates.
A few additional findings from these 125 titles (again with the caveat that schools with the titles lower in their citation lists were not accounted for):
55 (44.0%) are listed by Scopus as open access.
All are from the publication type journal.
The school most often listed as a collaborator was the University of Maryland.
The school least often listed as a collaborator was the University of Nebraska-Lincoln.
The top five publishers used were:
Springer Nature (29 items)
Elsevier (19 items)
AAAS (15 items)
IOP (10 items)
APS (9 items)
The top four publication titles (journals) were (all other titles had under five title matches):
Nature (23 items)
Science (15 items)
The Lancet (12 items)
New England Journal of Medicine (6 items)
BTAA institutions’ data in context
The data given in gives context about these schools. While the BTAA Data is from 2017 and the publications and their citations are from a wide range of years, the data from the BTAA can be used to give additional context to the citation rates for each school. While imperfect, this can give some additional context per school in terms of:
Research expenditures dollars per citation.
Citations per student.
Citations per full-time faculty number.
shares this citation data in context with the BTAA data. Examining these numbers, University of Chicago especially stands out in terms of the lowest number of research expenditure dollars per citation and the highest citations per student. University of Illinois at Urbana–Champaign has the most citations per full-time faculty member, with University of Chicago having the second-highest.
Table 6. Citation rates & BTAA data
Discussion
The data gathered indicates that the highly cited items from these schools show a strong preference for journals, a preference for commercial publishers, a preference for discipline-specific journals, a fairly strong representation from the sciences, and evidence of inter-school collaborations. As the main interest going into this study was citation rates, the data on this are particular interesting. These schools saw a wide range of total citations and some interesting findings come from considering institutional characteristics.
Journals by far dominated, with 96.3% of the items examined being from journals. However, while the titles with the most items were multidisciplinary titles like Science and Nature, the majority of items came from discipline-specific journals. Commercial publishers dominated, but were not exclusive. University presses and societies were represented in the publication titles. In other words, large commercial publishers or big catch-all titles are not the only place in which highly-cited research is published. This has implications for decision-making about library collections and potentially other issues, like tenure and promotion.
When assigned to an LC call number, most publication titles fall into science disciplines, with some social science call numbers represented. As noted previously, science sources often tend to dominate in similar studies. But considerations should be given to the fact that science (and to a degree, social science) publications are much better indexed than arts and humanities titles, especially in Scopus and Web of Science. So, the data gathered is only as good as the indexing of the disciplines. In other words, there may be highly-cited arts and humanities items missed due to not being indexed by Scopus.
A good degree of collaboration occurred, with 100 titles per school examined, there are 1,223 unique titles overall. These 1,223 titles totaled over 4.6 million citations. As many as 11 institutions sharing research going into a publication. This points to these schools, which (except for University of Chicago, which is often a collaborator in initiatives) do a good bit of collaboration. Over ten percent of the items examined had more than one of the schools involved.
Overall, these schools saw quite highly cited items, with a difference of 442,751 total citations between the most and least total citations per school. However, when taking into consideration institutional research expenditures, total number of students, and total number of faculty, University of Chicago has the least research expenditure dollars per citation and the most citations per student. University of Illinois at Urbana–Champaign has the most citations per faculty member. Note however that this is all based on 2017 data for the schools, while the citation numbers cover several decades with of citations and publication years.
Overall, the findings indicate that there is a lot of research output from these schools, with the most-cited items showing heavy presence of the sciences. The overlap between these institutions for these items points toward the value of multi-institution collaboration. While major multidisciplinary journal titles were at the top, they did not totally dominate. Authors overall leaned on discipline-specific titles for their publications. Finally, while commercial publishers were heavily represented, they did not have an exclusive to the publication record.
Future directions
As noted in the literature review, other studies found highly-cited items to have multiple authors and often multiple institutions. The data gathered could of course be examined to see if this trend holds true for these highly-cited articles. Other potential questions might be answered with this data. What authors and institutions might be working most commonly together? Are there disciplines that work heavily together between these institutions? This may point to the need for BTAA support or initiatives related to these collaborations. The data would be able to point to an unknown need.
References
- Aksnes, D. W. 2006. Citation rates and perceptions of scientific contribution. Journal of the American Society for Information Science & Technology 57 (2):169–85. doi:https://doi.org/10.100/asi.20262.
- Batchelor, M. 2018. America’s top 100 Universities in research and development spending in 2017. CEOWORLD Magazine, November 30. Accessed June 5, 2020. https://ceoworld.biz/2018/11/30/americas-top-100-universities-in-research-and-development-spending-in-2017/
- Big Ten Academic Alliance. 2019. 2017 Big Ten Academic Alliance Data. Accessed June 5, 2020. https://www.btaa.org/docs/default-source/research-data/at-a-glance_btaa2017.pdf?sfvrsn=d3a148f3_2
- Big Ten Academic Alliance. n.d. History of the Big Ten Academic Alliance. Accessed June 5, 2020. https://www.btaa.org/about/history
- Dorta-González, P., and Y. Santana-Jiménez. 2019. Characterizing the highly cited articles: A large-scale bibliometric analysis of the top 1% most cited research. Malaysian Journal of Library & Information Science 24 (2):23–39. doi:https://doi.org/10.22452/mjlis.vol24no2.2.
- Figg, W. D., L. Dunn, D. J. Liewehr, S. M. Steinberg, P. W. Thurman, J. C. Barrett, and J. Birkinshaw. 2006. Scientific collaboration results in higher citation rates of published articles. Pharmacotherapy 26 (6):759–67. doi:https://doi.org/10.1592/phco.26.6.759.
- Lee, D. M. 2019. Predictive power of conference‑related factors on citation rates of conference papers. Scientometrics 118:281–304. doi:https://doi.org/10.1007/s11192-018-2943-z.
- Levitt, J. M., and M. Thelwall. 2008. Is multidisciplinary research more highly cited? A macrolevel study. Journal of the American Society for Information Science & Technology 59 (12):1973–84. doi:https://doi.org/10.1002/asi.20914.
- Martín-Martín, A., E. Orduna-Malea, J. M. Ayllón, and E. D. López-Cózar. 2016. A two-sided academic landscape: Snapshot of highly-cited documents in Google Scholar (1950-2013). Revista española de Documentación Científica 39:4. doi:https://doi.org/10.3989/redc.2016.4.1405.
- Martín-Martín, A., E. Orduna-Malea, M. Thelwall, and E. Delgado-López-Cózar 2019. Google scholar, web of science, and scopus: Which is best for me? LSE Impact Blog (blog), December 3. London School of Economics and Political Science. https://blogs.lse.ac.uk/impactofsocialsciences/2019/12/03/google-scholar-web-of-science-and-scopus-which-is-best-for-me/.
- Marx, W., and L. Bornmann. 2015. On the causes of subject-specific citation rates in Web of Science. Scientometrics 102:1823–27. doi:https://doi.org/10.1007/s11192-014-1499-9.
- Noorhidawati, A., M. K. Yanti Idaya Aspura, M. N. Zahila, and A. Abrizah. 2017. Characteristics of Malaysian highly cited papers. Malaysian Journal of Library & Information Science 22 (2):85–99. doi:https://doi.org/10.22452/mjlis.vol22no2.6.
- Slyder, J. B., B. R. Stein, B. S. Sams, D. M. Walker, B. J. Beale, J. J. Feldhaus, and C. A. Copenheaver. 2011. Citation pattern and lifespan: A comparison of discipline, institution, and individual. Scientometrics 89:955–66. doi:https://doi.org/10.1007/s11192-011-0467-x.
- University of Chicago. 2017. Faculty and staff: At a glance. Accessed June 5, 2020. https://web.archive.org/web/20190331053902/https://data.uchicago.edu/at_a_glance.php?cid=16&pid=2&sel=atg
- University of Chicago. 2018. Autumn quarter 2017 statistical Reports. Accessed June 5, 2020. https://uchicago.app.box.com/s/trkqpw1ztu0lc4niahgz0y7g6eyqt6z6/file/330473736896
Appendix
Table A1. Call numbers and subject areas for and