
Abstract
Problem, research strategy, and findings: The impact of density on emerging highly contagious infectious diseases has rarely been studied. In theory, dense areas lead to more face-to-face interaction among residents, which makes them potential hotspots for the rapid spread of pandemics. On the other hand, dense areas may have better access to health care facilities and greater implementation of social distancing policies and practices. The current COVID-19 pandemic is a perfect case study to investigate these relationships. Our study uses structural equation modeling to account for both direct and indirect impacts of density on the COVID-19 infection and mortality rates for 913 U.S. metropolitan counties, controlling for key confounding factors. We find metropolitan population to be one of the most significant predictors of infection rates; larger metropolitan areas have higher infection and higher mortality rates. We also find that after controlling for metropolitan population, county density is not significantly related to the infection rate, possibly due to more adherence to social distancing guidelines. However, counties with higher densities have significantly lower virus-related mortality rates than do counties with lower densities, possibly due to superior health care systems.
Takeaway for practice: These findings suggest that connectivity matters more than density in the spread of the COVID-19 pandemic. Large metropolitan areas with a higher number of counties tightly linked together through economic, social, and commuting relationships are the most vulnerable to the pandemic outbreaks. They are more likely to exchange tourists and businesspeople within themselves and with other parts, thus increasing the risk of cross-border infections. Our study concludes with a key recommendation that planners continue to advocate dense development for a host of reasons, including lower death rates due to infectious diseases like COVID-19.
The COVID-19 pandemic is a perfect case study to investigate the relationship between density and the spread of highly contagious infectious diseases. This novel coronavirus outbreak was first recorded in Wuhan (China) in December 2019 (Cascella et al., Citation2020). In less than 4 months, it has spread to more than 212 countries and territories around the world and was declared a pandemic by the World Health Organization (WHO) on March 11, 2020 (WHO, Citation2020). As of May 27, there are more than 1,697,459 confirmed cases of COVID-19 in the United States, with 100,271 confirmed COVID-19-related deaths.
On April 23, 2020, the New York Times published an article titled, “America’s Biggest Cities Were Already Losing Their Allure. What Happens Next?” (Tavernise & Mervosh, Citation2020). The article confounds population size with density, as in this passage: “The pandemic has been particularly devastating to America’s biggest cities, as the virus has found fertile ground in the density that is otherwise prized.” In fact, metropolitan population and county density are distinct. The New York metropolitan area (the epicenter of the virus) is huge but has low-density counties as well as high-density counties. The virus may take root in the city center but then spread into the suburbs due to the inextricable connections between them.
Even in smaller metropolitan statistical areas (MSAs) like New Orleans (LA), which is 1/20th the size of the New York MSA and has eight counties with widely varying densities, densities vary much more than confirmed infection rates. The simple correlation between the two is just over 0.48, meaning that for this metropolitan area, density accounts for only 23% of the variation in the virus rate.
On May 2, CNN published “Coronavirus Is Making Some People Rethink Where They Want to Live,” which described an exodus from New York for smaller and less dense places (Shoichet & Jones, Citation2020). The article quoted the governor’s explanation: “It’s very simple. It’s about density. It’s about the number of people in a small geographic location allowing that virus to spread.… Dense environments are its feeding grounds.” The article then quoted an academic from the Los Angeles area as crediting that city’s “sprawling” development with slowing the spread of coronavirus.
As these examples illustrate, compactness (mainly density) versus sprawl is one of the most controversial topics in urban planning. In a recent review article, two of us (Ewing & Hamidi, Citation2015a) summarize existing evidence on major costs and benefits of urban sprawl. Many scholars have pointed to the benefits of compact development for individuals and society. According to this line of research, compact development is associated with open space preservation (Nelson & Sanchez, Citation2005), higher innovation and overall economic productivity (Hamidi & Zandiatashbar, Citation2019), more opportunities for upward mobility (Ewing et al., Citation2016), greater social capital (Nguyen, Citation2010), less likelihood of obesity and related chronic diseases (Ewing et al., Citation2014), less car dependency and its associated quality of life outcomes such as traffic congestion (Zolnik, Citation2011), improved traffic safety (Ewing & Hamidi, Citation2015b; Ewing et al., Citation2016), improved air quality (Stone, Citation2008), and increased overall life expectancy (Hamidi et al., Citation2018).
Urban sprawl, on the other hand, could mitigate racial segregation and close the gap between rates of suburban homeownership for African Americans and Whites (Galster & Cutsinger, Citation2007; M. Kahn, Citation2001). During the Cold War, dispersal of population was frequently mentioned as a countermeasure to a nuclear attack (Kargon & Molella, Citation2004). After 9/11, similar arguments were occasionally put forth as a means of making us less vulnerable to terrorist attacks (Briffault, Citation2002; Glaeser & Shapiro, Citation2002). Though the mechanism is different, the purpose is the same as with infectious diseases: Self-protection may accompany dispersal of population.
Yet, the impact of density on emerging infectious diseases has been rarely studied. In theory, density leads to closer contact and more interaction among residents, which makes them potential hotspots for the rapid spread of emerging infectious diseases. In the case of worldwide pandemics such as the recent COVID-19 virus, larger, dense urban centers, particularly if coupled with strong tourism, could become epicenters of a worldwide health crisis and lead to thousands of deaths in the United States and internationally. At the same time, their superior health and educational systems could help mitigate the full impact of the disease for those who are infected, leading to higher rates of recovery and lower rates of mortality. Even the relationship between density and exposure is not a straight line. Dense areas may be more likely to put in place policies that foster social distancing, thus reducing actual rates of infection or simply leading to greater social distancing due to greater public awareness of the threat. In addition, it is possible that denser environments make it easier for people to stay somewhat connected with neighbors, families, and friends while they are sheltering in place.
There is little empirical evidence related to this theory. Spencer et al. (Citation2020) finds that a nonlinear and Kuznets-shaped urban transition could increase the likelihood of recurring outbreaks of infectious diseases such as avian influenza in Vietnam due to limited household-level sanitation infrastructure. However, it is not clear whether and to what extent dense development could exacerbate the spread of life-threatening infectious diseases.
Our study is to our knowledge the first peer-reviewed publication to investigate the relationship between density and the COVID-19 spread and mortality in the United States, controlling for confounding factors. This is a perfect example of the application of structural equation modeling, as explained in the Conceptual Framework and Research Design section. Our outcome variables are COVID-19 confirmed cases and deaths per 10,000 population. We find metropolitan population to be one of the most significant predictors of infection rates, with larger metropolitan areas experiencing higher infection and higher mortality rates. We also find that after controlling for metropolitan population, county density is unrelated to the infection rate and negatively related to the mortality rate, possibly due to greater adherence to social distancing policies and practices in denser areas and better quality of health care.
These findings suggest that connectivity matters more than density in the spread of the COVID-19 pandemic. Large metropolitan areas (and megaregions) with a higher number of counties tightly linked together through economic, social, and commuting relationships are the most vulnerable to the pandemic outbreak. They are more likely to exchange tourists and businesspeople with each other and with other parts of the world, thus increasing the risk of cross-border infections. Our study concludes with a strong recommendation that planners continue to advocate compact development for a host of reasons, including lower death rates due to infectious diseases like COVID-19.
Built Environment, Urban Sprawl, and Highly Contagious Infectious Diseases
Compact development has been empirically linked to higher economic productivity and likelihood of innovation generation by facilitating the formation of an urban buzz that hosts the frequent face-to-face contacts, leading to higher chances of knowledge spillover and, in turn, higher knowledge-based economic productivity (Hamidi et al., Citation2019; Zandiatashbar et al., Citation2019).
For the same reasons, dense areas could also facilitate the transmission of highly contagious diseases. If people are close enough to each other to exchange ideas, they can exchange highly contagious diseases, too, at least in theory (Glaeser, Citation2011). The empirical evidence to support this theory is rare and offers mixed findings.
According to Kao et al. (Citation2012), the H1N1 pandemic of 2009 persisted for a relatively longer period of time in areas in Taiwan with higher population density. In the same line, Garrett (Citation2010) finds a positive and significant relationship between the death rate from the 1918 influenza pandemic and the state-level population density in the United States. On the other hand, Chowell et al. (Citation2008) and Nishiura and Chowell (Citation2008) find quite the opposite: There is no significant relationship between population density, degree of transmissibility, and mortality during the same 1918 pandemic in the United Kingdom and Japan, respectively. In the same line, Mills et al. (Citation2004), in their letter to Nature, state there are no significant associations between mortality rate and population density during the 1918 influenza pandemic in 45 large U.S. cities, whereas Parmet and Rothstein (Citation2018), in an editorial piece in the American Journal of Public Health, argue that if we look at the rates rather than counts during the 1918 pandemic, rural/low-density areas were hit harder than the cities with lower mortality rates.
One possible explanation for these conflicting findings is that the dynamics behind a pandemic spread are highly complex. There are several other variables that could potentially confound contagious disease transmission, including demographic characteristics (Valeri et al., Citation2016), socioeconomic disparities (Quinn & Kumar, Citation2014), and tourism (Alirol et al., Citation2011).
Sociodemographic characteristics and social inequities could contribute to a faster spread of infectious diseases, but also could prevent access to health care, which consequently leads to substantially higher rates of mortality. Quinn, Kumar, and colleagues (Blumenshine et al., Citation2008; Quinn & Kumar, Citation2014; Quinn et al., Citation2011), in a series of studies, point to the significant roles of income, race, and ethnicity in higher rates of H1N1 infection and mortality. Low-income and minority populations have higher exposure to contagious diseases such as flu virus and have lower access to health care once the disease has developed, which is a key determinant of infectious disparities between and within U.S. regions. Their higher level of exposure is due to the lack of access to resources such as workplace policies, paid sick days, and job security that would enable social distancing, the single most effective preventive intervention at the time of a disease epidemic (Kumar et al., Citation2012). Lower educational attainment is also reported to increase the rate of hospitalization at the time of epidemics, such as the 2009 H1N1 (Lowcock et al., Citation2012). Finally, age is a determinant of vulnerability to novel viruses and the severity of the disease once developed due to weakened immune systems among older populations. In the case of COVID-19, as of March 18, about 80% of deaths in the United States were among those 65 years and older (Centers for Disease Control and Prevention [CDC], Citation2020b).
Travel and tourism are other key contributors to the emergence of pandemics in the United States and internationally (Neiderud, Citation2015). Epidemics spread through major travel destinations in both compact and sprawling cities (Alirol et al., Citation2011). SARS, for instance, emerging as a pandemic in 2003, originated from the wildlife markets in Guangdong (China) and spread rapidly throughout the world with international travel (WHO, Citation2007). Another example is the Ebola virus disease outbreak in 2014 in Western Africa. Guinea and Sierra Leone were the centers of this regional epidemic due to high connectivity and substantial cross-border traffic, even though 64% and 60% of their populations were living in low-density rural areas (WHO, Citation2014). Global travel is only expected to expand, and research points to the role of governments and organizations such as WHO to be fast and efficient in taking necessary preventive measures before the epidemic gets out of control (Neiderud, Citation2015).
Finally, the most effective way to slow the spread of highly contagious diseases is to minimize human-to-human contact through different measures of social distancing. Social distancing can be implemented by governments at the local and state levels through one or a combination of interventions, including the closure of schools, bars, restaurants, and any social or sporting events; sick leave; work-from-home policies; splitting shifts to reduce workplace interactions; sheltering in place; and travel/trade bans (Chu et al., Citation2017). These interventions are critical to stopping the disease’s outbreak, but quick and efficient actions by local, state, and federal governments at early stages before the epidemic gets out of control are even more critical (Katz et al., Citation2019). This is another source of spatial variation of the disease spread because state and local governments across the United States take different actions at different times, which could make a difference in disease outcomes.
These factors could be applied to both compact and sprawling areas, which makes any theoretical conclusion about the role of density in disease pandemic complex and unclear. Still, the role of density in the spread and severity of highly contagious diseases has not been rigorously studied. Our study seeks to address this gap and investigate the relationship between density and the spread and deadliness of COVID-19 in the United States. We use the term COVID-19 to refer to both the virus itself and the disease it causes.1
Conceptual Framework and Research Design
Our outcome variables are the rates of COVID-19 confirmed cases and mortality per 10,000 population. There are mediating variables between density and COVID-19 mortality rates, such as infection rates and hospitalization rates. There are confounding influences, such as the age distribution and income levels. There are moderating influences, such as the number of intensive care unit (ICU) beds per capita, that affect the probabilities of infections becoming fatal. The selection of explanatory variables to predict the two outcome variables is based on common sense, theory, and early reports on the incidence of the virus (CDC, Citation2020b). Different variables are tested for significance as predictors of the virus rate and mortality rate, whereas our final model only includes the independent variables that have a statistically significant relationship to the outcome variables. presents the definition and descriptive statistics for all variables investigated in our model. We understand that rates of infection and mortality are recorded at the individual’s place of residence, not at the place of occurrence. Thus, we would expect a direct casual pathway from county-level measures of density to county-level measures of COVID-19 mortality. Our hypothesis is that denser counties have better health care infrastructure that is more prepared to respond to the pandemic and thus reduce the severity and mortality rate of the pandemic. We also expect an indirect causal pathway from density to the COVID-19 mortality rates. Our conceptual framework is based on the hypothesis that density leads to more exposure to the virus and more exposure leads to higher rates of infection, which, in turn, results in higher rates of mortality, controlling for other variables.
Table 1 Variables used to explain COVID-19 per capita death rate (N = 913).
The complex causal chain described above is best modeled with structural equation modeling (SEM). Using SEM analysis, we can investigate the relationship between county density and COVID-19 mortality rates, both directly and indirectly, via COVID-19 infection rates as the mediator. For more detailed explanation of SEM, please see Technical Appendix 1. The SEM model in this study was estimated for a total of 913 metropolitan counties with no missing data as of May 25, 2020, using Amos 22 software. Technical Appendix 2 shows the location of these metropolitan counties in the United States. Working with complete data sets allowed us to compute modification indices, which, in turn, allowed us to identify and include missing links in the model and improve the model’s goodness of fit. Basically, variables were included in the model and causal links were added if one of two conditions were met: Variables and relationships were either theoretically or statistically significant.
The county is the unit of analysis in this study. This is the smallest geographic unit for which consistent virus infection and death data are available and is certainly less likely to suffer from aggregation bias than would an analysis at the state or metropolitan area level. Virus spread occurs with people’s interactions and movements, and peoples’ movements (travel) typically extend beyond their immediate neighborhoods. Data from the National Household Travel Survey (U.S. Department of Transportation, Citation2017) show that about 87% of daily trips in the United States take place in personal vehicles, and the average driver drives about 29 miles per day. County is the best geographical unit to capture the virus spread as the outcome of these movements. Density could also be related to the pandemic spread in smaller geographies such as the density of occupants in living units, which could be the subject of future studies once COVID-19 data are available for smaller spatial units. Finally, we tested the possibility of spatial dependence among cases, or spatial autocorrelation, and found no significant evidence on the spatial clustering of cases (see Technical Appendix 1).
Outcome Variables
Our outcome variables are the natural log of confirmed cases of coronavirus per 10,000 population and natural log of confirmed deaths per 10,000 population due to COVID-19, both at the county level. An infection is confirmed when an individual tests positive for the virus using an approved test administered and reported by a health professional. A death is confirmed when an individual who has tested positive for the virus dies of a complication or, in some counties, has COVID symptoms and dies of a complication. We use rates and SEM with linear regression models because the number of cases of the virus now far exceeds the “rare event” criterion of count models such as Poisson regression and negative binomial regression.
According to the CDC Portal (CDC, Citation2020c), the highest infection counts since the beginning of the pandemic in the United States occurred on April 6, 2020. Since April 21, we have observed an overall decreasing trend in COVID-19-related deaths. These trends show signs of flattening of the pandemic curve (for the first wave). We performed sensitivity analyses by estimating the models multiple times since March 23 with updated COVID-19 data and obtained very similar results in terms of the signs and relative magnitudes of the relationships.
We log-transformed both outcome variables to make them closer to normal distributions because both of them vary exponentially (see Technical Appendix 3). As a result, 252 counties from our sample of 1,165 counties were eliminated when we logged the death rate, the downstream outcome variable in our structural equation model. However, it improved the model’s goodness of fit. Note that we estimated a model with New York City and New York State in our main analysis but dropped them from the sample in a sensitivity analysis in Technical Appendix 4. Our rationale for dropping these cases in the Appendix is one of face validity. This one city and one state contributed to 23% and 32%, respectively, of the total COVID-19 deaths in our data set.
Explanatory Variables
Our explanatory variables control for the major determinants of a pandemic outbreak, such as socioeconomic characteristics, health care facilities, county density, and metropolitan population size. Explanatory variables came from various sources. We downloaded data on population, sex, age, and race/ethnicity from the American Community Survey (ACS) 2017 (5-year estimates) and computed percentage of the population that is Black, percentage of adults with some education beyond high school, and the natural log of metropolitan population. We also tested the number of days since the first positive test was confirmed in each county. The data again come from the Novel Coronavirus Visual Dashboard developed by Johns Hopkins University (Dong et al., Citation2020). The first reported coronavirus case in the United States was in King County (WA) on January 22, 2020.
Our analyses control for a number of variables related to health care facilities. We obtained these variables from County Health Rankings and Roadmaps, which is a collaboration between the Robert Wood Johnson Foundation and the University of Wisconsin Population Health Institute (Citation2020). From the same data source, we obtained the county-level average daily concentration of fine particulate matter (PM2.5) as our measure of air pollution. In addition, we tested the number of ICU beds per 10,000 population from a Kaiser Health News (Citation2019) analysis of hospital cost reports filed with the Centers for Medicare & Medicaid Services.
The explanatory variable of greatest interest is a measure of county compactness. We summed the county population and employment and divided it by the land area to obtain activity density that accounts for both employment and population concentrations in the county. The county population data come from the ACS 2017 (5-year estimates), and the county employment data come from the Longitudinal Employer–Household Dynamics (LEHD) 2017; both data sources are compiled and released by the U.S. Census Bureau (Citation2020a, Citation2020b).
Activity density is distinct from crowding or overcrowding. Crowding is defined as a large number of persons gathered closely together. Even at high activity densities, crowding is confined to specific venues such as transit vehicles, bars and restaurants, schools, sports events, airports, downtown sidewalks, and so forth. Elsewhere (and even in these settings), people can maintain and usually do maintain some social distance in their desire to maintain personal space. Notwithstanding evening news reports of crowding on beaches and at protest events, we suspect crowding is the exception in this period of social distancing. Moreover, by this definition, crowding may occur even at low activity densities at all of the venues listed above. We did test one formal measure of crowding, the percentage of households with more than one person per room from the ACS, and found it has no relationship to the virus rate. Instead, we include in our model a specific measure of social distancing, “staying at home,” which is defined as not having any home-based trip that is more than 1 mile away from the place of residence.
Our model includes two measures of connectivity to account for the degree of connectivity between counties in the same region (internal connectivity) and the degree of connectivity to the outside world (external connectivity). Both measures slightly correlate with activity density, with correlation coefficients of 0.327 and 0.128, respectively. We cast metropolitan size measured in terms of population as a measure of connectivity of counties within the metropolitan area. This aligns with the definition of metropolitan areas. According to the U.S. Census Bureau, a metropolitan area consists of a densely populated urban core and surrounding counties that are economically and socially linked to each other and the core (U.S. Census Bureau, Citationn.d.). Metropolitan population is a regional variable that accounts for the context of counties beyond their boundaries and as a proxy for counties’ social, economic, and commuting relationships with the neighboring counties within the same metropolitan area. Metropolitan population has been used in several previous county-level studies to capture higher needs for travel (and commuting) between counties in the same metropolitan area and also longer trips (vehicle miles traveled) in studying outcomes such as traffic fatalities, air quality, and life expectancy (e.g., Ewing et al., Citation2016; Hamidi et al., Citation2018).
Per a suggestion from an anonymous reviewer, we came up with a more direct measure of connectivity for metropolitan areas. Using the Smart Location Database of the U.S. Environmental Protection Agency (U.S. EPA Smart Growth Program, Citation2020), we computed a measure of destination accessibility for all metropolitan areas in our sample. The measure is the average number of jobs accessible within a 45-min travel time by automobile in 2010. This covers work and nonwork trip accessibility: A grocery store’s employees, for example, would be included in the total jobs reachable within that travel time. The simple correlation between this variable and metropolitan population size is 0.95. The Smart Location Database uses data that are now 10 years old, which is one reason for using metropolitan population as a proxy for connectivity within a metropolitan area instead of the more direct measure. The other reason is that connections may take many forms not captured by job accessibility. For example, a social–recreational trip or a phone call to a friend or business associate that ultimately ends with face-to-face contact is not well represented by job accessibility metrics.
We also account for the degree of connectivity to the outside world using annual enplanements per 10,000 population. The raw data for passenger (enplanement) rate comes from the Air Carrier Activity Information System, a Federal Aviation Administration (Citation2018) database that contains revenue passenger boarding data. We summed enplanements at all commercial service airports within a metropolitan area and computed the rate per 10,000 population.
In addition, our model controls for the level of adherence to social distancing advisories by including a variable that measures the average percentage of the population staying at home since the first case was confirmed in each county. This variable is developed and reported on a daily basis by the University of Maryland based on location data from multiple sources such as smartphones and vehicle sensors to capture person and vehicle movements. More information is available via the University of Maryland’s COVID-19 Impact Analysis Platform (Maryland Transportation Institute, Citation2020).
Finally, we developed a measure of the COVID-19 testing rate to account for testing availability. We collected the total number of people tested for COVID-19 in each state from the COVID Tracking Project (CTP, Citation2020) website and computed the testing rate per 10,000 population. Note that these data are only available at the state level. For most states, CTP obtains the data directly from state public health authorities. For a few states such as California and New York, where statewide information is not available, the CTP is using other reporting tools such as trusted news sources, interviewing officials, and news conferences. Because testing is usually a statewide function, we expect more variation between states than within states.
Data and Methodological Limitations
We acknowledge four limitations related to the data and methodology. First, the COVID-19 pandemic is a rapidly evolving situation, and the number of deaths and infections grow by the day. As our title says, this study presents early findings. Although we have observed consistent signs and magnitudes of relationships between variables in our modeling between March 23 and May 25, more research is needed to investigate the reliability of these findings over time. In the same line, we recommend a longitude time-series analysis to explore the impact of density on the pandemic growth curves of different counties.
Second, although the measure of COVID-19 death rates is fairly straightforward, the number of confirmed infections largely depends on the number of individuals being tested; currently, there is a nationwide shortage of testing capacity. As a result, clinicians follow CDC guidelines on how to “prioritize” testing patients with COVID-19 symptoms (CDC, Citation2020a). We only had access to the statewide testing rate, which we include in our models. There are likely to be local variations in the rate of testing that will have to be captured in future studies once data are available at the local level. In addition, increasing testing capacity will allow clinicians to conduct COVID-19 testing for a wider group of patients. Parenthetically, there are reports that some people dying at home may have the virus but are not counted in the official totals. We therefore acknowledge this as another possible limitation but are unclear about its effects on our results. That is, it is unclear whether deaths are more likely to be undercounted in dense areas.
Third, the sample in this study is limited to U.S. metropolitan counties and therefore our findings are not generalizable to other counties. More than 75% of metropolitan counties are urban and thus our sample is more representative of urban and suburban counties and less representative of rural counties. By 2010, 84% of the U.S. population lived in metropolitan areas. We further acknowledge a potential urban bias by our inclusion only of counties with one or more COVID-related deaths (see Technical Appendix 3).
Fourth, the dynamic of pandemic spread and mortality is complex, and there are potential contributing factors that are not accounted for in this study due to the lack of data availability. Health-related pre-existing conditions such as obesity, diabetes, asthma, cardiovascular disease, and hypertension most likely contribute to the severity of COVID-19 (CDC, Citation2020b) and should be studied at a finer geographic scale and with a subsample of patients. Pre-existing condition data at the county level are largely modeled variables based on the raw data from health surveys, with income and other socioeconomic characteristics used as part of the modeling. It is for this reason that they were not included in our models. Many other variables for which we do have current data, such as transit ridership, could also contribute to the spread of the virus (Harris, Citation2020).
The Role of Density in COVID-19 Spread and Mortality Rates: Empirical Evidence From the National Investigation
presents the correlation between each of the explanatory variables and outcome (both logged and unlogged) variables. The simple correlation between the natural logarithm of activity density and outcome variables shows that higher density is correlated with higher infection and mortality rates (correlation coefficients of 0.280 and 0.196, respectively). However, these relationships change with the addition of confounding factors in the SEM model.
Table 2 Pearson correlation between explanatory variables and confirmed virus and death rates.
shows the best fit model from our SEM analysis. As explained in our conceptual framework, the density variable, socioeconomic factors, and the health care infrastructure have direct paths to the COVID-19 death rate but also affect it indirectly through the COVID-19 infection rate as the mediator. The best fit model has an acceptable low chi-square relative to the degrees of freedom and the insignificant (>.05) p value, which are indicators of a good model fit. presents the direct effects of explanatory variables on outcome variables, and presents the direct, indirect, and total effects of county-level density and other variables on the COVID-19 death rate.
Figure 1. Causal path diagram for COVID-19 death rate in terms of county density and other variables (correlational arrows among explanatory variables are not shown for the sake of simplicity and clarity).
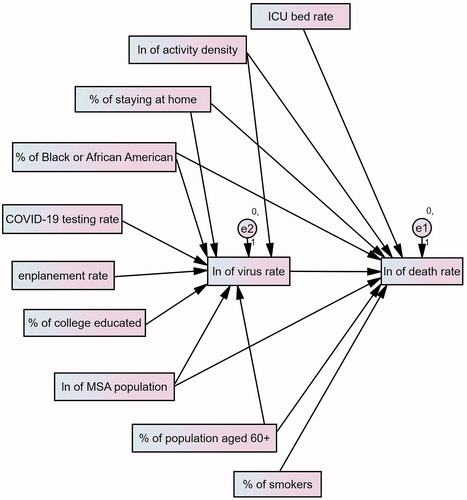
Table 3 Direct effects of density, socioeconomic, and health care characteristics on COVID-19 infection and mortality rates.
Table 4 Direct, indirect, and total effects of the county-level density and other variables on COVID-19 mortality rate.
County Density, Metropolitan Population, and the COVID-19 Infection Rate
We begin with the variables of greatest interest: county activity density and metropolitan area population. Our findings indicate that the infection rate increases with activity density, but the relationship is not statistically significant. This runs counter to our initial expectations. One possible reason for the insignificant relationship is that density plays two conflicting roles, which could cancel each other out. On the one hand, density increases contact with other people and likelihood of transmission of diseases. On the other hand, density could facilitate the implementation of social distancing orders due to better home delivery services and higher perceived susceptibility to the threat and therefore more precautionary behaviors. According to Gallup polls, residents of dense places are more likely to practice basic social distancing than their counterparts in suburban and exurban areas (Saad, Citation2020).
On the other hand, larger metropolitan areas have significantly higher rates of infection. In fact, metropolitan population has one of the most significant relationships of all explanatory variables with the infection rate. Pandemics spread with the movement and interaction of people, and large metropolitan areas are where most of these movements and interactions occur. Counties in metropolitan areas share transportation and commuting patterns, or “movement of people,” between counties and within the metropolitan areas (Ratcliffe et al., Citation2016), which is an ideal situation for the spread of pandemics. These findings suggest the role of connectivity versus density on the pandemic spread as a potential direction for future research.
County Density, Metropolitan Population, and the COVID-19 Mortality Rate
We find that dense counties have significantly lower death rates. This is possibly due to better health care systems in dense counties. On the other hand, larger metropolitan areas (measured in terms of population) have significantly higher COVID-19 death rates. These results suggest that the pandemic outbreak is more about connectivity than density. The pandemic spread is facilitated more by the connectivity of a major urban hub to the surrounding geographic units than by the density of the hub (county in our study). This finding is supported by the existing evidence on the major role of connected cities in the spread of pandemics (Alirol et al., Citation2011). The megacities and megaregions (either compact or sprawling) that are superconnected are the incubators of pandemic outbreaks (Neiderud, Citation2015).
Note that our model controls for two measures of connectivity: connectivity within the metropolitan area (with metropolitan population as a proxy) and connectivity to the outside world (through the enplanement rate). We find that counties with higher enplanement rates have significantly lower infection rates. This is unexpected. However, according to the literature and our data, the enplanement rate causes the pandemic to reach globally connected cities more quickly. The reason this does not necessarily lead to higher infection rates could be that these cities adopted travel restriction policies very early in the pandemic (Neiderud, Citation2015). In other words, global connectivity may determine the advent of the pandemic, but once travel restrictions have been adopted, infections due to international travel may drop off. Considering that this is a cross-sectional study and does not account for the changes over time, we recommend future studies further investigate these relationships over time though a longitudinal research design.
Other Determinants of the COVID-19 Infection and Death Rates
We find significant and expected associations between most socioeconomic factors and the COVID-19 infection and mortality rates. Counties with a higher percentage of Black population have significantly higher infection rates. Likewise, counties with a higher percentage of adults with some education beyond high school have significantly lower COVID-19 infection rates.
These findings are consistent with the literature that reports minorities are more likely to become infected during pandemics (Quinn & Kumar, Citation2014) due to a higher prevalence of underlying conditions such as hypertension, diabetes, and obesity. They also may have less recourse to workplace policies that enable social distancing. There are multiple reasons for having lower COVID-19 infection rates among counties with a higher percentage of educated individuals. In principle, workers with higher education are less likely to rely on public transportation, more able to work remotely, and more likely to have a better understanding of the virus and take shelter-in-place restrictions seriously (Lowcock et al., Citation2012).
We also find that counties with a higher percentage of the population over age 60 have higher mortality rates. Indeed, this variable is the most significant predictor of the mortality rate other than the infection rate itself. This may be due to their weaker immune systems (K. Liu et al., Citation2020). In addition, counties with a higher percentage of smokers have higher mortality rates from COVID-19, at the .10 significance level. This is consistent with the existing research showing a history of smoking is a predictor of COVID-19 severity in Chinese patients (W. Liu et al., Citation2020). Most of the deaths associated with COVID-19 are respiratory related.
As expected, the death rate significantly declines with number of ICU beds per 10,000 population. Counties with a higher number of ICU beds are less likely to be overwhelmed by COVID-19 patients in need of intensive care. We find that counties with a higher percentage of residents staying at home have higher infection and mortality rates. Considering that this is a cross-sectional study, these findings are consistent with previous studies in the United States, Australia, the United Kingdom, Canada, and Europe that find residents in areas with more severe pandemics have higher perceived susceptibility to contagious diseases such as SARS and swine flu and, in turn, show more precautious behaviors in adhering to social distancing recommendations such as avoiding public gatherings, not making nonessential trips, and avoiding public transit (Barr et al., Citation2008; Blendon et al., Citation2004; Cava et al., Citation2005). Finally, the statewide testing rate is the most significant predictor of the county virus infection rate. This makes sense because estimates suggest that 25% to 50% of people with COVID-19 are unaware they have the virus. Its high significance level may also be a result of treating counties in the same state as independent, when in fact they share the testing rate in this multilevel study.
Sensitivity Analyses
Our most important finding is that density is unrelated to confirmed virus infection rates and inversely related to confirmed virus death rates, after controlling for other variables. This finding runs counter to the conventional wisdom and to the very few (unpublished) reports on this topic (Wheaton & Thompson, Citation2020). Therefore, we conducted two sets of sensitivity analyses, one with different samples and the other one with different independent variables, to test the reliability of our findings. For the sake of simplicity and familiarity, we used ordinary least squares regression in these sets of analyses. The log-transformed version of the death rate is used as the dependent variable in our sensitivity analyses because the death rate is a more reliable measure of COVID-19 incidence than is the infection rate, which varies differentially with the testing rate. The results are presented in Technical Appendix 4.
There are two takeaways from these sensitivity tests. First, the results did not change with the exclusion of New York City or New York State. Second, the results did not change with the changes in independent variables. One might ask why our findings are in disagreement with the very few existing analyses such as Wheaton and Thompson’s (Citation2020) that show higher density is associated with more COVID-19 deaths. The reason is that this other study used the number of deaths rather than the per capita death rate in their regression analyses. We obtained a result similar to theirs when we changed our dependent variable from a per capita rate to total death counts. However, as Wheaton and Thompson (Citation2020) conclude, the per capita rate is the best outcome variable for studying the COVID-19 pandemic. In addition, we include many more control variables than Wheaton and Thompson (Citation2020) and use SEM rather than ordinary least squares regression, both of which represent refinements.
Concluding Remarks and Lessons for Planners
The new coronavirus (COVID-19) is recognized as the most serious public health threat since the 1918 influenza pandemic, and the impacts of density on the COVID-19 pandemic are at the center of current dialogues in PLANETNEW,2 public opinion, and planning practice. News outlets blame density for the rapid spread of COVID-19 in New York City and refer to suburban living as the United States’ “secret weapon” against coronavirus (see, for example, Olsen, Citation2020; Rosenthal, Citation2020). Accordingly, the State of California’s pioneering statewide plan for infill and transit-oriented housing development is increasingly criticized for potentially facilitating the spread of future viruses (D. Kahn, Citation2020). These concerns and assumptions, in the absence of empirical evidence, would challenge the foundation of modern city planning: that density at least in some places is found to be a positive counter to sprawl (see Park et al., Citation2020).
It is a general assumption that density is associated with higher rates of transmission, infection, and mortality from highly contagious diseases such as COVID-19 (Olsen, Citation2020; Rosenthal, Citation2020). Our national analysis of the relationship between density and the COVID-19 infection and mortality rates for 913 metropolitan counties in the United States suggests quite the opposite.
We are the first to admit that this study is the first word, not the last, on the relationship between urban form and the COVID-19 virus. Many will follow later in the course of the pandemic when more definitive results are possible. Many will be longitudinal, which will permit stronger statements of causality than does this cross-sectional study. Some may be at smaller geographic scales, which will allow planners to reach conclusions about neighborhood design (as they have in connection with physical activity and obesity).
In this early and preliminary study, we find that density is not linked to rates of COVID-19 infection, after controlling for metropolitan area population, socioeconomics, and health care infrastructure in U.S. counties. Surprisingly, we find that COVID-19 death rates are lower in denser counties and higher in less dense counties, at a high level of statistical significance. This is likely due to better access to health care facilities and easier management of social distancing interventions such as sheltering in place.
On the other hand, we find metropolitan population to have the third most significant relationship to COVID-19 death rates. These findings suggest that connectivity between counties matters more than county density for pandemic spread and lethality. The more connected the places (either compact or sprawling) in large metropolitan areas are, the harder they are hit by the pandemic. It could start with the major urban core and eventually spread to lower density suburban and rural areas. No place is immune from the spread, and if we look at the rates rather than counts during the 1918 pandemic, rural/low-density areas were hit harder than cities (Parmet & Rothstein, Citation2018).
The fact that connectivity is a significant predictor of COVID-19 infection and death rates calls for more in-depth research on measuring urban connectivity and its impact on pandemic spread. Future studies could contribute to the conversation by developing and using more sophisticated measures of internal connectivity, such as location-based social networks (Andris, Citation2016). In fact, the degree of contact tracing that some countries are currently undertaking could eventually result in more reliable and valid data and provide opportunities for developing regional connectivity measures at the time of a pandemic.
Our study suggests that the planner’s role in addressing the pandemic crisis is not necessarily through a change in paradigm because we find no evidence that sprawling areas are more immune to the pandemic or that sprawling areas experience lower death rates. Indeed, we find that pandemics are deadlier in low-density areas that have less access to quality health care. Our findings suggest that planners should continue to practice and advocate for compact places rather than sprawling ones due to several environmental, transportation, health, and economic benefits of compact development confirmed by dozens of empirical studies.
The fact that density is unrelated to confirmed virus infection rates and inversely related to confirmed virus death rates is important, unexpected, and profound. It has implications for community design, regional planning, transportation expenditures, urban redevelopment, tax policy, congestion pricing, smart growth, affordable housing, and nearly every other front-burner issue important to planners. It counters a narrative that, absent data and analysis, would challenge the foundation of modern city planning that density at least in some places (urban and suburban centers) is a positive counter to sprawl (Park et al., Citation2020).
The role of planners and local governments in addressing pandemic outbreaks is crucial, but not through advocating for the low density and suburban types of development. Rather, planners and local governments play a key role in adopting measures tailored to their community for more effective implementation of social distancing measures and to mitigate the adverse impacts on businesses, households, and citizens.
Research Support
This research was supported by the Bloomberg American Health Initiative at the Johns Hopkins Bloomberg School of Public Health.
Supplemental Material
Supplemental data for this article can be found on the publisher’s website.
Technical Appendix
Download PDF (13.6 MB)Additional information
Funding
Notes on contributors
Shima Hamidi
SHIMA HAMIDI ([email protected]) is Bloomberg assistant professor of public health in the Bloomberg School of Public Health at Johns Hopkins University.
Sadegh Sabouri
SADEGH SABOURI ([email protected]) is a PhD student in the Department of City and Metropolitan Planning at the University of Utah.
Reid Ewing
REID EWING ([email protected]) is distinguished professor of city and metropolitan planning at the University of Utah.
Notes
1 Viruses, and the diseases they cause, may have different names. For example, HIV is the virus that causes the disease AIDS. People often know the name of a disease, such as measles, but not the name of the virus that causes it (rubeola). Here we use the same name for both virus and disease (WHO, Citation2019).
2 PLANETNEW is a closed Google listserv shared by planning faculty in the U.S and internationally.
References
- Alirol, E., Getaz, L., Stoll, B., Chappuis, F., & Loutan, L. (2011). Urbanisation and infectious diseases in a globalised world. The Lancet Infectious Diseases, 11(2), 131–141. https://doi.org/10.1016/S1473-3099(10)70223-1
- Andris, C. (2016). Integrating social network data into GISystems. International Journal of Geographical Information Science, 30(10), 1–2031. https://doi.org/10.1080/13658816.2016.1153103
- Barr, M., Raphael, B., Taylor, M., Stevens, G., Jorm, L., Giffin, M., & Lujic, S. (2008). Pandemic influenza in Australia: Using telephone surveys to measure perceptions of threat and willingness to comply. BMC Infectious Diseases, 8, 117–130. https://doi.org/10.1186/1471-2334-8-117
- Blendon, R. J., Benson, J. M., DesRoches, C. M., Raleigh, E., & Taylor-Clark, K. (2004). The public’s response to severe acute respiratory syndrome in Toronto and the United States. Clinical Infectious Diseases: An Official Publication of the Infectious Diseases Society of America, 38(7), 925–931. https://doi.org/10.1086/382355
- Blumenshine, P., Reingold, A., Egerter, S., Mockenhaupt, R., Braveman, P., & Marks, J. (2008). Pandemic influenza planning in the United States from a health disparities perspective. Emerging Infectious Diseases, 14(5), 709–715. https://doi.org/10.3201/eid1405.071301
- Briffault, R. (2002). Facing the urban future after September 11, 2001, 34 URB. LAW. 563 (2002).
- Cascella, M., Rajnik, M., Cuomo, A., Dulebohn, S. C., & Di Napoli, R. (2020). Features, evaluation and treatment coronavirus (COVID-19). In StatPearls [Internet]. StatPearls Publishing.
- Cava, M. A., Fay, K. E., Beanlands, H. J., McCay, E. A., & Wignall, R. (2005). Risk perception and compliance with quarantine during the SARS outbreak. Journal of Nursing Scholarship : An Official Publication of Sigma Theta Tau International Honor Society of Nursing, 37(4), 343–347. https://doi.org/10.1111/j.1547-5069.2005.00059.x
- Centers for Disease Control and Prevention (CDC). (2020a). Criteria to guide evaluation and laboratory testing for COVID-19. https://www.cdc.gov/coronavirus/2019-nCoV/hcp/clinical-criteria.html
- Centers for Disease Control and Prevention (CDC). (2020b). Severe outcomes among patients with Coronavirus disease 2019 (COVID-19): United States, February 12–March 16, 2020. Morbidity and Mortality Weekly Report, 69, 343–346. https://doi.org/10.15585/mmwr.mm6912e2
- Centers for Disease Control and Prevention (CDC). (2020c). Coronavirus disease 2019 (COVID-19): Cases in the U.S. https://www.cdc.gov/coronavirus/2019-ncov/cases-updates/cases-in-us.html
- Chowell, G., Bettencourt, L. M., Johnson, N., Alonso, W. J., & Viboud, C. (2008). The 1918–1919 influenza pandemic in England and Wales: Spatial patterns in transmissibility and mortality impact. Proceedings of the Royal Society B: Biological Sciences, 275(1634), 501–509. https://doi.org/10.1098/rspb.2007.1477
- Chu, S., Swarup, S., Chen, J., Marathe, A. (2017). A comparison of targeted layered containment strategies for a flu pandemic in three US cities. In Proceedings of the 16th Conference on Autonomous Agents and MultiAgent Systems (pp. 1499–1501). International Foundation for Autonomous Agents and Multiagent Systems.
- The COVID Tracking Project (CTP). (2020, May 25). COVID-19 data API. https://covidtracking.com/
- Dong, E., Du, H., & Gardner, L. (2020). An interactive web-based dashboard to track COVID-19 in real time. The Lancet Infectious Diseases, 20(5), 533–534. https://doi.org/10.1016/S1473-3099(20)30120-1
- Ewing, R., & Hamidi, S. (2014). Measuring urban sprawl and validating sprawl measures. National Institutes of Health and Smart Growth America.
- Ewing, R., & Hamidi, S. (2015a). Compactness versus sprawl: A review of recent evidence from the United States. Journal of Planning Literature, 30(4), 413–432. https://doi.org/10.1177/0885412215595439
- Ewing, R., & Hamidi, S. (2015b). Urban sprawl as a risk factor in motor vehicle occupant and pedestrian fatalities: Update and refinement. Transportation Research Record: Journal of the Transportation Research Board, 2513, 40–47. https://doi.org/10.3141/2513-05
- Ewing, R., Hamidi, S., & Grace, J. B. (2016). Urban sprawl as a risk factor in motor vehicle crashes. Urban Studies, 53(2), 247–266. https://doi.org/10.1177/0042098014562331
- Ewing, R., Meakins, G., Hamidi, S., & Nelson, A. C. (2014). Relationship between urban sprawl and physical activity, obesity, and morbidity: Update and refinement. Health & Place, 26, 118–126. https://doi.org/10.1016/j.healthplace.2013.12.008
- Federal Aviation Administration (2018). Enplanements at all commercial service airports (by rank). https://www.faa.gov/airports/planning_capacity/passenger_allcargo_stats/passenger/
- Galster, G., & Cutsinger, J. (2007). Racial settlement and metropolitan land-use patterns: Does sprawl abet black-white segregation? Urban Geography, 28(6), 516–553. https://doi.org/10.2747/0272-3638.28.6.516
- Garrett, T. A. (2010). Economic effects of the 1918 influenza pandemic: Implications for a modern-day pandemic. Working paper CA0721.2007. Federal Reserve Bank of St. Louis. https://www.stlouisfed.org/∼/media/files/pdfs/community-development/research-reports/pandemic_flu_report.pdf
- Glaeser, E. L. (2011). Cities, productivity, and quality of life. Science (New York, N.Y.), 333(6042), 592–594. https://doi.org/10.1126/science.1209264
- Glaeser, E. L., & Shapiro, J. M. (2002). Cities and warfare: The impact of terrorism on urban form. Journal of Urban Economics, 51(2), 205–224. https://doi.org/10.1006/juec.2001.2262
- Hamidi, S., Ewing, R., Tatalovich, Z., Grace, J. B., & Berrigan, D. (2018). Associations between urban sprawl and life expectancy in the United States. International Journal of Environmental Research and Public Health, 15(5), 861. https://doi.org/10.3390/ijerph15050861
- Hamidi, S., & Zandiatashbar, A. (2019). Does urban form matter for innovation productivity? A national multi-level study of the association between neighbourhood innovation capacity and urban sprawl. Urban Studies, 56(8), 1576–1594. https://doi.org/10.1177/0042098018767002
- Hamidi, S., Zandiatashbar, A., & Bonakdar, A. (2019). The relationship between regional compactness and regional innovation capacity (RIC): Empirical evidence from a national study. Technological Forecasting and Social Change, 142, 394–402. https://doi.org/10.1016/j.techfore.2018.07.026
- Harris, J. E. (2020). The subways seeded the massive coronavirus epidemic in New York City. National Bureau of Economic Research Working Paper w27021.
- Kahn, D. (2020, March 27). California saw dense housing near transit as its future. What now? Politico. https://www.politico.com/states/california/story/2020/03/27/california-saw-dense-housing-near-transit-as-its-future-what-now-1269263
- Kahn, M. (2001). Does sprawl reduce the black/white housing consumption gap?. Housing Policy Debate, 12(1), 77–86. https://doi.org/10.1080/10511482.2001.9521399
- Kaiser Health News. (2019). Millions of older Americans live in counties with no ICU beds as pandemic intensifies: Analysis of hospital cost reports filed to the Centers for Medicare & Medicaid Services. https://khn.org/news/as-coronavirus-spreads-widely-millions-of-older-americans-live-in-counties-with-no-icu-beds/
- Kao, C.-L., Chan, T.-C., Tsai, C.-H., Chu, K.-Y., Chuang, S.-F., Lee, C.-C., Li, Z.-R T., Wu, K.-W., Chang, L.-Y., Shen, Y.-H., Huang, L.-M., Lee, P.-I., Yang, C., Compans, R., Rouse, B. T., & King, C.-C. (2012). Emerged HA and NA mutants of the pandemic influenza H1N1 viruses with increasing epidemiological significance in Taipei and Kaohsiung, Taiwan. PLoS One, 7(2), e31162. https://doi.org/10.1371/journal.pone.0031162
- Kargon, R., & Molella, A. (2004). The city as communications net: Norbert Wiener, the atomic bomb, and urban dispersal. Technology and Culture, 45(4), 764–777. https://doi.org/10.1353/tech.2004.0190
- Katz, R., Vaught, A., & Simmens, S. J. (2019). Local decision making for implementing social distancing in response to outbreaks. Public Health Reports (Washington, D.C. : 1974), 134(2), 150–154. https://doi.org/10.1177/0033354918819755
- Kumar, S., Quinn, S. C., Kim, K. H., Daniel, L. H., & Freimuth, V. S. (2012). The impact of workplace policies and other social factors on self-reported influenza-like illness incidence during the 2009 H1N1 pandemic. American Journal of Public Health, 102(1), 134–140. https://doi.org/10.2105/AJPH.2011.300307
- Liu, K., Chen, Y., Lin, R., & Han, K. (2020). Clinical features of COVID-19 in elderly patients: A comparison with young and middle-aged patients. Journal of Infection, 80(6), e14–e18. https://doi.org/10.1016/j.jinf.2020.03.005
- Liu, W., Tao, Z. W., Lei, W., Ming-Li, Y., Kui, L., Ling, Z., & Ming, Y. (2020). Analysis of factors associated with disease outcomes in hospitalized patients with 2019 novel coronavirus disease. Chinese Medical Journal, 133(9), 1032–1038. https://doi.org/10.1097/CM9.0000000000000775
- Lowcock, E. C., Rosella, L. C., Foisy, J., McGeer, A., & Crowcroft, N. (2012). The social determinants of health and pandemic H1N1 2009 influenza severity. American Journal of Public Health, 102(8), e51–e58. https://doi.org/10.2105/AJPH.2012.300814
- Maryland Transportation Institute. (2020). University of Maryland COVID-19 impact analysis platform. https://data.covid.umd.edu
- Mills, C. E., Robins, J. M., & Lipsitch, M. (2004). Transmissibility of 1918 pandemic influenza. Nature, 432(7019), 904–906. https://doi.org/10.1038/nature03063
- Neiderud, C. J. (2015). How urbanization affects the epidemiology of emerging infectious diseases. Infection Ecology & Epidemiology, 5(1), 27060. https://doi.org/10.3402/iee.v5.27060
- Nelson, A. C., & Sanchez, T. W. (2005). The effectiveness of urban containment regimes in reducing exurban sprawl. Disp - the Planning Review, 41(160), 42–47. https://doi.org/10.1080/02513625.2005.10556905
- Nguyen, D. (2010). Evidence of the impacts of urban sprawl on social capital. Environment and Planning B: Planning and Design, 37(4), 610–627. https://doi.org/10.1068/b35120
- Nishiura, H., & Chowell, G. (2008). Rurality and pandemic influenza: Geographic heterogeneity in the risks of infection and death in Kanagawa, Japan (1918–1919). The New Zealand Medical Journal, 121, 18–27.
- Olsen, H. (2020, March 19). The United States might have a secret weapon against coronavirus. The Washington Post. https://www.washingtonpost.com/opinions/2020/03/19/united-states-might-have-secret-weapon-against-coronavirus/
- Park, K., Ewing, R., Sabouri, S., Choi, D. A., Hamidi, S., & Tian, G. (2020). Guidelines for a polycentric region to reduce vehicle use and increase walking and transit use. Journal of the American Planning Association, 86(2), 236–249. https://doi.org/10.1080/01944363.2019.1692690
- Parmet, W. E., & Rothstein, M. A. (2018). The 1918 influenza pandemic: Lessons learned and not. American Journal of Public Health, 108(11), 1435–1436.
- Quinn, S. C., & Kumar, S. (2014). Health inequalities and infectious disease epidemics: A challenge for global health security. Biosecurity and Bioterrorism: Biodefense Strategy, Practice, and Science, 12(5), 263–273. https://doi.org/10.1089/bsp.2014.0032
- Quinn, S. C., Kumar, S., Freimuth, V. S., Musa, D., Casteneda-Angarita, N., & Kidwell, K. (2011). Racial disparities in exposure, susceptibility, and access to health care in the US H1N1 influenza pandemic. American Journal of Public Health, 101(2), 285–293. https://doi.org/10.2105/AJPH.2009.188029
- Ratcliffe, M., Burd, C., Holder, K., & Fields, A. (2016). Defining rural at the US Census Bureau. American Community Survey and Geography Brief. U.S. Department of Commerce. https://www.census.gov/content/dam/Census/library/publications/2016/acs/acsgeo-1.pdf
- Rosenthal, B. (2020, March 23). Density is New York City’s big “enemy” in the coronavirus fight. The New York Times. https://www.nytimes.com/2020/03/23/nyregion/coronavirus-nyc-crowds-density.html
- Saad, L. (2020). Americans rapidly answering the call to isolate, prepare. Gallop Polls. https://news.gallup.com/poll/297035/americans-rapidly-answering-call-isolate-prepare.aspx
- Shoichet, C., & Jones, A. (2020, May 2). Coronavirus is making some people rethink where they want to live. CNN. https://www.cnn.com/2020/05/02/us/cities-population-coronavirus/index.html
- Spencer, J. H., Finucane, M. L., Fox, J. M., Saksena, S., & Sultana, N. (2020). Emerging infectious disease, the household built environment characteristics, and urban planning: Evidence on avian influenza in Vietnam. Landscape and Urban Planning, 193, 103681. https://doi.org/10.1016/j.landurbplan.2019.103681
- Stone, B. (2008). Urban sprawl and air quality in large U.S. cities. Journal of Environmental Management, 86(4), 688–698. https://doi.org/10.1016/j.jenvman.2006.12.034
- Tavernise, S., & Mervosh, M. (2020, April 23). America’s biggest cities were already losing their allure. What happens next? The New York Times. https://www.nytimes.com/2020/04/19/us/coronavirus-moving-city-future.html
- University of Wisconsin Population Health Institute. (2020). County health rankings & roadmaps. https://www.countyhealthrankings.org/app/2020
- U.S. Census Bureau. (n.d.). Metropolitan areas. https://www.census.gov/history/www/programs/geography/metropolitan_areas.html
- U.S. Census Bureau. (2020a). American community survey 5-year estimates, 2013–2017 tables. https://data.census.gov/cedsci
- U.S. Census Bureau. (2020b). LEHD origin-destination employment statistics data (2002–2017). https://lehd.ces.census.gov/data/#lodes. LODES 7.4.
- U.S. Department of Transportation (2017). National Household Travel Survey daily travel quick facts. Bureau of Transportation Statistics. https://www.bts.gov/statistical-products/surveys/national-household-travel-survey-daily-travel-quick-facts
- U.S. EPA Smart Growth Program. (2020). Smart location mapping. https://www.epa.gov/smartgrowth/smart-location-mapping#SLD
- Valeri, L., Patterson-Lomba, O., Gurmu, Y., Ablorh, A., Bobb, J., Townes, F. W., & Harling, G. (2016). Predicting subnational Ebola virus disease epidemic dynamics from sociodemographic indicators. PloS One, 11(10), e0163544. https://doi.org/10.1371/journal.pone.0163544
- Wheaton, W. C., & Thompson, A. K. (2020). The geography of COVID-19 growth in the U.S.: Counties and metropolitan areas. Available at SSRN 3570540.
- World Health Organization (WHO). (2007). The world health report 2007: A safer future: Global public health security in the 21st century.
- World Health Organization (WHO). (2014). Ebola virus disease in West Africa: The first 9 months of the epidemic and forward projections. New England Journal of Medicine, 371(16), 1481–1495.
- World Health Organization (WHO). (2019). Naming the coronavirus disease (COVID-19) and the virus that causes it. https://www.who.int/emergencies/diseases/novel-coronavirus-2019/technical-guidance/naming-the-coronavirus-disease-(covid-2019)-and-the-virus-that-causes-it
- World Health Organization (WHO). (2020). WHO director-general’s opening remarks at the media briefing on COVID-19 – 11 March 2020. Author. https://www.who.int/dg/speeches/detail/who-director-general-s-opening-remarks-at-the-media-briefing-on-covid-19---11-march-2020
- Zandiatashbar, A., Hamidi, S., Foster, N., & Park, K. (2019). The missing link between place and productivity? The impact of transit-oriented development on the knowledge and creative economy. Journal of Planning Education and Research, 39(4), 429–441. https://doi.org/10.1177/0739456X19826271
- Zolnik, E. J. (2011). The effect of sprawl on private-vehicle commuting outcomes. Environment and Planning A: Economy and Space, 43(8), 1875–1893. https://doi.org/10.1068/a42466