
Abstract
Problem, research strategy, and findings
A growing number of planning researchers and practitioners argue for a shift from mobility-centered transportation planning to an accessibility-focused one. Accessibility is a compelling concept that has proven more difficult to operationalize than mobility, which helps to explain why so many accessibility metrics have been developed for urban research and planning practice. To assess the state of these metrics, we reviewed 54 of them in light of their theoretical basis, data requirements, units of analysis, travel modes and trip purposes accounted for, and potential applications to planning practice. We also reviewed the substantial literature on accessibility measurement and interviewed planning practitioners who are applying accessibility metrics in practice. We find that accessibility theory and measurement has advanced more rapidly than applications in practice. However, a new generation of tools is emerging that may accelerate the move to accessibility planning. Although many of the measures focus on a single travel mode, the number of multimodal metrics is growing. Most of the measures are designed for regional-scale planning and scenario evaluation; only a few to date are intended for project evaluation.
Takeaway for practice
The 54 accessibility metrics and tools we reviewed vary widely and none stands out as obviously superior for planning practice. Although most calculate the accessibility of places, and many do so reasonably well, we see the most promise in measures of the accessibility of travelers, which can then be aggregated for place-based analyses while still shedding light on how access can vary substantially across different types of travelers. The principal challenge to broadly deploying accessibility analyses in practice in the years ahead is in developing measures that meaningfully measure the many salient dimensions of access, have manageable data requirements, and are understandable to planners, public officials, and community members.
Traditionally, regional land use plans in the United States have been used by metropolitan planning organizations to project future land development and travel in order to guide transportation system investments to accommodate these projections. At a local level, land development and transportation project proposals have been assessed and prioritized based in no small part on their expected effects on nearby traffic flows (Shoup, Citation2003). So, for example, if vehicle flows near a proposed new development are expected to degrade below a certain threshold, then the project developer may be required to fund nearby traffic mitigations (which typically entail increasing road and intersection traffic capacity), scale back the proposal, or risk having it not approved at all.
The often-unstated premise behind these predict-and-accommodate approaches to regional and local land use and transportation planning is that the configuration and density of both land development and road infrastructure should be guided in large part by their expected effects on unpriced motor vehicle traffic flows. This traffic flow–first approach to regional land use planning and local project evaluation has been subject to withering criticism for perpetuating autocentric development patterns in the United States (Handy, Citation2020; Levine et al., Citation2012) and discouraging denser and more compact developments that can be easily accessed by public transit, walking, and biking (Levine et al., Citation2019). In response, a growing cadre of geography and planning scholars have argued for shifting from a focus on mobility to accessibility. Such a shift could, for example, net out the benefits of economic agglomeration against the congestion it engenders and give planners a more complete and meaningful way to evaluate the positive and negative effects of development (Handy, Citation2020; Levine et al., Citation2019; Thomas et al., Citation2018).
But a shift from mobility to accessibility planning is easier said than done. Accessibility is a powerful, even beguiling concept but a stubbornly difficult one to operationalize (Duranton & Guerra, Citation2016). This is because mobility measures are generally more complete representations of what they purport to measure (transportation system movements) than accessibility measures, which at their core account for opportunities, perceptions, constraints, and behaviors. So although level of service may reasonably characterize and measure motor vehicle movements through intersections, a person’s access to desired groceries depends on much more than the ability to travel quickly to the nearest store.
To assess the state of this progress toward accessibility planning, we examined 54 different accessibility measures and tools proposed and developed in recent years by researchers and commercial developers.Footnote1 For each, we considered its theoretical basis, data requirements, basic units of analysis, travel modes and trip purposes accounted for, and potential applications to planning practice. Our goal was to synthesize the literature on accessibility as a planning concept, highlight the many challenges to measuring and evaluating accessibility vis-à-vis mobility, and trace the progress of accessibility measures in light of these challenges. To understand how accessibility measures are deployed in practice, we interviewed planning practitioners in the states of California, Hawai’i, and Virginia; in the San Francisco Bay Area (CA); and operating nationally who are among the first to employ accessibility-based metrics or evaluations.
Our review suggests that although much progress has been made in developing and improving accessibility metrics, particularly with respect to regional employment and local nonwork destination accessibility, more work is needed to better account for multimodal travel, the heterogeneity of travelers, and accessibility at both individual and spatially aggregated levels. Finally, we found that when accessibility measures are deployed in practice, at least to date, they are most often a supplement to, rather than replacement for, traditional mobility-focused measures and evaluations. Our interviews suggest that this sort of supplementary rollout is an effective way to both test and increase comfort and familiarity with accessibility metrics in practice.
A Conceptual Framework of Accessibility
Transport scholars have increasingly favored accessibility-based frameworks over mobility-based frameworks because the demand for travel is usually derived from a demand for something else (Levine et al., Citation2019). People mostly travel not for the joy of the trip but to reach a job, groceries, friends, health care, and so on at a destination. Indeed, a common definition of accessibility is the ease of reaching desired destinations (El-Geneidy & Levinson, Citation2006; Handy, Citation2020; Hansen, Citation1959; Levine et al., Citation2019).
The intrinsic relationship between accessibility and planning has prompted numerous scholarly efforts to operationalize the concept. These stretch back to at least 1959 in Hansen’s work on defining accessibility in a planning context. Over the years many researchers have sought to integrate different perspectives on and dimensions of accessibility. The conceptual frameworks developed by Wachs and Kumagai (Citation1973), Handy and Niemeier (Citation1997), Geurs and van Wee (Citation2004), H. J. Miller (Citation2005), Páez et al. (Citation2012), Levine et al. (Citation2019), and Levinson and Wu (Citation2020) are all examples of these efforts. We draw from these conceptual frameworks to show the many different dimensions of accessibility and how they interact with one another in .
Figure 1. A conceptual model of the factors affecting accessibility. Note: This is not an exhaustive list of factors. The items outlined with dashed lines are not discussed in this study.
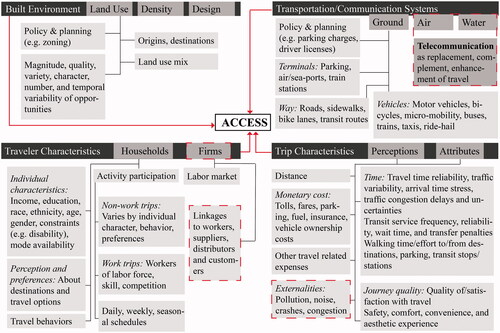
What Factors Affect Accessibility?
Accessibility has a land use component, a transportation component, a temporal component, and an individual component (Geurs & van Wee, Citation2004; Levine et al., Citation2019). The magnitude, quality, variety, and character of activities at destinations; diversity of travel options to reach them; traveler perceptions and preferences; and temporal variability in the availability of destination opportunities all affect accessibility (Handy & Niemeier, Citation1997). Accessibility can be realized by mobility, proximity, connectivity, or various combinations of these. Mobility refers to the ability to move about; proximity refers to the spatial arrangement of origins and destinations; and connectivity refers to the delivery of goods, services, and information to one’s location (Levine et al., Citation2019).
Though mobility, proximity, and connectivity combine to determine accessibility, there are typically trade-offs among these factors so that more of one may diminish another. For example, when many origins and destinations are clustered together in dense agglomerations, average travel distances are short and the utilities of walking, biking, and public transit are typically high. However, such dense development makes roadways and parking expensive to provide and heavily subscribed, so drivers frequently experience traffic delays during their trips and pricey parking at their destinations (Levine et al., Citation2019; Litman, Citation2020). Whether increased proximity nets out to increase or decrease accessibility thus depends on whether and the degree to which mobility across various modes rises or falls in relation to development density (Mondschein & Taylor, Citation2017).
To account for the many dimensions of accessibility described in the literature, accessibility measures should, in addition to travel time, reliability, and cost, account for traveler attributes (such as tastes, preferences, and constraints), safety, convenience, comfort, and esthetics of both journeys and destinations (Bhat et al., Citation2000a). In particular, spatial cognition of available destination opportunities is central to accessibility but to date is rarely accounted for in accessibility measures (Kwan & Hong, Citation1998; Mondschein et al., Citation2006; Neutens et al., Citation2011). Perceived travel time often differs from experienced travel time, and such perceptions affect accessibility as well. How people spend their journey time also affects perceptions of journey quality and satisfaction with the time spent traveling (Levinson & Wu, Citation2020). Accessibility may also be affected by how people value different destinations and travel options, even if they do not choose them. Activity or transportation system disruptions affect accessibility as well (van Wee, Citation2016). Finally, planning and policies (e.g., parking charges, zoning) also affect accessibility.
Types of Accessibility Measures
The accessibility measures we reviewed account for many of these aspects of accessibility in varying combinations and are constructed in many ways (). The metrics can be classified by their principal units of analyses (as either place- or people-based measures) or the basis by which they measure accessibility (for macroscale, system- or regionwide evaluations or more microscale, project-level evaluations). People-based measures disaggregate accessibility calculations to households or individuals, accounting for personal attributes and constraints. Place-based measures, by contrast, focus on the geographic accessibility of places, accounting for an array of characteristics aggregated to zones (Horner & Downs, Citation2014; H. J. Miller, Citation2005).
Figure 2. Modeling framework for accessibility measures, their associated components, and aggregation levels.
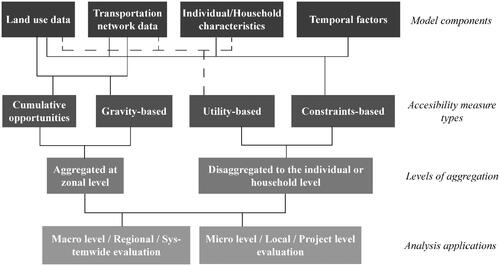
Accessibility measures can also be classified in terms of their focus on normative or positive accessibility. Normative accessibility measures emphasize reasonable or desired costs of travel and are typically insensitive to the heterogeneity of individual travelers and their varied choices. Positive measures, by contrast, are based on people’s actual travel behaviors, which explicitly account for the heterogeneity of these behaviors (Páez et al., Citation2012).
Measuring Accessibility
Given the many dimensions of accessibility and the variety of ways it can be measured, it should come as no surprise that accessibility measures vary substantially from one another, based largely on which aspects of accessibility they take into account. Perhaps the simplest accessibility metrics are cumulative opportunities measures, or contour measures, where opportunities—most often jobs but in some cases other destinations (like grocery stores) as well—within a given distance or travel time from an origin are summed (Wachs & Kumagai, Citation1973) and, in their crudest form, are weighted equally. More recently, reciprocal, or dual, cumulative opportunities measures have been developed to allow planners to optimize the spatial distribution of land uses and facilities to minimize travel and traveler costs (Cui & Levinson, Citation2020a, Citation2020b).
A more sophisticated, but also common, measure borrows from Newtonian physics. Gravity measures overcome the problem of weighting nearer and more distant destinations (within a given threshold) equally. With gravity measures, easier-to-reach destinations are weighted more heavily than harder-to-reach ones using a distance decay function calibrated by trip purpose that accounts for the generalized cost of travel, which typically comprises travel time or distance and travel price (El-Geneidy & Levinson, Citation2011; Levine et al., Citation2019).
Both cumulative opportunities and gravity measures focus on the spatial distribution of origins and destinations and thus take into account the land use and transportation components of accessibility (El-Geneidy & Levinson, Citation2011; Levine et al., Citation2019). These measures emphasize the access potential of places and largely ignore the heterogeneous perceptions, preferences, abilities, and actual behaviors of travelers or households residing there (Handy & Niemeier, Citation1997).
In contrast, utility-based measures focus on accessibility at the individual or household level, usually by incorporating individual preferences and/or socioeconomic characteristics related to travel. They typically include the relative attractiveness of destinations and individualized measures of travel impedance, as well as the tastes and preferences of individuals or households. Logsum measures are often used to summarize the expected maximum net utility from a choice (e.g., destination and/or mode of transport) among all choices. However, the access utility predicted by these measures again reflects access potential, which can differ substantially from the destination utility actually realized by individuals or households (van Wee, Citation2016).
The temporal dimension of accessibility is most directly addressed by constraints-based measures that account for the variability in the times that opportunities are actually available, typically using the concept of space–time geography (El-Geneidy & Levinson, Citation2006; H. J. Miller, Citation2005; H. J. Miller & Wu, Citation2005; Neutens et al., Citation2007). Here, households and/or individuals sort their flexible activities, like grocery shopping, into their day based on the times and locations available to them after performing time- and location-fixed activities, like working or going to school (Kwan, Citation1999; Weber & Kwan, Citation2003). Travelers thus move through space and time to engage in more and less constrained activities, often by “chaining” trips into tours. To account for trip chaining, Lucas et al. (Citation2016) matched clusters of destinations with residential origins using a distance-based accessibility measure. Additional temporal constraints, such as the operating hours of businesses, public transit schedules, and traffic congestion delays, can also be captured by space–time accessibility measures (Neutens et al., Citation2011).
The space–time constraints on travelers can be operationalized using space–time prisms (Hägerstrand, Citation1970) that depict the set of feasible paths for individuals considering the space–time constraints they face (Kwan, Citation1999, Citation2010; Kwan & Hong, Citation1998; Lee & Miller, Citation2018; H. J. Miller, Citation1991). However, these measures typically do not account for the actual availability of activities resulting from competition for them, such as among workers for jobs (Neutens et al., Citation2011). In addition to analyzing individual accessibility, space–time prisms have also been used in place-based measures to account for the constraints posed by transportation networks and services, such as temporal fluctuations of public transit availability across peak, midday, evening, and overnight time periods (Lee & Miller, Citation2018).
Given the pros and cons of these different approaches to accessibility measurement, composite measures have been developed to offer a more inclusive and conceptually complete accessibility metrics. Unfortunately, these have, to date, proven complex and difficult to operationalize for practice (El-Geneidy & Levinson, Citation2006). For example, H. J. Miller and Wu’s (Citation2000) space–time accessibility measure integrates utility, constraints, and spatial interaction–based measures into a single accessibility metric, but for all its complexity it still does not take into account individual or household socioeconomic characteristics or the varying perceptions and preferences of travelers.
Some of the accessibility measures discussed so far have been improved by the subsequent incorporation of additional factors thought to affect accessibility. For example, to account for competition among job seekers, van Wee et al. (Citation2001) developed an accessibility measure to estimate the relative accessibility of jobs in a gravity-based model that accounts for worker competition for jobs. Even this improved competition-constrained measure, however, does not take into account the enormous diversity of both jobs and workers qualified for them (Cheng & Bertolini, Citation2013).
Weaknesses of Current Measures
Although the literature on accessibility is substantial, it remains, according to van Wee (Citation2016), relatively immature. There is not yet a commonly accepted theory of accessibility among either researchers or practitioners, though the various conceptual frames summarized here are more orthogonal than incompatible. Indeed, theorizing about accessibility has proven an easier lift than operationalizing the concept into land use and transportation planning practice (Duranton & Guerra, Citation2016). Even the most sophisticated accessibility measures developed to date do not typically account for traveler preferences and perceptions, a full suite of modal options, or transportation system disruptions, despite their importance as determinants of accessibility (van Wee, Citation2016).
Most conventional accessibility measurement tools do not calculate non-home-based accessibility (such as restaurant accessibility for workers in a given zone), though they easily could, or multipurpose trips or trip chaining (Handy & Niemeier, Citation1997). Accessibility researchers have also tended to focus on personal and not commercial accessibility, even as commercial travel accounts for an ever-increasing share of all travel (van Wee, Citation2016). Most of the current accessibility measures focus on the spatial arrangement of origins and destinations and do not address the ease of origin–destination interaction that information and communication technology advances facilitate via telecommuting, online shopping, banking, and so on (H. J. Miller, Citation2005). Further, travel costs in accessibility analyses typically account for the costs directly borne by travelers but not the external costs (delays, noise, crashes, pollution, etc.) travelers’ actions impose on others (Wu & Levinson, Citation2020). The challenges to reliably estimating such external costs, however, are substantial and in no way specific to accessibility metrics. Finally, in addition to these issues with the measures themselves, where the measures have been developed, tested, and deployed is limited as well; the vast majority of accessibility research centers on Europe, the United States and Canada, Australia and New Zealand, and China, whereas far less work has been applied to other parts of the world.
Review of Accessibility Measures and Tools
As the number of accessibility analysis tools has grown over time, so have evaluations of them. Two decades ago, Bhat et al. (Citation2000b) conducted a comprehensive review of accessibility measures available at the time to identify how different measures account for different travel modes, trip purposes, and extent of spatial disaggregation. None of the measures they reviewed accounted for all three of these factors in a single metric. They also tested different forms of cumulative opportunities and gravity-based measures using data from the Dallas–Fort Worth (TX) metropolitan area and found that gravity measures that accounted for in-vehicle travel time, distance, or a combination of the two performed better in terms of their theoretical basis, data requirements, and empirical performance than either a cumulative opportunities measure or a Gaussian impedance function gravity-based measure (Bhat et al., Citation2001). A few years later, Geurs and van Wee (Citation2004) reviewed multiple accessibility measures and evaluated their applicability to accessibility impact analyses of land use and transport changes based on theory, interpretability and communicability, data requirements, and usability in social and economic evaluations. They found that the most widely used tools at the time were not adequately based on theories of accessibility. They concluded that location- and utility-based accessibility measures held the most promise for practice but needed substantial improvements from where they stood at the time (Geurs & van Wee, Citation2004).
More recently, Páez et al. (Citation2012) reviewed accessibility measures based on both their normative and positive aspects and Malekzadeh and Chung (Citation2020) reviewed available public transit accessibility measures, while Papa et al. (Citation2015) analyzed 21 accessibility measurement tools developed in 15 European countries and Australia based on their intended purpose, theoretical basis, geographical measurement scale, transportation modes and trip purposes evaluated, levels of visualization, potential users of the tool, and obstacles to utilization. They found that time–space and utility-based frameworks, often favored by scholars, are rarely employed in practice (Papa et al., Citation2015). Most recently, Wu and Levinson (Citation2020) reviewed accessibility measures from different disciplines and brought all the measures under the unifying framework of what they term either primal or dual measures, based on how the accessibility functions were formulated with respect to travel cost and destinations measured.
In the past few years, walking and biking have become more central to accessibility analyses, which previously focused primarily on motor vehicle travel and, occasionally, public transit access. In their review of operational measures for active (walking and biking) transportation accessibility, Vale et al. (Citation2015) found that measures for operationalizing walking accessibility are far more common than those operationalizing cycling accessibility. Further, all of the active travel accessibility measures they reviewed are place-based, and none are people-based (Vale et al., Citation2015).
Our review of accessibility measures and analysis tools builds on these previous evaluations by focusing on potential applications to planning practice. Following Levinson and King (Citation2020), we use the term tool for readily available commercially developed and open access planning decision support tools, and we use the terms metrics and measures interchangeably to describe both the building blocks of the tools as well as measures developed by researchers for specific analyses but not intended for direct use in planning practice. Some accessibility measures have been deployed as part of macroscale analyses in state and metropolitan planning and occasionally in microlevel analyses of land development and transportation project evaluation. Drawing on the accessibility modeling framework in , we divide the tools analyzed into two general types: people-based measures that focus on travelers’ accessibility, and the more common place-based measures that focus on the accessibility of zones. Although some scholars consider constraints-based measures as the only true people-based measures because they capture the space–time travel constraints of individuals (El-Geneidy & Levinson, Citation2006; Geurs & van Wee, Citation2004), we use a more inclusive definition that incorporates any measure that takes into account travelers’ characteristics, perceptions, experiences, or constraints at some stage of modeling accessibility. Hence, utility-based measures are people-based in our schema because they estimate utility functions using socioeconomic attributes and preferences of individuals and/or households. Similarly, the metrics developed by Páez et al. (Citation2012, Citation2013) are also people-based because they estimate average trip length as part of the cumulative opportunities calculations, with the threshold varying by individual socioeconomic attributes.
Some of the metrics we evaluated can function as either people- or place-based measures when they both account for travelers’ characteristics, perceptions, experiences, or constraints and allow for individual accessibility to be aggregated up to derive place-based measures. For example, the metrics developed by Horner and Downs (Citation2014) and Lee and Miller (Citation2019) are both people- and place-based because individual accessibility scores can be aggregated to obtain location-based accessibility measures for these tools.
Table A-1 in the Technical Appendix summarizes the details of the 54 tools we reviewed, and for each we note their theoretical basis; data requirements; categorization as people, place, or combination metric; travel modes and trip purposes accounted for; and potential applications to practice. In the following sections, we summarize the findings from our review of these tools and the associated literature on them, as well as our interviews with planners working to deploy accessibility measures in practice.
Accessibility Metrics for Planning Evaluations
Most accessibility measures offer insight on how land use and transportation systems interact (Cascetta et al., Citation2016), usually by determining baseline accessibility levels and allowing for analyses of the marginal effects of land use and transportation system changes. The simplest of these measures count the number of available opportunities within certain distance and/or travel time thresholds and compare the result with some desired policy goal (Geurs & van Wee, Citation2004). Most of the tools can compare and contrast alternative future scenarios (Anderson et al., Citation2013; Golub et al., Citation2013). Examples of accessibility analyses in the literature include a) how spatial equity is affected by particular land use/transportation network configurations (Lee & Miller, Citation2019; Vandenbulcke et al., Citation2009); b) how the spatial and temporal distribution of activities may affect gender differences in accessibility (Neutens et al., Citation2011); c) how a proposed transit-oriented development would be expected to affect accessibility (Yigitcanlar et al., Citation2007); d) how various land use and transportation systems affect opportunities for social interaction (Farber et al., Citation2013); and e) whether a proposed development or transportation system change may reduce the accessibility of individuals with particular characteristics (Páez et al., Citation2013).
Although accessibility analyses of larger-scale, longer-term land development scenarios in regional planning are gradually becoming more commonplace, project-level accessibility analyses remain comparatively rare (Merlin et al., Citation2018). One notable exception is the accessibility elasticity metric developed by Levine et al. (Citation2017), which assesses land development projects vis-à-vis similar projects that might be developed elsewhere in a region. This metric uses the output of a traffic impact analysis for the proposed project to estimate its accessibility impacts. Similarly, Merlin et al.’s (Citation2018) metric evaluates the accessibility effects of proposed transportation projects in light of land use changes that might be induced by the project. Finally, some commercial developers have begun marketing tools for project-level analysis as well. CUBE Access is a project-level analysis tool that can calculate multimodal accessibility levels using real-time data for both scenario planning and project evaluation (McCahill et al., Citation2017). Accessibility analysis tools developed by Conveyal can calculate multimodal accessibility and project before and after impacts of transportation infrastructure changes (Conveyal, Citation2015; Stewart, Citation2019). CoAXs (Collaborative Accessibility-based Stakeholder Engagement System) is a web-based interactive tool customized for analyzing land use and equity impacts of public transit investments that uses Conveyal’s open-source software (Stewart & Zegras, Citation2016).
In net, the capabilities of the growing cadre of accessibility analysis metrics substantially exceed their current application in practice. Although only a few of the tools reviewed here are intended specifically for project-level analyses, many more could be used for development impact assessment by comparing baseline accessibility against the projected accessibility changes due to a proposed development. However, none of the accessibility metrics or tools developed to date accounts for how a project might differently affect accessibility over its life span (Levinson & Wu, Citation2020).
Data, Lots of Data
The rise of accessibility metrics in an era of waxing big data is no coincidence. Accessibility measures typically require more data from more sources than comparable mobility measures, and the more conceptually complete the accessibility metric, the more extensive the data requirements. Table A-1 in the Technical Appendix shows that even the most basic accessibility measures need data on transportation network characteristics and location of opportunities of interest. The increasing availability of new and innovative data sources, such as mobile device global positioning system (GPS) data to track travelers’ movements in exquisite (and often invasive) detail, social media data to infer trip purposes and preferences, and general transit feed specification, automatic vehicle location, and automated passenger counter data for detailed information on public transit service and use, has enabled far more detailed and nuanced information on travel behavior and access to opportunities, including in real time. For example, Moya-Gómez et al. (Citation2018) used travel time data from TomTom and destination attractiveness data from Twitter to calculate dynamic accessibility for transportation zones in Madrid (Spain) every 15 min throughout the day. Floating car GPS data are another source of real-time traveler tracking information that is increasingly used to calculate dynamic accessibility (Li et al., Citation2011). Cloud infrastructure has enabled continuous data acquisition and feedback loops that produce dynamic accessibility measurements far faster than before, which has led to new accessibility tools that require ever more extensive data sets and computation capacity (Conway et al., Citation2017).
The past decade has also witnessed efforts to overcome the problem that extensive data requirements have made the more theoretically sound access measures unworkable for practice. For example, El-Geneidy and Levinson (Citation2011) developed the Place Rank measure that relies on the actual travel of individuals between origins and destinations on the assumption that both travel impedance and destination opportunity values are embedded in the actual origin–destination travel information; this obviates the need for origin–destination travel time data for accessibility estimation (El-Geneidy & Levinson, Citation2011). This actual flow-based approach was further refined to capture accessibility changes resulting from transportation system changes by Rubulotta et al. (Citation2013) and to account for energy consumption and emissions resulting from different trips by Vega (Citation2012).
Trip Purpose and Travel Mode
One limitation of many of the accessibility tools developed to date is that they consider only a particular trip purpose, a specific time of the day for trip-making, or a single travel mode. As shows, about a third of the metrics we reviewed measure accessibility to jobs (35.2%) and/or via motor vehicles (29.6%) only, though most of the commercial and open-source tools being gradually deployed in practice account for multiple travel modes. Among the measures that account for travel modes other than driving, many do so only partially. Notably, some measures take into account walking distance or time required to access and egress public transit but do not consider pedestrian or bicycle accessibility independent of other modes. For example, Lee and Miller (Citation2018) considered walking time to transit stops in their space–time constrained cumulative opportunity measure and Pan et al. (Citation2020) considered walk-to-transit trips in their job accessibility measures but not walking trips to destinations that do not entail transit.
Table 1 Number of accessibility metrics and tools by units of analysis, travel mode, and trip purposes accounted for.
Accessibility is obviously composed of more than, for example, commuting to work and travel in rush hours or on public transit, so the picture painted by many of the early measures was incomplete at best (Bhat et al., Citation2001, Citation2002). Bhat et al. (Citation2002) made an early effort to account for multiple dimensions of accessibility by developing a methodology using multinomial logistic regression models to aggregate different dimensions of accessibility, including time of day, mode, trip purpose, and space. Most recently, Cui and Levinson (Citation2020a) developed an aggregate accessibility measure that simultaneously accounts for access to multiple activities at multiple destinations using a cumulative opportunities approach.
The People Versus Place Divide
Accessibility tools and their application to practice are clearly divided between metrics that focus primarily on people or places. Among the tools we reviewed, 36 are place-based, 9 are people-based, and 9 are combinations of the two; all of the metrics and tools developed for project evaluation that we reviewed are place-based.
In general, and perhaps ironically, the measures developed by geographers tend to center on travelers, whereas those developed by and for planners are typically place-focused. The geographer-developed measures often account for the temporal availability of opportunities using the concept of space–time geography discussed above (Handy & Niemeier, Citation1997; Weber & Kwan, Citation2003), but to date these have had little traction in planning scholarship or practice. Although tools based on space–time geography have the advantage of being able to account for the opportunities and constraints on accessibility at an individual level, such tools cannot practically be used to analyze accessibility at spatially aggregated levels. To address this, Lee and Miller (Citation2019) recently developed the concept of an average space–time prism, which aggregates data from individual space–time prisms into a summary representation of access.
Building a Better Measure
Most of the tools intended for practice that we reviewed err toward being less data intensive and more intuitive but in doing so do not account for many of the factors—like heterogeneity of travelers, access to multiple opportunities—accessibility theorists have posited to importantly affect individual and spatial accessibility. On the other hand, some recently developed measures admirably integrate multiple dimensions of accessibility (Cascetta et al., Citation2016; Horner & Downs, Citation2014; H. J. Miller & Wu, Citation2005) but require such copious amounts of data and entail so much computation that they have proven unwieldy to employ in practice and even more difficult to interpret and communicate to nonexperts. Given this fundamental tradeoff between conceptual completeness and ease of application, lists some of the most important limitations common to many current accessibility metrics for which both increasing data access and the research literature suggest near-term promise to improve accessibility tools for use in practice.
Table 2 Important limitations of many accessibility metrics and near-term opportunities for improvements.
A reasonably conceptually complete and usable analysis tool should account for many of the most important factors thought to affect accessibility, be able to depict accessibility at both the individual and spatially aggregated levels, draw on widely available data, and be relatively easy to use and intuitive to understand. None of the tools we evaluated yet balances all of these criteria, though researchers and software developers are continuing to develop new measures and enhance existing ones that are moving closer to doing so. These enhancements include a) incorporating trip chaining and scheduling into utility-based measures (Dong et al., Citation2006) and accounting in various ways in place-based measures for the effects of b) travel time reliability (Chen et al., Citation2017; Conway et al., Citation2017), c) traffic congestion (Vandenbulcke et al., Citation2009), d) transportation system reliability and robustness (Liao & van Wee, Citation2017), e) competition among workers for jobs (Cheng & Bertolini, Citation2013; Ong & Blumenberg, Citation1998; van Wee et al., Citation2001), f) employment diversity (Cheng & Bertolini, Citation2013), g) job matching based on skills and qualifications (Pan et al., Citation2020), and h) level of traffic stress affecting cycling (Gehrke et al., Citation2020; Imani et al., Citation2019; McCahill et al., Citation2017). Dynamic accessibility tools have also been developed to account for temporal variations in accessibility (Lee & Miller, Citation2018; Wang et al., Citation2018), such as between peak congested and off-peak free-flowing traffic, when waits for public transit are short or long, and between weekdays and weekends.
In addition to these more objective dimensions, accessibility depends on the perceptions and preferences of travelers. To account for travelers’ spatial awareness of available opportunities, Cascetta et al. (Citation2016) developed a behavioral model of accessibility that accounts for both perceptions of opportunities and spatiotemporal constraints affecting travelers’ abilities to avail themselves of them. Lättman et al. (Citation2016) developed a perceived accessibility scale that captures individuals’ experiences and satisfaction with living in their community and region, including accessing destinations and activities using public transport. Acknowledging the discrepancy between decision utility and experienced utility, Chorus and De Jong (Citation2011) developed an accessibility measure to approximate the access utility actually experienced by travelers. Others have tried to better reflect actual conditions by applying the inverse balancing factors of doubly constrained spatial interaction models to account for the fact that both job demand and supply jointly determine employment accessibility (Cerdá, Citation2009; Geurs & Ritsema van Eck, Citation2003).
Though cumulative opportunities measures have proven popular for practice due to their simplicity (Boisjoly & El-Geneidy, Citation2017; Curl et al., Citation2011), a frequent criticism of such measures is that they typically entail arbitrary distance or time thresholds within which available opportunities are counted (Handy & Niemeier, Citation1997). Because such fixed thresholds are insensitive to individual and locational attributes, they can fail to paint a realistic picture of how accessibility varies among different segments of the population (Páez et al., Citation2010). Páez et al. (Citation2010, Citation2013) addressed this issue by including model-based estimates of average trip length instead of a fixed travel time or distance threshold to account for variations in location and person-based accessibility.
Practice and Usability of the Tools
Despite the waxing popularity of accessibility as a guiding principle in land use and transportation planning and the burgeoning number of accessibility measures, accessibility evaluations are only beginning to be employed in practice (McCahill et al., Citation2020). Many metropolitan planning organizations have adopted accessibility-oriented goals in their regional transportation plans (Merlin et al., Citation2018) but, despite this, most lack accessibility-related performance measures of goal achievement and instead frequently conflate mobility-oriented criteria with accessibility (Handy, Citation2005; Proffitt et al., Citation2019). At a more local level, accessibility impact analyses are to date only rarely employed in project evaluation. Some notable exceptions include the Commonwealth Transportation Board of Virginia’s Smart Scale initiative (McCahill et al., Citation2017) and the Hawai’i Department of Transportation’s Smart Transportation Rank Choice. Both of these evaluation processes include accessibility to jobs and other destinations as criteria in prioritizing projects for funding. For example, the Virginia Commonwealth Transportation Board assigns weights to three different accessibility factors (60% for accessibility to jobs, 20% for accessibility to jobs for disadvantaged populations, and 20% for multimodal options) to calculate the accessibility score for the SMART SCALE initiative (SMART SCALE, Citation2020).
Our interviews with those using or starting to use accessibility measures in planning practice suggest that the commercially developed place-based tools are most often used for project evaluation. The San Francisco Bay Area Metropolitan Transportation Commission is an exception in that they calculate accessibility using a logsum measure, as part of their analysis to prioritize projects for the region’s long-range regional transportation plan (A. Tapase, personal communication, December 10, 2020).
Most of those interviewed raised concerns about both the complexity and opacity of the available tools, as well as the lack of in-house technical expertise to use them effectively. One of our interviewees described accessibility measurement tools as “black boxes” (Z. Hanson, personal communication, November 16, 2020), and others echoed similar concerns, even those enthusiastic about moving to accessibility-focused evaluation frameworks. Impatient with the slow progress of practice-ready accessibility tools, one of our interviewees told us, “Having a readily available and easy-to-use tool would be most helpful at this point” (C. Ganson, personal communication, November 23, 2020).
In their study of accessibility tool developers and users, Silva et al. (Citation2017) concluded that accessibility tool developers often do not understand the specific needs of practitioners, whereas practitioners frequently do not understand the underlying logic and structure of the accessibility tools or how to properly use them. As a result, enthusiasm for accessibility planning has considerably outpaced the deployment of accessibility evaluation tools in practice, both in the United States and globally (Boisjoly & El-Geneidy, Citation2017). To help address the problem of planning practitioners’ unfamiliarity with accessibility evaluation tools and how they can be properly employed in practice, two accessibility evaluation how-to manuals for planners have been recently published: the Transport Access Manual (Levinson & King, Citation2020) and State Smart Transportation Initiative’s Measuring Accessibility: A Guide for Land Use and Transportation Practitioners (Sundquist et al., Citation2021).
When asked about obstacles to moving from mobility- to accessibility-centered evaluations, our interviewees cited the lack of standard, widely used, and accepted metrics; the difficult-to-interpret and -explain accessibility tool outputs; and a general institutional resistance to move from clearly established, widely accepted mobility-based evaluations to more uncertain, and more easily contested, accessibility evaluations. These challenges, according to both our interviewees and multiple previous evaluations of accessibility measurement in practice, are exacerbated by the extensive data collection and processing requirements for the accessibility measures (Bertolini et al., Citation2005; Boisjoly & El-Geneidy, Citation2017; Curl et al., Citation2011; Duranton & Guerra, Citation2016; Ferreira & Papa, Citation2020; Handy, Citation2020; Te Brömmelstroet et al., Citation2016; van Wee, Citation2016).
Conclusion
Undoubtedly, academics will complain about the imperfections of [accessibility evaluation in] practice, just as the practitioners complain about academics. We cannot let the perfect be the enemy of the good, nor can we let the good stop us from trying to discover the perfect. (Levinson & Wu, Citation2020, p. 150)
Although most of the practitioners we interviewed told us that the accessibility measurements and tools they are using at present are not sophisticated enough to depict a well-rounded picture of accessibility, they also worried that more sophisticated and conceptually complete measures would be even more difficult to interpret and explain to elected officials, journalists, and community members. This tension—between conceptual completeness on one hand and application practicality on the other—poses a significant challenge to moving to accessibility analyses in planning. Not letting perfect be the enemy of the good begs the question: How good is good enough? A tool that simply measures auto travel impedance between housing undifferentiated by type in a given zone and jobs undifferentiated by type in the larger region without regard to differing levels of worker skills, income, or auto and transit access offers a decidedly incomplete, and potentially misleading, picture of employment accessibility and an even more incomplete picture of overall accessibility. Such partial analyses may offer insights beyond current mobility-focused metrics, but they can leave out many of the most important aspects of accessibility, such as whether travelers have access to cars or heterogeneous destination preferences across diverse populations, that motivated a move to accessibility analysis in the first place.
This tension between measuring what is important about accessibility on one hand and manageable, intuitive measures for practice on the other has triggered considerable debate in the literature. Whereas some researchers have called for adopting fairly simple accessibility measures for ease of interpretability (Bertolini et al., Citation2005), others have criticized them as crude metrics that lack any robust theoretical foundation (E. J. Miller, Citation2018). E. J. Miller (Citation2018) argued that more complex, theoretically grounded utility-based measures are more promising than the simpler approaches for application in transportation planning and decision making because of their conceptual completeness but acknowledged that substantial improvements are needed before current tools will be ready for broad application. Levine et al. (Citation2019) were much more pessimistic about the potential of comprehensive accessibility measures for practice, arguing that it is just too difficult to accurately predict preferences, identities, and life situations of future residents of a given location. They concluded that utility-based measures may not be a good way to guide land use and transportation planning when development evaluation involves forecasting.
The 54 accessibility metrics and tools we reviewed run the gamut from rudimentary to comprehensive. Though we see significant progress in the development and refinement of these accessibility metrics in the past 25 years, none yet stands out as obviously superior choices for either regional planning or project evaluation. Most of the accessibility evaluation measures we reviewed have been developed by and for researchers; five are readily available planning decision support tools, a number we expect to grow substantially in the years ahead. Although data requirements and institutional inertia are surely hurdles to a shift to accessibility-focused planning, the tools themselves are for the most part still evolving and improving. In the course of this evolution, researchers and software developers are gradually accounting for many of the most salient dimensions of accessibility.
To our surprise, many of the tools reviewed account only for a single mode of transportation, typically driving, although the number of multimodal evaluation tools is growing. One of the most important elements of accessibility as a planning concept is that it accounts for both multiple means of and substitutes for travel. Indeed, most of the metrics being tested in practice do account for multiple travel modes, which is important given the rise of ride-hail, micromobility, and increasingly automated vehicles.
Among the place-based tools that are beginning to be employed in practice, we see promise in many of them. In particular, CUBE Access and the Virginia Department of Transportation’s custom-built accessibility analysis tool each account for multiple travel modes and multiple destination types, both of which are essential building blocks to effective and meaningful accessibility analyses.
One important distinction among the measures we reviewed is that most focus on calculating the accessibility of places (often in terms of employment accessibility), whereas only a few metrics treat travelers as the unit of analysis. And though only a few of the tools we reviewed are intended for project evaluation, all of them are place-based. Yet travelers vary substantially in resources, abilities, identities, cultures, and preferences, even those residing in the same neighborhood. Destinations considered essential to some travelers (such as a mosque or synagogue) may be irrelevant to others. Focusing on the accessibility of places without regard to who is doing the accessing can lead to ecological fallacies, where individuals in a particular zone are assumed to all share the characteristics of that zone, thereby inhibiting equity analyses.
Although such place-based tools have proven most popular to date among planning scholars and practitioners and are most often deployed in practice, we anticipate that the state-of-the-art tools in the future will be built on a people-based logic that can allow for both analyses of particular segments of travelers and also can be spatially aggregated for analyses of places. In recent years, researchers, especially from geography, have attempted to develop these kinds of tools and make them easier to interpret. Though the data and background computations required for such people-based measures are substantial, their outputs to inform planning decisions are gradually becoming easier to interpret and communicate.
With respect to the currently slow pace of adoption, we note that the movement to replace traditional four-step travel demand models with more theoretically sound and data-intensive activity-based models in transportation planning and forecasting began in the 1980s but required a quarter-century of research and development before the models became widely deployed in practice. The current, rather slow, pace of progress in development and deployment of accessibility analyses in practice may follow a similar arc. Applications in practice are likely to accelerate as more jurisdictions incorporate accessibility-related performance measures into their plans and policy documents (Boisjoly & El-Geneidy, Citation2017). Expanded adoption of accessibility goals and evaluations by state and regional governments is likely to both accelerate the testing and continued refinement of access measurement tools and encourage county and municipal governments to adopt accessibility goals and evaluations as well. Finally, given the challenges to interpreting and communicating measures of accessibility, particularly in more conceptually complete, multidimensional measures, ongoing stakeholder engagement and qualitative supplements to the accessibility analyses will likely be needed to make these accessibility analyses more, well, accessible.
RESEARCH SUPPORT
This research was funded by the California Statewide Transportation Research Program. We are grateful for this support.
Technical Appendix
Download PDF (301.8 KB)ACKNOWLEDGMENTS
We thank the five practitioners interviewed for their time and insights on access planning in practice, and the three anonymous referees and the editor for helpful comments on earlier drafts of this article.
SUPPLEMENTAL MATERIAL
Supplemental data for this article can be found on the publisher’s website.
Additional information
Notes on contributors
Fariba Siddiq
FARIBA SIDDIQ ([email protected]) is an urban planning doctoral student and a researcher in the Institute of Transportation Studies at the University of California at Los Angeles (UCLA).
Brian D. Taylor
BRIAN D. TAYLOR, FAICP ([email protected]), is a professor of urban planning and public policy in the Luskin School of Public Affairs and director of the Institute of Transportation Studies at UCLA.
Notes
1 This is an extensive, though not exhaustive, list of accessibility measures developed to date; we limit our review of accessibility metrics to those focused on the movement of people and we do not consider goods movement measures.
REFERENCES
- Anderson, P., Levinson, D., & Parthasarathi, P. (2013). Accessibility futures. Transactions in GIS, 17(5), 705. https://doi.org/10.1111/tgis.12024
- Bertolini, L., Le Clercq, F., & Kapoen, L. (2005). Sustainable accessibility: A conceptual framework to integrate transport and land use plan-making. Two test-applications in the Netherlands and a reflection on the way forward. Transport Policy, 12(3), 207–220. https://doi.org/10.1016/j.tranpol.2005.01.006
- Bhat, C. R., Handy, S., Kockelman, K. M., Mahmassani, H. S., Chen, Q., Srour, I., & Weston, L. M. (2001). Assessment of accessibility measures. https://ctr.utexas.edu/wp-content/uploads/pubs/4938_3.pdf
- Bhat, C. R., Handy, S., Kockelman, K. M., Mahmassani, H. S., Chen, Q., & Weston, L. M. (2000a). Accessibility measures: Formulation considerations and current applications. https://ctr.utexas.edu/wp-content/uploads/pubs/4938_2.pdf
- Bhat, C. R., Handy, S., Kockelman, K. M., Mahmassani, H., Chen, Q., & Weston, L. M. (2000b). Development of an urban accessibility index: Literature review. https://ctr.utexas.edu/wp-content/uploads/pubs/4938_4.pdf
- Bhat, C. R., Handy, S., Kockelman, K. M., Mahmassani, H. S., Gopal, A. R., Srour, I., & Weston, L. M. (2002). Development of an urban accessibility index: Formulations, aggregation and application. https://ctr.utexas.edu/wp-content/uploads/pubs/4938_4.pdf
- Boisjoly, G., & El-Geneidy, A. M. (2017). The insider: A planners’ perspective on accessibility. Journal of Transport Geography, 64, 33–43. https://doi.org/10.1016/j.jtrangeo.2017.08.006
- Cascetta, E., Cartenì, A., & Montanino, M. (2016). A behavioral model of accessibility based on the number of available opportunities. Journal of Transport Geography, 51, 45–58. https://doi.org/10.1016/j.jtrangeo.2015.11.002
- Cerdá, A. (2009). Accessibility: A performance measure for land-use and transportation planning in the Montréal metropolitan region [Master’s thesis]. McGill University. https://tram.mcgill.ca/Teaching/srp/documents/Assumpta.pdf
- Chen, B. Y., Yuan, H., Li, Q., Wang, D., Shaw, S.-L., Chen, H.-P., & Lam, W. H. K. (2017). Measuring place-based accessibility under travel time uncertainty. International Journal of Geographical Information Science, 31(4), 783–804. https://doi.org/10.1080/13658816.2016.1238919
- Cheng, J., & Bertolini, L. (2013). Measuring urban job accessibility with distance decay, competition and diversity. Journal of Transport Geography, 30, 100–109. https://doi.org/10.1016/j.jtrangeo.2013.03.005
- Chorus, C. G., & de Jong, G. C. (2011). Modeling experienced accessibility for utility-maximizers and regret-minimizers. Journal of Transport Geography, 19(6), 1155–1162. https://doi.org/10.1016/j.jtrangeo.2011.02.009
- Conveyal. (2015). Introducing transport analyst. Medium. https://blog.conveyal.com/introducing-transport-analyst-7f0b3c595fb6
- Conway, M. W., Byrd, A., & van der Linden, M. (2017). Evidence-based transit and land use sketch planning using interactive accessibility methods on combined schedule and headway-based networks. Transportation Research Record: Journal of the Transportation Research Board, 2653(1), 45–53. https://doi.org/10.3141/2653-06
- Cui, M., & Levinson, D. (2020a). Multi-activity access: How activity choice affects opportunity. Transportation Research Part D: Transport and Environment, 85, 102364. https://doi.org/10.1016/j.trd.2020.102364
- Cui, M., & Levinson, D. (2020b). Primal and dual access. Geographical Analysis, 52(3), 452–474. https://doi.org/10.1111/gean.12220
- Curl, A., Nelson, J. D., & Anable, J. (2011). Does accessibility planning address what matters? A review of current practice and practitioner perspectives. Research in Transportation Business & Management, 2, 3–11. https://doi.org/10.1016/j.rtbm.2011.07.001
- Dong, X., Ben-Akiva, M. E., Bowman, J. L., & Walker, J. L. (2006). Moving from trip-based to activity-based measures of accessibility. Transportation Research Part A: Policy and Practice, 40(2), 163–180. https://doi.org/10.1016/j.tra.2005.05.002
- Duranton, G., & Guerra, E. (2016). Developing a common narrative on urban accessibility: An urban planning perspective. https://trid.trb.org/view/1489337
- El-Geneidy, A. M., & Levinson, D. (2006). Access to destinations: Development of accessibility measures. http://conservancy.umn.edu/handle/11299/638
- El-Geneidy, A. M., & Levinson, D. (2011). Place rank: Valuing spatial interactions. Networks and Spatial Economics, 11(4), 643–659. https://doi.org/10.1007/s11067-011-9153-z
- Farber, S., Neutens, T., Miller, H. J., & Li, X. (2013). The social interaction potential of metropolitan regions: A time-geographic measurement approach using joint accessibility. Annals of the Association of American Geographers, 103(3), 483–504. https://doi.org/10.1080/00045608.2012.689238
- Ferreira, A., & Papa, E. (2020). Re-enacting the mobility versus accessibility debate: Moving towards collaborative synergies among experts. Case Studies on Transport Policy, 8(3), 1002–1009. https://doi.org/10.1016/j.cstp.2020.04.006
- Gehrke, S. R., Akhavan, A., Furth, P. G., Wang, Q., & Reardon, T. G. (2020). A cycling-focused accessibility tool to support regional bike network connectivity. Transportation Research Part D: Transport and Environment, 85, 102388. https://doi.org/10.1016/j.trd.2020.102388
- Geurs, K. T., & Ritsema van Eck, J. R. (2003). Evaluation of accessibility impacts of land-use scenarios: The implications of job competition, land-use, and infrastructure developments for the Netherlands. Environment and Planning B: Planning and Design, 30(1), 69–87. https://doi.org/10.1068/b12940
- Geurs, K. T., & van Wee, B. (2004). Accessibility evaluation of land-use and transport strategies: Review and research directions. Journal of Transport Geography, 12(2), 127–140. https://doi.org/10.1016/j.jtrangeo.2003.10.005
- Golub, A., Robinson, G., & Nee, B. (2013). Making accessibility analyses accessible: A tool to facilitate the public review of the effects of regional transportation plans on accessibility. Journal of Transport and Land Use, 6(3), 17–28. https://doi.org/10.5198/jtlu.v6i3.352
- Hägerstrand, T. (1970). What about people in regional science? Papers of the Regional Science Association, 24(1), 6–21. https://doi.org/10.1007/BF01936872
- Handy, S. (2005). Planning for accessibility: In theory and in practice. In D. M. Levinson & K. J. Krizek (Eds.), Access to destinations (pp. 131–147). Emerald Group. https://doi.org/10.1108/9780080460550-007
- Handy, S. (2020). Is accessibility an idea whose time has finally come? Transportation Research Part D: Transport and Environment, 83, 102319. https://doi.org/10.1016/j.trd.2020.102319
- Handy, S., & Niemeier, D. A. (1997). Measuring accessibility: An exploration of issues and alternatives. Environment and Planning A: Economy and Space, 29(7), 1175–1194. https://doi.org/10.1068/a291175
- Hansen, W. G. (1959). How accessibility shapes land use. Journal of the American Institute of Planners, 25(2), 73–76. https://doi.org/10.1080/01944365908978307
- Horner, M. W., & Downs, J. A. (2014). Integrating people and place: A density-based measure for assessing accessibility to opportunities. Journal of Transport and Land Use, 7(2), 23–40. https://doi.org/10.5198/jtlu.v7i2.417
- Imani, A. F., Miller, E. J., & Saxe, S. (2019). Cycle accessibility and level of traffic stress: A case study of Toronto. Journal of Transport Geography, 80, 102496. https://doi.org/10.1016/j.jtrangeo.2019.102496
- Kwan, M.-P. (1999). Gender and individual access to urban opportunities: A study using space–time measures. The Professional Geographer, 51(2), 211–227. https://doi.org/10.1111/0033-0124.00158
- Kwan, M.-P. (2010). Space-time and integral measures of individual accessibility: A comparative analysis using a point-based framework. Geographical Analysis, 30(3), 191–216. https://doi.org/10.1111/j.1538-4632.1998.tb00396.x
- Kwan, M.-P., & Hong, X. D. (1998). Network-based constraints-oriented choice set formation using GIS. Geographical Systems, 5(1–2), 139–162.
- Lättman, K., Olsson, L. E., & Friman, M. (2016). Development and test of the Perceived Accessibility Scale (PAC) in public transport. Journal of Transport Geography, 54, 257–263. https://doi.org/10.1016/j.jtrangeo.2016.06.015
- Lee, J., & Miller, H. J. (2018). Measuring the impacts of new public transit services on space-time accessibility: An analysis of transit system redesign and new bus rapid transit in Columbus, Ohio, USA. Applied Geography, 93, 47–63. https://doi.org/10.1016/j.apgeog.2018.02.012
- Lee, J., & Miller, H. J. (2019). Analyzing collective accessibility using average space-time prisms. Transportation Research Part D: Transport and Environment, 69, 250–264. https://doi.org/10.1016/j.trd.2019.02.004
- Levine, J., Grengs, J., & Merlin, L. A. (2019). From mobility to accessibility: Transforming urban transportation and land-use planning. Cornell University Press.
- Levine, J., Grengs, J., Shen, Q., & Shen, Q. (2012). Does accessibility require density or speed? Journal of the American Planning Association, 78(2), 157–172. https://doi.org/10.1080/01944363.2012.677119
- Levine, J., Merlin, L., & Grengs, J. (2017). Project-level accessibility analysis for land-use planning. Transport Policy, 53, 107–119. https://doi.org/10.1016/j.tranpol.2016.09.005
- Levinson, D., & King, D. (2020). Transport access manual: A guide for measuring connection between people and places. Committee of the Transport Access Manual, University of Sydney. https://ses.library.usyd.edu.au/handle/2123/23733
- Levinson, D. M., & Wu, H. (2020). Towards a general theory of access. Journal of Transport and Land Use, 13(1), 129–158. https://doi.org/10.5198/jtlu.2020.1660
- Li, Q., Zhang, T., Wang, H., & Zeng, Z. (2011). Dynamic accessibility mapping using floating car data: A network-constrained density estimation approach. Journal of Transport Geography, 19(3), 379–393. https://doi.org/10.1016/j.jtrangeo.2010.07.003
- Liao, F., & van Wee, B. (2017). Accessibility measures for robustness of the transport system. Transportation, 44(5), 1213–1233. https://doi.org/10.1007/s11116-016-9701-y
- Litman, T. (2020). Evaluating accessibility for transport planning: Measuring people’s ability to reach desired goods and activities. Victoria Transport Policy Institute. https://www.vtpi.org/access.pdf
- Lucas, K., van Wee, B., & Maat, K. (2016). A method to evaluate equitable accessibility: Combining ethical theories and accessibility-based approaches. Transportation, 43(3), 473–490. https://doi.org/10.1007/s11116-015-9585-2
- Malekzadeh, A., & Chung, E. (2020). A review of transit accessibility models: Challenges in developing transit accessibility models. International Journal of Sustainable Transportation, 14(10), 733–748. https://doi.org/10.1080/15568318.2019.1625087
- McCahill, C., Jain, S., & Brenneis, M. (2020). Comparative assessment of accessibility metrics across the U.S. Transportation Research Part D: Transport and Environment, 83, 102328. https://doi.org/10.1016/j.trd.2020.102328
- McCahill, C., Pettit, M., & Sinclair, C. (2017). Access scores: Measuring the why, where and how of accessibility. Citilabs. https://www.citilabs.com/citilabs_blog/access-scores-measuring-the-why-where-and-how-of-accessibility/
- Merlin, L. A., Levine, J., & Grengs, J. (2018). Accessibility analysis for transportation projects and plans. Transport Policy, 69, 35–48. https://doi.org/10.1016/j.tranpol.2018.05.014
- Miller, E. J. (2018). Accessibility: Measurement and application in transportation planning. Transport Reviews, 38(5), 551–555. https://doi.org/10.1080/01441647.2018.1492778
- Miller, H. J. (1991). Modelling accessibility using space-time prism concepts within geographical information systems. International Journal of Geographical Information Systems, 5(3), 287–301. https://doi.org/10.1080/02693799108927856
- Miller, H. J. (2005). Place-based versus people-based accessibility. In D. M. Levinson & K. J. Krizek (Eds.), Access to destinations (pp. 63–89). Emerald Group Publishing Limited. https://doi.org/10.1108/9780080460550-004
- Miller, H. J., & Wu, Y.-H. (2005). Place-based versus people-based accessibility. In D. M. Levinson & K. J. Krizek (Eds.), Access to destinations (pp. 63–89). Emerald Group. https://doi.org/10.1108/9780080460550-004
- Mondschein, A., Blumenberg, E., & Taylor, B. D. (2006). Cognitive mapping, travel behavior, and access to opportunity. Transportation Research Record: Journal of the Transportation Research Board, 1985(1), 266–272. https://doi.org/10.1177/0361198106198500129
- Mondschein, A., & Taylor, B. D. (2017). Is traffic congestion overrated? Examining the highly variable effects of congestion on travel and accessibility. Journal of Transport Geography, 64, 65–76. https://doi.org/10.1016/j.jtrangeo.2017.08.007
- Moya-Gómez, B., Salas-Olmedo, M. H., García-Palomares, J. C., & Gutiérrez, J. (2018). Dynamic accessibility using big data: The role of the changing conditions of network congestion and destination attractiveness. Networks and Spatial Economics, 18(2), 273–290. https://doi.org/10.1007/s11067-017-9348-z
- Neutens, T., Schwanen, T., & Witlox, F. (2011). The prism of everyday life: Towards a new research agenda for time geography. Transport Reviews, 31(1), 25–47. https://doi.org/10.1080/01441647.2010.484153
- Neutens, T., Witlox, F., Weghe, N. V. D., & Maeyer, P. H. D. (2007). Space–time opportunities for multiple agents: A constraint-based approach. International Journal of Geographical Information Science, 21(10), 1061–1076. https://doi.org/10.1080/13658810601169873
- Ong, P., & Blumenberg, E. (1998). Job access, commute and travel burden among welfare recipients. Urban Studies, 35(1), 77–93. https://doi.org/10.1080/0042098985087
- Páez, A., Mercado, R. G., Farber, S., Morency, C., & Roorda, M. (2010). Accessibility to health care facilities in Montreal Island: An application of relative accessibility indicators from the perspective of senior and non-senior residents. International Journal of Health Geographics, 9(1), 52. https://doi.org/10.1186/1476-072X-9-52
- Páez, A., Moniruzzaman, M., Bourbonnais, P.-L., & Morency, C. (2013). Developing a web-based accessibility calculator prototype for the greater Montreal area. Transportation Research Part A: Policy and Practice, 58, 103–115. https://doi.org/10.1016/j.tra.2013.10.020
- Páez, A., Scott, D. M., & Morency, C. (2012). Measuring accessibility: Positive and normative implementations of various accessibility indicators. Journal of Transport Geography, 25, 141–153. https://doi.org/10.1016/j.jtrangeo.2012.03.016
- Pan, Q., Jin, Z., & Liu, X. (2020). Measuring the effects of job competition and matching on employment accessibility. Transportation Research Part D: Transport and Environment, 87, 102535. https://doi.org/10.1016/j.trd.2020.102535
- Papa, E., Silva, C., Te Brömmelstroet, M., & Hull, A. (2015). Accessibility instruments for planning practice: A review of European experiences. Journal of Transport and Land Use, 9(3), 57–75. https://doi.org/10.5198/jtlu.2015.585
- Proffitt, D. G., Bartholomew, K., Ewing, R., & Miller, H. J. (2019). Accessibility planning in American metropolitan areas: Are we there yet? Urban Studies, 56(1), 167–192. https://doi.org/10.1177/0042098017710122
- Rubulotta, E., Ignaccolo, M., Inturri, G., & Rofè, Y. (2013). Accessibility and centrality for sustainable mobility: Regional planning case study. Journal of Urban Planning and Development, 139(2), 115–132. https://doi.org/10.1061/(ASCE)UP.1943-5444.0000140
- Shoup, D. C. (2003). Truth in transportation planning. Journal of Transportation and Statistics, 6(1), 1–16. https://www.bts.gov/archive/publications/journal_of_transportation_and_statistics/volume_06_number_01/paper_01/index
- Silva, C., Bertolini, L., Te Brömmelstroet, M., Milakis, D., & Papa, E. (2017). Accessibility instruments in planning practice: Bridging the implementation gap. Transport Policy, 53, 135–145. https://doi.org/10.1016/j.tranpol.2016.09.006
- SMART SCALE. (2020). SMART SCALE technical guide. http://smartscale.org/documents/2020documents/technical-guide-2022.pdf
- Stewart, A. (2019, October 3). Access in Seattle. Medium. https://blog.conveyal.com/access-in-seattle-fb5ef952c3ae
- Stewart, A., & Zegras, P. C. (2016). CoAXs: A collaborative accessibility-based stakeholder engagement system for communicating transport impacts. Research in Transportation Economics, 59, 423–433. https://doi.org/10.1016/j.retrec.2016.07.016
- Sundquist, E., McCahill, C., & Brenneis, M. (2021). Measuring accessibility: A guide for transportation and land use practitioners. State Smart Transportation Initiative.
- Te Brömmelstroet, M., Curtis, C., Larsson, A., & Milakis, D. (2016). Strengths and weaknesses of accessibility instruments in planning practice: Technological rules based on experiential workshops. European Planning Studies, 24(6), 1175–1196. https://doi.org/10.1080/09654313.2015.1135231
- Thomas, T., Mondschein, A., Osman, T., & Taylor, B. D. (2018). Not so fast? Examining neighborhood-level effects of traffic congestion on job access. Transportation Research Part A: Policy and Practice, 113, 529–541. https://doi.org/10.1016/j.tra.2018.04.015
- Vale, D. S., Saraiva, M., & Pereira, M. (2015). Active accessibility: A review of operational measures of walking and cycling accessibility. Journal of Transport and Land Use, 9(1), 209–235. https://doi.org/10.5198/jtlu.2015.593
- Vandenbulcke, G., Steenberghen, T., & Thomas, I. (2009). Mapping accessibility in Belgium: A tool for land-use and transport planning? Journal of Transport Geography, 17(1), 39–53. https://doi.org/10.1016/j.jtrangeo.2008.04.008
- van Wee, B. (2016). Accessible accessibility research challenges. Journal of Transport Geography, 51, 9–16. https://doi.org/10.1016/j.jtrangeo.2015.10.018
- van Wee, B., Hagoort, M., & Annema, J. A. (2001). Accessibility measures with competition. Journal of Transport Geography, 9(3), 199–208. https://doi.org/10.1016/S0966-6923(01)00010-2
- Vega, A. (2012). Using Place Rank to measure sustainable accessibility. Journal of Transport Geography, 24, 411–418. https://doi.org/10.1016/j.jtrangeo.2012.04.008
- Wachs, M., & Kumagai, T. G. (1973). Physical accessibility as a social indicator. Socio-Economic Planning Sciences, 7(5), 437–456. https://doi.org/10.1016/0038-0121(73)90041-4
- Wang, Y., Chen, B. Y., Yuan, H., Wang, D., Lam, W. H. K., & Li, Q. (2018). Measuring temporal variation of location-based accessibility using space-time utility perspective. Journal of Transport Geography, 73, 13–24. https://doi.org/10.1016/j.jtrangeo.2018.10.002
- Weber, J., & Kwan, M.-P. (2003). Evaluating the effects of geographic contexts on individual accessibility: A multilevel approach. Urban Geography, 24(8), 647–671. https://doi.org/10.2747/0272-3638.24.8.647
- Wu, H., & Levinson, D. (2020). Unifying access. Transportation Research Part D: Transport and Environment, 83, 102355. https://doi.org/10.1016/j.trd.2020.102355
- Yigitcanlar, T., Sipe, N., Evans, R., & Pitot, M. (2007). A GIS-based land use and public transport accessibility indexing model. Australian Planner, 44(3), 30–37. https://doi.org/10.1080/07293682.2007.9982586