
Abstract
Problem, research strategy, and findings
Big data promises new insights for planning but threatens to exclude community expertise from knowledge creation and decision-making processes. Participatory methods are needed to ensure that big data is marshaled to address problems of importance to communities, that hypotheses and interpretations are shaped by evidence from lived experience, and that results are ultimately useful to residents. In this study we used a participatory action research (PAR) framework to engage Boston (MA)–area residents in leveraging a longitudinal consumer credit database to understand shared planning challenges. We describe how residents, community organizations, and academic researchers collaborated to co-design an interactive map of residential moves across Massachusetts. The resulting estimates were largely consistent with residents’ understandings of local moving patterns, providing a case of big data analysis confirming, and further specifying, phenomena identified through centering lived experience. Collaborative data analysis also generated new insights; for example, showing misalignment between regional planning boundaries and low-credit movers’ moving patterns. This work shows how sustained PAR partnerships can combine the strengths of community expertise and big data analyses to inform planning.
Takeaway for practice
PAR with big data is feasible, combines the power of lived experience and large-scale quantitative analysis, and can mitigate the risks of exclusion that threaten emerging uses of big data.
Unprecedented improvements in wellbeing are possible, researchers have suggested, through the use of big data in planning. Smart cities, laced with sensors, enable real-time management of congestion, pollution, and other dynamic challenges (Catlett et al., Citation2017; Engin et al., Citation2019). Urban informatics, applying data science techniques to information that city agencies already collect, can inform scenario building and fill potholes on demand (Kontokosta, Citation2018; O’Brien, Citation2018). But ensuring that big data is marshaled to address problems of high importance to residents, that researchers understand the meaning of the patterns they detect, and that implications are clear depends on insights from communities themselves and on expertise gained through lived experience.
Because of barriers including restrictive access policies, high computing costs, and a lack of analytical expertise, community groups struggle to work with big data (Mah, Citation2017; Schweitzer & Afzalan, Citation2017). The term refers to data sets whose massive volume (number of observations), high velocity (frequency of updating), or complex variety (complicated structures) require resources that exceed the storage and memory of conventional computing tools (Batty, Citation2017; De Mauro et al., Citation2016; Kitchin & McArdle, Citation2016). Several planning research groups have engaged residents in big data initiatives (see Catlett et al., Citation2017; O’Brien, Citation2018; Williams, Citation2020), but “participatory” big data studies generally involve participation only to scale data collection or test end products (Whitman et al., Citation2018). These approaches cost big data–driven planning processes the benefit of community insight in how problems are identified and framed and risk deepening “epistemic injustices”—unfairness in how knowledge is produced—that contribute to inequitable outcomes (Boyd & Crawford, Citation2012; Schweitzer & Afzalan, Citation2017). But planning with big data need not be exclusionary or extractive; in this study, we show how academic and community partners can use participatory action research (PAR) methods with big data to share power and expertise throughout the knowledge creation process.
We report here on a PAR collaboration using the Federal Reserve Bank of New York/Equifax Consumer Credit Panel (CCP)—a database that Whitaker (Citation2018) described as “one of the oldest, most carefully maintained big-data data sets” (p. 285)—to better understand the spatial patterning of residential moves. We first provide a background on PAR and its potential for use with big data. We then introduce the Healthy Neighborhoods Research (HNR) Consortium and describe the Consortium’s participatory research process. We used an iterative approach to collaboratively construct and visualize neighborhood-level moving rates; we then applied a network detection methodology to identify highly connected communities. We report two main findings: 1) resident experiences are consistent with the geographic patterning of moves between neighborhoods and 2) these patterns are misaligned with existing regional planning boundaries for movers with low access to credit. In addition to traditionally recognized benefits associated with community-engaged research—including knowledge sharing and increased community control over knowledge production—our work shows that conducting PAR with big data introduces benefits that are newly urgent as planning increasingly relies on urban analytics to inform practice. PAR analysis of big data can expand community capacity to create and critique new data products, increase quantitative researchers’ literacy with qualitative data and experiential knowledge, and improve planners’ understanding of limits to big data insights.
Background
How PAR Can Address the Challenges of Engaging Communities in Big Data
PAR is an approach to inquiry that seeks to center those most affected by the phenomena under investigation in each phase of research and to use co-produced knowledge for action that improves the community’s social and material conditions (Greenwood & Levin, Citation2007; Reason & Bradbury, Citation2008). PAR emerged from the efforts of Latin American social movement leaders to build power by developing “critical consciousness,” as well as the work of American psychologists to deepen democracy via new forms of applied research and pedagogy (Dewey, Citation1954; Fals-Borda, Citation1987; Freire, Citation2000; Lewin, Citation1946). An epistemology rather than a methodology, PAR uses a variety of qualitative and quantitative methods according to the community’s research questions and action goals.
For planning scholars, PAR offers an approach that can foster deep community participation in making empirical claims about the world. PAR aligns with aspects of the advocacy, communicative, and radical planning traditions inasmuch as they respond to the consequences of top-down, technocratic planning by shifting power toward those who have been under-represented in—and often harmed by—planning processes (Davidoff, Citation1965; Innes, Citation1995; Miraftab, Citation2009). Planners can use PAR to a) increase community participation across all phases of a research project; b) increase the relevance, reach, and rigor of planning inquiry; and c) ensure that research contributes to place-based, community-led action (Balazs & Morello-Frosch, Citation2013; Greenwood & Levin, Citation2007; Kindon et al., Citation2007).
Although PAR approaches have the potential to support community-engaged big data research, PAR initiatives have tended to focus on the collection of primary data, meaning that existing studies generally use small data sets. We found one study that used PAR to work with a larger secondary data set (Morello-Frosch et al., Citation2013), but we were unable to find examples of PAR teams analyzing big data. This may reflect the fact that participation is often lowest in the analysis phase of community-based projects, which is the locus of sense-making with big data (Spears Johnson et al., Citation2016). Existing “participatory” research with big data has also tended to confine community members to a role as users of data products rather than as leaders of the research process with power over its trajectory and outcomes (Whitman et al., Citation2018). We argue that a PAR approach can enable community participation and build community power in at least three stages of big data research: 1) choosing and accessing the data sets, 2) making methodological decisions in collaboration with data scientists, and 3) interpreting and acting on results.
First, PAR fosters relationships with academic researchers that community members may need to identify and gain access to restricted-use data sets. Community groups often encounter difficulties accessing large government or business data sets because of sociopolitical power imbalances, epistemological differences in data needs and uses, and structural barriers like inadequate funding or a lack of institutional review board access (Elwood, Citation2008; Mah, Citation2017). Second, recognizing that access to data does not guarantee meaningful community use, PAR enables community members and researchers to collaborate on key methodological decisions. Finally, PAR enables everyone engaged in the research to interpret and use results. The research is undertaken to act; involving community residents in interpreting data grounds findings in local context, ensuring that results enable communities to advance their advocacy and organizing efforts (Torre et al., Citation2012).
PAR has limitations. It is time consuming and often challenging to build trusting relationships between academic and community partners, to manage each stakeholder’s priorities and constraints, and to facilitate collaboration between people with a range of different formal educational and research experiences (Reason & Bradbury, Citation2008). The approach is also resource intensive, given the need to properly compensate community members and intermediary organizations, and requires flexible funding and long research time frames (Minkler et al., Citation2003). On top of these challenges, PAR teams must grapple with the limitations of the specific research methods that they employ. But planners should not expect easy solutions to the difficult problems associated with meaningful community engagement. Because PAR partnerships rest on shared priorities in the form of collectively agreed-upon research questions, methods, and action-oriented outputs, the approach can serve as a model for building research partnerships that help to address imbalances of power inherent in the increasing use of big data.
Methods
The HNR Consortium’s PAR Process
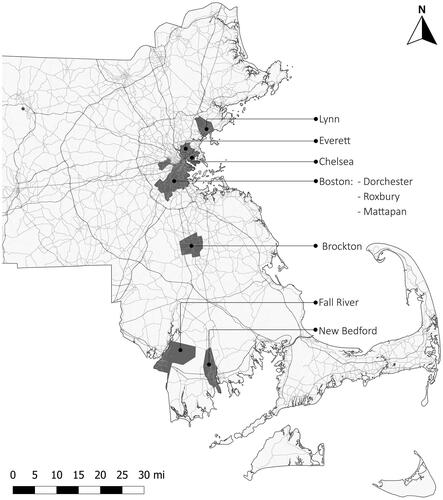
The HNR Consortium is a network of academic researchers, partners from community-based organizations, regional advocacy organizations, government agencies, and residents of nine neighborhoods in the greater Boston (MA) area (). Members have spent more than 5 years engaged in the Healthy Neighborhoods Study, a longitudinal PAR study focused on the relationship between urban development and community health (Arcaya et al., Citation2018, Citation2020; Binet et al., Citation2019; The Healthy Neighborhoods Study, Citation2020). Through the study, 45 resident researchers—current or recent residents of the study neighborhoods ranging broadly in age, background, life experiences, languages spoken, and history in their communities—collaborate with academic researchers, leaders of community-based organizations, and representatives from public agencies across all phases of the research process.
Figure 1. Massachusetts places represented by the Healthy Neighborhoods Research Consortium.
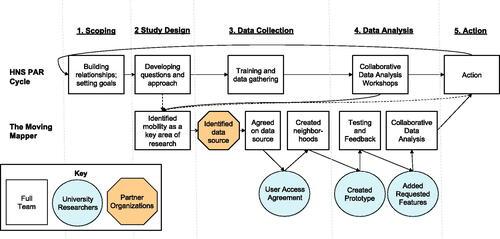
The Consortium’s PAR process comprises five phases, which are repeated on a roughly annual basis (). First, the research team builds partnerships with community-based organizations in each of the nine study neighborhoods and works with these partners to recruit resident researchers. Community partner organizations include housing and environmental justice nonprofits, community development corporations, neighborhood associations, and other organizations with active initiatives in health, housing, or environmental justice. Second, resident researchers, academic researchers, and community partner organizations participate in facilitated collaborative research design workshops to set a shared agenda, develop research questions, and design data gathering instruments. Then, after methods and ethics training, resident researchers develop sampling plans and collect data in their communities. Fourth, the team analyzes the resulting data. In this phase, academic researchers generally carry out steps such as data cleaning and using analysis software and making key decisions about methods and interpretation jointly with residents, community partners, and academics via collaborative data analysis workshops. Finally, team members apply results through community-specific action plans as well as collaborative regional initiatives.
Figure 2. The research approach of the Healthy Neighborhoods Study (top row), as applied to the development of the Moving Mapper tool (bottom row).
Research Question
Throughout initial HNR Consortium PAR cycles, resident researchers and community partner organizations highlighted residential moves as a key factor shaping the relationship between development and health. Academic and resident researchers discussed how most existing research at that time examined displacement using rates of outmigration, without attention to geographic patterning in destination locations (Ding et al., Citation2016; Ellen & O’Regan, Citation2011; Freeman, Citation2005; Freeman & Braconi, Citation2004). In response, several resident researchers shared a common experience of people being pushed out of HNR communities for various reasons and ending up in a predictable set of places. They described feeling like an “invisible train” was moving people outward from their neighborhoods to a geographically patterned, predetermined set of destinations. Resident researchers hypothesized that there were common spatial patterns in residential moves in their neighborhoods. This insight informed the first step of the Moving Mapper project: the development of specific research questions on residential moves (Phase 2 in ). In particular, the Consortium sought to examine the extent to which individual-level experiences of moving and displacement were consistent with larger neighborhood- and regional-scale moving patterns.
Data Collection
IDENTIFICATION OF KEY DATA SOURCE
Although resident researchers suspected that moving experiences followed common spatial trajectories, they did not have access to data to test their hypothesis. Existing publicly available data sets like the Internal Revenue Service county–county flows or the American Community Survey mobility estimates do not include neighborhood-scale data on residential moves (Hauer & Byars, Citation2019). Primary data collection—with the Healthy Neighborhoods Study survey tool, for example—could not offer evidence on people who had moved away from affected neighborhoods. To identify a data source that could offer insight on their research question (Phase 3 in ), community partner organizations and academic researchers in the HNR Consortium suggested potential data sources that contained fine-grained moving data. Ultimately, members of the Consortium agreed to seek and obtain access to the CCP.
The CCP is a research data set constructed from consumer credit transactions that includes longitudinal individual-level location data, enabling never-before-possible research on moving patterns at fine geographic scales (Ding & Hwang, Citation2016; Ding et al., Citation2016; Whitaker, Citation2018). The underlying consumer credit data is “big” along key dimensions including volume—coverage of all U.S. adults with a credit history and a social security number—and velocity, with continuous updating that reflects billions of credit transactions (Kitchin & McArdle, Citation2016). As a research product constructed from these consumer credit transactions for a 5% sample of all individuals every quarter (Lee & Van der Klaauw, Citation2010), the CCP is considered big data because it comprises quarterly observations on numerous financial variables for more than 13 million individuals (Whitaker, Citation2018). Data from the CCP are anonymous, and do not include data on race. Academic researchers used a restricted-access computing cluster at the Federal Reserve Bank of Boston to apply standard data-cleaning protocols following previous research (Ding & Hwang, Citation2016; Ding et al., Citation2016). After data were further limited just to adults who had lived in Massachusetts for at least four consecutive quarters between 2009 and 2019, the final analytic sample included 1,868,944 person-year observations for 258,680 individuals.
The selection of the data source was not an easy decision. Resident researchers raised questions about the meaning of the variables in the data set, noting that although low credit scores may indicate economic disadvantage for some, for others they may reflect a refusal to pay certain unjust bills. The team agreed to treat the metric as a proxy for access to credit and not as a measure of a person’s socioeconomic status. Resident researchers also questioned the extent to which the sample would be representative of their communities. These concerns reflected the fact that approximately 10% of the population do not have credit records or social security numbers and thus are not included in the data (Brevoort et al., Citation2015). These “credit invisibles” are disproportionately likely to be immigrants and people of color, who comprise the study’s population of focus. Academic researchers acknowledged these limitations and explored them empirically, finding that county- and state-level moving patterns constructed with the CCP were nevertheless comparable with estimates constructed from “gold standard” American Community Survey and Internal Revenue Service estimates (DeWaard et al., Citation2019). Resident researchers and community partner organizations concluded that, despite their limitations, these data were the best available source of neighborhood-level insight. Notably, this conversation also served to help academic and community researchers build a shared understanding of the problem of veracity, the existence of bias or noise that is so common in big data that it is sometimes considered to be a defining attribute (De Mauro et al., Citation2016).
COLLABORATIVE DEVELOPMENT OF NEIGHBORHOODS
In addition to identifying a source of data on residential moves, the team sought to identify locally meaningful geographies to which individuals’ locations, identified as census blocks, could be linked. First, the Consortium reached consensus on criteria for designating geographic aggregation boundaries for analysis, which included a) building on geographic designations already in use by practicing urban planners and policymakers in the region, b) ensuring sufficiently small geographic areas to allow for variation in transit access across places, and c) acknowledging socially meaningful distinctions between built form and socioeconomic environments.
To operationalize the approach, academic researchers contacted each of the largest 15 municipalities in the state to obtain city-specific neighborhood definitions.Footnote1 For all other cities and towns, jurisdictions of the 12 Massachusetts planning agencies were overlaid with the Metropolitan Area Planning Council’s (MAPC’s) community types. This typology differentiates rural towns, developing or maturing suburbs, regional urban centers, and inner-core metropolitan communities based on housing and land use patterns as well as recent and projected development trends (MAPC, Citation2008). The result is a novel set of areal units, which we will loosely term neighborhoods from here on, based on urbanicity and region as well as on community partner organizations’ need for geographies aligned with the jurisdictional boundaries of existing planning agencies.
Data Analysis
PROTOTYPE DEVELOPMENT
The Consortium’s original request was for raw estimates of moving flows between neighborhoods. However, in analyzing the data, academic researchers suggested four main changes to the research design.
First, upon aggregating moves across pairs of origin and destination neighborhoods, preliminary results indicated that differences in flows were driven largely by differences in neighborhoods’ population sizes. To resolve this problem, academic researchers calculated population-adjusted moving rates rather than raw flows.
Second, to protect anonymity, estimates had to be suppressed for all flows of fewer than 50 movers. However, suppressing the data led to many pairs of communities with missing data. Adapting approaches developed for small-area health estimates (Ashby, Citation2006), we calculated a small-area moving ratio (SMvR) to identify neighborhoods that received larger in- or outflows than would be expected if moving flows were proportional to population. SMvRs were estimated through a model-based approach recognizing that neighboring places were more likely to have similar moving flows than were geographically disparate places (Besag et al., Citation1991; Tobler, Citation1970). Academic researchers calculated estimates separately for all destinations, conditional on a given origin, and for all origins, conditional on a given destination (see Daepp, Citation2020, for details).
This approach produced nearly 8,000 estimates (results for 89 × 88 unique origin–destination pairs). It became apparent that standard data products—a publication or series of data tables—would not meet the Consortium’s need for both shared insight and usable estimates specific to each HNR community. This led to a third change in the research design: a proposal to create an interactive mapping tool to facilitate Consortium members’ ability to interpret and use the data. All Consortium members approved this suggestion in a working group meeting.
Finally, a stated need of the community partners was to examine the extent to which individual-level experiences of displacement aligned with larger regional-scale patterns in residential moves. To address this request, academic researchers used a network detection methodology to empirically derive clusters of connected communities. Briefly, the approach grouped together neighborhoods that people tend to move between and separated those places that were less likely to be connected by moves. Academic researchers used the Infomap algorithm (Rosvall et al., Citation2009; Rosvall & Bergstrom, Citation2008), which performs well in detecting communities using directed and weighted network data (Lancichinetti & Fortunato, Citation2012; Zhong et al., Citation2014). Through this work, the HNR Consortium sought to show how the estimates underlying the Moving Mapper could be used to empirically identify clusters of highly connected communities.
TESTING AND FEEDBACK
Just as academic researchers reshaped the original research design, resident researchers reshaped the analyses in response to the preliminary results. Upon seeing a prototype of the interactive mapping tool during a user-testing workshop, resident researchers emphasized the importance of stratifying results according to socioeconomic advantage. The academic team revised the analyses using Equifax Risk Scores as a proxy for individual-level socioeconomic advantage.Footnote2 Credit scores should be interpreted with caution given evidence that scores differ by race, even after adjusting for individual-level differences (Cohen-Cole, Citation2011), a concern highlighted by resident researchers, several of whom noted that their own credit scores did not reflect their present circumstances. Nevertheless, the team decided to stratify by credit score because it was the best available measure of economic disadvantage, given the lack of individual income data in the CCP, and because resident researchers felt it would be misleading not to differentiate between economically advantaged and disadvantaged movers. Academic researchers revised the prototype mapper to include stratified flows and applied the community detection methodology separately for movers with high versus low Equifax Risk Scores to see whether and how places were connected differently for movers according to their access to credit.
COLLABORATIVE DATA ANALYSIS
Upon completing the development of the Mapper, academic researchers facilitated a series of workshops with resident researchers and representatives from community partner organizations in seven of the nine study neighborhoods.Footnote3 All workshop participants were previously involved in various phases of the HNR Consortium’s PAR cycle, including instrument design, data gathering, analysis, and community knowledge share-backs. The goals of these workshops were twofold: 1) to show participants how to use the Moving Mapper to analyze residential moving patterns for specific communities and 2) to engage participants in discussion about how they might use the Moving Mapper in their own work. Through this discussion, we examined how the final tool helped residents make sense of moving patterns in and out of their communities, as well as how this knowledge informed understandings of the challenges their communities share with other places.
Workshops were 25 min long and conducted as part of a longer collaborative data analysis session. Each workshop was broken into three sections: an introduction to the tool, exploring data specific to participants’ community, and comparing the participants’ community with others of their choice. We facilitated the workshops with the assistance of other study personnel and conducted via videoconference due to the COVID-19 pandemic. We further conducted thematic content analysis of the workshop recordings to identify a) common themes across the seven communities’ workshops and b) key insights and lessons from each community’s workshop.
Limitations
Our work was subject to several limitations. First, we did just one round of prototyping and feedback given the considerable academic time and resources needed to respond to resident researcher suggestions. In future initiatives, we suggest increasing the number of iterations because these sessions were key to the emergence of resident-generated ideas for analytical refinement. Second, the group of resident researchers who established the research question and made some of the initial methodological decisions overlapped only partially with the group who participated in the collaborative data analysis process because of turnover, including changes related to displacement. Third, access to the raw data was contingent upon time-constrained institutional agreements, limiting our ability to update the Mapper moving forward. Finally, this work was only possible because of pre-existing partnerships with neighborhood residents and a track record of success conducting collaborative research (Arcaya et al., 2018; Binet et al., Citation2019; Everett Community Health Partnership, GreenRoots, MIT CoLab, & Research Action Design, Citation2020). Our approach may not be easily replicable by planners or scholars without a similar foundation. However, we also contend that building the infrastructure for long-term participation in planning research is crucial for researchers and practitioners seeking to mitigate epistemic injustice in planning.
Results
Interactive Visualization Enables Comparison of Evidence From Lived Experience and From Big Data
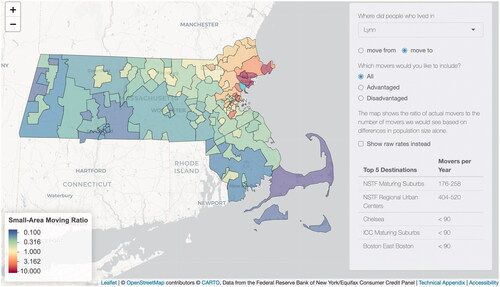
The primary product of this research is the Moving Mapper, a web-based tool that enables users to examine the connections between destinations and origins for movers from any neighborhood in Massachusetts. The app, shown in and available at http://hns.media.mit.edu/, allows the user to select a neighborhood from a drop-down menu. Users can then see a map of SMvRs either for the destinations of movers leaving the selected neighborhood or for the origins of arrivals to the selected neighborhood. Users can toggle between maps constructed with data for all movers, economically advantaged movers only, or economically disadvantaged movers only.
Figure 3. The Moving Mapper website visualizes moving patterns from Lynn, one of the Healthy Neighborhoods Study areas. The panel in the top right corner allows users to select neighborhoods as origins versus as destinations in relation to all other Massachusetts neighborhoods. Users can choose to view small-area moving ratios overall or separately for movers with high versus low access to credit.
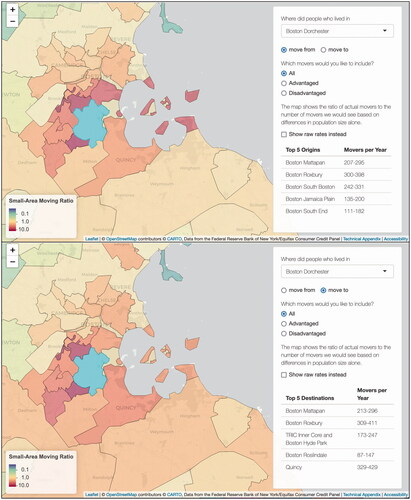
From the perspective of participants in the collaborative data analysis workshops, much of what the Moving Mapper revealed aligned with individual-level understandings of residential moving patterns. Notably, resident researchers were able to interpret the data with the additional context of local lived experience. For example, shows Dorchester, a historically Black neighborhood of Boston, selected as the destination (top panel) and as the origin (bottom panel). Resident researchers from Dorchester were not surprised to see that nearby neighborhoods of Roxbury and South Boston were the top two sources of movers into their community because they understood both neighborhoods to be increasingly unaffordable places subject to gentrification pressures. A workshop participant whose community had recently experienced an increase in movers speaking Haitian Creole observed that Moving Mapper results showed migration to her city from areas with a high density of Haitian Creole speakers and that seeing this data earlier could have helped the school district better prepare for new language needs. That is, the resident researchers’ understanding of local immigration patterns enabled them to layer their knowledge with the evidence from the Mapper to produce actionable insights. An additional benefit of the tool emerged, resident researchers noted, in testing and complementing knowledge gained from lived experience with quantitative evidence with high credibility among decision makers. However, it is important to recognize that it should not take a multiyear PAR process for knowledge associated with lived experience to be recognized as an actionable form of data.
Figure 4. Zoomed-in view of the Moving Mapper website for the Boston neighborhood of Dorchester (highlighted). The top panel shows small-area moving ratios for moves into Dorchester; the bottom panel shows small-area moving ratios for moves out of Dorchester.
In the process of analyzing these results collaboratively, the research team was also able to identify new directions for research. For example, resident researchers suggested that the availability of senior housing might affect older adults’ moves, suggesting a need for further analyses stratifying flows by age in addition to economic factors. Similarly, resident researchers from Dorchester wanted to know more about the influence of housing subsidies on moving patterns, adding that these factors might explain patterns of exchange between Dorchester and Roxbury because there is a significant amount of subsidized housing in the latter neighborhood. In future PAR cycles, these insights could be used for research extensions such as collaboratively deciding the predictors to be included in a regression analysis. The many new questions that these data opened for the HNR Consortium point to a need for continued collaboration and further research.
Iteration With Resident Requests Surfaces New Insights About Planning Geographies
Academic researchers extended the analyses, based on facilitated conversations with all Consortium members, to identify clusters of interconnected neighborhoods. The academic researchers first produced clusters detected from all movers’ data. They then compared results with the existing boundaries of the 13 regional planning agencies (RPAs) that serve Massachusetts (, left panel). RPAs coordinate local government responses to challenges that cut across municipal boundaries; residential moving patterns are important both as critical inputs for these tasks and as outcomes likely to be strongly affected by, for example, changes in transportation planning or land use policies. Academic researchers hypothesized that the regions RPAs represent should align with existing communities of connected places; indeed, they observed similar results between the empirically detected clusters and existing RPA boundaries (, right panels).
Figure 5. The left panel shows the boundaries of the RPAs that serve Massachusetts. The right panels show neighborhoods colored and numbered according to the empirically detected communities within which people move, using data just for movers with high Equifax Risk Scores (top right panel) and movers with low Equifax Risk Scores (bottom right panel).
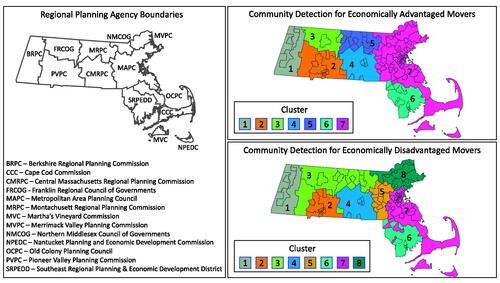
However, when—as requested by resident researchers—academic researchers ran the approach separately for economically advantaged versus disadvantaged movers, notable differences emerged. A comparison between RPA boundaries and empirically detected communities () shows that, for economically advantaged individuals, moving patterns generally align with existing regional jurisdictions in the middle and western areas of the commonwealth: clusters 1 through 6 each coincide with existing RPAs.Footnote4 For economically disadvantaged movers, however, a single cluster (cluster 3) comprises parts of several rural RPA jurisdictions in the western part of the state. This includes, in the southwestern part of Massachusetts, a set of areas that MAPC (Citation2008) classifies as rural towns, so that cluster 2 is limited to the city of Springfield and its suburbs. In Springfield, this divergence suggests, disadvantaged individuals move within a geographic region more tightly confined to urban and suburban neighborhoods in comparison with the larger urban, suburban, and rural region to which more advantaged individuals have access.
Empirically detected clusters also differed for advantaged versus disadvantaged movers in the areas surrounding greater Boston. For economically advantaged people and for movers overall, we see a single, well-connected metropolitan region (cluster 7 in , top right panel). In contrast, the moves of economically disadvantaged people were characterized by multiple smaller, geographically constrained communities (clusters 5, 7, and 8 in , bottom right panel). In the Boston metropolitan area, as well as in the area surrounding the city of Springfield, existing RPA boundaries are less aligned with the regions within which people actually circulate, with important differences in the type of divergences observed for socioeconomically advantaged versus for disadvantaged movers.
The detected communities were again consistent with resident researchers’ experiences. Resident researchers from Fall River, a town near the border between Rhode Island and Massachusetts, noted that the combination of a lack of economic opportunity and transportation barriers in the region means that many people with lower incomes do not have the option of leaving the area. Overall, they suggested, the map represented people stuck in place. This insight is consistent with extensive evidence suggesting that disadvantaged movers are often stuck within small spatial areas due to factors including transportation barriers, housing discrimination, and the dearth of affordable rental housing outside of urban areas (de Souza Briggs, Citation2005; Rothstein, Citation2017; Schuetz, Citation2009; Sharkey, Citation2013).
The results also produced insights specific to the different communities represented in the HNS Consortium. For example, New Bedford and Fall River were contained within a single cluster (cluster 6) differentiated from the Boston metropolitan area (cluster 7). By contrast, Brockton—an inner core city south of Boston—was included in cluster 7 for both economically advantaged and disadvantaged movers. Although Brockton is an important destination for movers from Boston neighborhoods, it is part of a different RPA and thus separated from the rest of the metropolitan area in decision making about transportation and housing plans. Regarding the particular issue of moving patterns, the challenges Brockton residents face may be more aligned with the displacement concerns of urban neighborhoods like Dorchester and Roxbury in Boston than with the immobility issues of outer core towns like Fall River and New Bedford. For resident researchers and community partners, the network detection approach thus offers the potential to identify organizing partners in places facing shared challenges concerning moving patterns, which is an ongoing aim of the multijurisdictional Consortium.
Discussion
From Data Access to Data Literacy: The Benefits of Collaborative Iteration
Here we describe the use of a PAR approach with big data to examine moving patterns at the neighborhood scale. Our work was characterized by an iterative back-and-forth between academics and resident researchers. When scoping the study, the Consortium determined the research question based on the important knowledge gap that resident researchers and community partner organizations highlighted in the previous cycles of our PAR process. Community partners and academic researchers were then able to identify a novel data set that could provide insights specific to the Consortium’s research priorities. In selecting the data, the Consortium discussed the data set’s limitations extensively. This ongoing dialogue was especially important because the data source used in this research, consumer credit data, has a prominent and long history of extractive and racist use (Nelson, Citation2010; Rothstein, Citation2017). By building a shared understanding of the limitations and advantages of a novel data source, we sought to move from “data access” toward “data literacy,” expanding community capacity to create, use, and critique new planning tools and information (Bhargava et al., Citation2015).
Our iterative approach helped to foster remixing practices, or planning approaches in which local and expert knowledge are “sampled, looped and layered”—creatively combined—in ways that subvert traditional delineations of expert and grassroots roles in planning processes (Roberts & Kelly, Citation2019, p. 306). For example, when resident researchers identified locally meaningful neighborhood definitions to link with individual locations in the data set, academic researchers had to develop a new population-adjusted metric to account for the variance in population across neighborhoods. Although this approach introduced methodological challenges, it also enabled us to address differences in how residents and academic researchers perceived spatial boundaries. Similarly, resident researchers’ requests that results be stratified by socioeconomic advantage revealed important differences in the clusters of communities most tightly connected by moving flows. As a direct result of resident researchers’ recommendations, we observed that the alignment with existing political and planning boundaries differed for moves by people with high versus low credit scores. These findings highlight a complementary form of data literacy that was strengthened for the academic researchers and practicing planners on the team: literacy in experiential knowledge and its value and use in shaping analyses and the interpretation of results.
Making Inroads on Undone Science
Combining resident and academic researchers’ respective types of expertise allowed us to collaboratively address a domain of what Frickel et al. (Citation2010) call “undone science”: areas of research that are incomplete or underfunded but that civil society groups see as worthy of more research. In this case, resident researchers insisted that researchers account for origins and destinations in studying residential displacement, rather than simply examining rates of moves. PAR afforded a specificity of attention to how resident researchers framed their questions and concerns that helped resident and academic researchers collaboratively make inroads on the “undone science” about displacement. By showing how PAR can be used with big data, our work also offers a method for planners seeking to engage communities in the choices, easily obscured in computational analyses with large-scale data sets, that shape how planners and their constituents understand the challenges they are trying to address (Boyd & Crawford, Citation2012; Schweitzer & Afzalan, Citation2017).
The HNR Consortium’s PAR process is novel in that it supports deep collaboration between academic and resident researchers in every stage of research with big data, especially in the development of the research question, the analysis, and the interpretation of the results. Our work contributes, however, to a broader body of research and practice exploring participatory or grassroots efforts to expand community power over data analysis and use (Costanza-Chock, Citation2020; D’Ignazio & Klein, Citation2020; Williams, Citation2020). Our approach is thus one of a growing menu of options for planning scholars seeking to build more equitable modes of planning research and practice with big data.
Conclusion and Takeaways for Practice
In this study we describe the work of a PAR consortium to develop new insights for planning research and practice using big data. Resident researchers collaborated with academic researchers to develop the research question, select an appropriate data set, determine areal units, shape the analytical approach, and interpret results. Through this research, we created a web-based tool that enabled resident researchers to compare experiential knowledge with spatial patterns in residential moving trajectories. The application of a community detection algorithm further identified misalignment between planning boundaries and the areas within which low-credit-access movers were most likely to circulate, opening new questions about the different constraints people face in moving to a new destination. Our work offers evidence that PAR analysis of big data is feasible and can increase the ability of community members to create, use, and critique new big data applications.
For scholars and practitioners, our work offers an example of how building trusting, long-term relationships with community partners based on a shared theory of change can enable collaborative and actionable research with big data. Our approach requires a commitment to co-creating hypotheses, addressing respective information needs, and sharing decision-making power. We also recommend a cyclical research process, which promotes opportunities for iteration, enables waves of participation over time, and reduces resident fatigue and burnout. We have created a guide for researchers and planners seeking resources on how to develop and sustain similar partnerships (see The Healthy Neighborhoods Study, Citation2020). Ultimately, however, institutional changes—governmental commitments to make data open and accessible, funding institutions that consider the capacity and resources needed to coordinate partner engagement, and academic institutions that value and reward participatory research—will also be needed to build more equitable modes of planning with big data. Although big data offers opportunities to create interactive tools and to make new inroads on undone science, it is also being exploited to draw new boundaries between experts and laypeople and between quantitative data with political currency and experiential data that are more easily ignored. Recognizing that planners who use big data need new models for engaging communities, our work shows how sustained, action-oriented research partnerships can serve as a platform for centering community expertise in the use of big data to address planning challenges.
ACKNOWLEDGMENTS
We thank members of the HNR Consortium, including resident researchers and site coordinators, past and present, who participated in Moving Mapper workshops: Reggie Abraham, Dina Abreu, Arnetta Baty, Carl Baty, Jose Carlos dos Santos, Yrma Fiestas, Josée Genty, Robyn Gibson, Goldean Graham, Bryan Hernandez, Stephanie Hernandez-Alvarado, Isaac Hodes, Jasmin Lainez, Gail Latimore, Shakaya Moore-Perkins, Alanis Muñoz, Kathleen O’Brien, Lisa Owens, Jary Perez, Marcia Picard, Maria Belen Power, Maria Daluz Ramos, Azan Reid, Ronel Remy, Gail Roderigues, Celinet Sanchez, Andrew Seeder, Ramon Sepulveda, Karen Sikora, Andrea Tulloch, Dave Underhill, and Katherine Zelaya; past and present community partner organizations who informed the mapper’s development: Dudley Street Neighborhood Initiative, Alternatives for Community and Environment, Codman Square Neighborhood Development Corp., Mattapan Food and Fitness Coalition, GreenRoots, Everett Community Health Partnership, Lynn United for Change Empowerment Project, CityLife/Vida Urbana, Massasoit Community College, Greater Fall River Partners for a Healthier Community, and Voices for a Healthy South Coast; our nonprofit and public agency partners, including the Massachusetts Department of Public Health, the Metropolitan Area Planning Council, and the Conservation Law Foundation; and staff who supported workshops: Reann Gibson, Yael Nidam, and Rebecca Houston-Read. We are also grateful to Devin Michelle Bunten, Joseph Doyle, Albert Saiz, Yonah Freemark, Erin Graves, Tamar Kotelchuk, and Colleen Dawicki for comments and to Kavya Vaghul, Yael Nidam, and Duncan Kincaid for technical support.
Research Support
The lead author (M. I. G. D.) was supported by a National Science Foundation Graduate Research Fellowship under Grant No. 1122374 as well as a research fellowship from the Federal Reserve Bank of Boston. The HNR Consortium was supported by the Robert Wood Johnson Foundation under grant no. 72369.
Data Availability Statement
The data underlying the Moving Mapper were obtained from the New York Federal Reserve Bank/Equifax Consumer Credit Panel, which can be accessed by authorized users. The processed Moving Mapper data set is available from the authors upon request.
Additional information
Notes on contributors
Madeleine I. G. Daepp
MADELEINE I. G. DAEPP ([email protected]) is a senior researcher at the Urban Innovation Initiative at Microsoft Research.
Andrew Binet
ANDREW BINET ([email protected]) is a PhD candidate in the Department of Urban Studies and Planning at the Massachusetts Institute of Technology (MIT).
Vedette Gavin
VEDETTE GAVIN ([email protected]) is a senior research consultant at the Conservation Law Foundation.
Mariana C. Arcaya
MARIANA C. ARCAYA ([email protected]) is an associate professor in the Department of Urban Studies and Planning at MIT.
MADELEINE I. G. DAEPP ([email protected]) is a senior researcher at the Urban Innovation Initiative at Microsoft Research.
Notes
1 Any neighborhood with fewer than 10,000 residents was further combined with its smallest adjacent neighbor. For several cities in which most neighborhoods had fewer than 10,000 residents (Brockton, Chelsea, Fall River, Lawrence, Lowell, Lynn, Newton, and Quincy), all neighborhoods were combined within the municipality.
2 Individuals with scores above 650 are considered to have “high” access to credit (economically advantaged), whereas those with scores below 650 are considered to have “low” access to credit (economically disadvantaged). Note that the Equifax Risk Score is based on a slightly different algorithm than the commonly used FICO score and thus has a slightly different range (280–850 versus 300–850 for FICO scores).
3 Workshops were facilitated for study personnel from Dorchester, Fall River, New Bedford, Chelsea, Lynn, Everett, and Mattapan. The teams from Roxbury and Brockton were unable to convene due to scheduling challenges related to the COVID-19 pandemic.
4 There is one exception: the town of Mansfield is under the jurisdiction of the Southeast Regional Planning & Economic Development District, which otherwise coincides with cluster 6. However, Mansfield is included in cluster 7 rather than in cluster 6.
References
- Arcaya, M. C., Nidam, Y., Binet, A., Gibson, R., & Gavin, V. (2020). Rising home values and Covid-19 case rates in Massachusetts. Social Science & Medicine (1982), 265(113290), 113290. https://doi.org/https://doi.org/10.1016/j.socscimed.2020.113290
- Arcaya, M. C., Schnake-Mahl, A., Binet, A., Simpson, S., Church, M. S., Gavin, V., Coleman, B., Levine, S., Nielsen, A., Carroll, L., Ursprung, S., Wood, B., Reeves, H., Keppard, B., Sportiche, N., Partirdge, J., Figueora, J., Frakt, A., Alfonzo, M., … Youmans, T. (2018). Community change and resident needs: Designing a Participatory Action Research study in Metropolitan Boston. Health Place, 52, 221–230. https://doi.org/https://doi.org/10.1016/j.healthplace.2018.05.014
- Ashby, D. (2006). Bayesian statistics in medicine: A 25 year review. Statistics in Medicine, 25(21), 3589–3631. https://doi.org/https://doi.org/10.1002/sim.2672
- Balazs, C. L., & Morello-Frosch, R. (2013). The three Rs: How community-based participatory research strengthens the rigor, relevance, and reach of science. Environmental Justice, 6(1), 9–16. https://doi.org/https://doi.org/10.1089/env.2012.0017
- Batty, M. (2017). Data about cities: Redefining big, recasting small. In R. Kitchin, T. P. Lariault, & G. McArdle (Eds.), Data and the city (1st ed., pp. 31–43). Routledge. https://doi.org/https://doi.org/10.4324/9781315407388
- Besag, J., York, J., & Molli⏧, A. (1991). A Bayesian image restoration with two applications in spatial statistics. Annals of the Institute of Statistical Mathematics, 43(1), 1–59. https://doi.org/https://doi.org/10.1007/BF00116466
- Bhargava, R., Deahl, E., Letouze, E., Noonan, A., Sangokoya, D., Shoup, N. (2015). Beyond data literacy: Reinventing community engagement and empowerment in the age of data. Data-Pop Alliance White Paper Series. https://hdl.handle.net/1721.1/123471
- Binet, A., Gavin, V., Carroll, L., & Arcaya, M. C. (2019). Designing and facilitating collaborative research design and data analysis workshops: Lessons learned in the healthy neighborhoods study. International Journal of Environmental Research and Public Health, 16(3), 324. https://doi.org/https://doi.org/10.3390/ijerph16030324
- Boyd, D., & Crawford, K. (2012). Critical questions for big data: Provocations for a cultural, technological, and scholarly phenomenon. Information Communication and Society, 15(5), 662–679. https://doi.org/https://doi.org/10.1080/1369118X.2012.678878
- Brevoort, K. P., Grimm, P., & Kambara, M. (2015). Data point: Credit invisibles. CFPB Working Papers. The Consumer Financial Protection Bureau Office of Research. https://files.consumerfinance.gov/f/201505_cfpb_data-point-credit-invisibles.pdf
- Catlett, C. E., Beckman, P. H., Sankaran, R., & Galvin, K. K. (2017). Array of things: A scientific research instrument in the public way. Platform design and early lessons learned. In A. Dubey, A. Gokhale, M. Sturm, & S. Rhee (Eds.), Proceedings of the 2nd International Workshop on Science of Smart City Operations and Platforms Engineering (pp. 26–33). Association for Computing Machinery. https://doi.org/https://doi.org/10.1162/REST_a_00052
- Cohen-Cole, E. (2011). Credit card redlining. Review of Economics and Statistics, 93(2), 700–713. https://doi.org/https://doi.org/10.1162/REST_a_00052
- Costanza-Chock, S. (2020). Design justice. MIT Press.
- Daepp, M. I. G. (2020). Three essays on residential mobility, housing, and health. Massachusetts Institute of Technology. https://dspace.mit.edu/handle/1721.1/129066
- Davidoff, P. (1965). Advocacy and pluralism in planning. Journal of the American Institute of Planners, 31(4), 331–338. https://doi.org/https://doi.org/10.1080/01944366508978187
- De Mauro, A., Greco, M., & Grimaldi, M. (2016). A formal definition of Big Data based on its essential features. Library Review, 65(3), 122–135. https://doi.org/https://doi.org/10.1108/LR-06-2015-0061
- de Souza Briggs, X. (2005). The geography of opportunity: Race and housing choice in metropolitan America. Brookings Instititution Press.
- DeWaard, J., Johnson, J., & Whitaker, S. (2019). Internal migration in the United States: A comprehensive comparative assessment of the consumer credit panel. Demographic Research, 41(October), 953–1006. https://doi.org/https://doi.org/10.4054/demres.2019.41.33
- Dewey, J. (1954). The public and its problems. Swallow Press.
- D’Ignazio, C., & Klein, L. F. (2020). Data feminism. MIT Press.
- Ding, L., & Hwang, J. (2016). The consequences of gentrification: A focus on residents’ financial health in Philadelphia. Cityscape, 18(3), 27–56. https://www.huduser.gov/portal/periodicals/cityscpe/vol18num3/article2.html
- Ding, L., Hwang, J., & Divringi, E. (2016). Gentrification and residential mobility in Philadelphia. Regional Science and Urban Economics, 61, 38–51. https://doi.org/https://doi.org/10.1016/j.regsciurbeco.2016.09.004
- Ellen, I. G., & O’Regan, K. M. (2011). How low income neighborhoods change: Entry, exit, and enhancement. Regional Science and Urban Economics, 41(2), 89–97. https://doi.org/https://doi.org/10.1016/j.regsciurbeco.2010.12.005
- Elwood, S. (2008). Volunteered geographic information: Future research directions motivated by critical, participatory, and feminist GIS. GeoJournal, 72(3–4), 173–183. https://doi.org/https://doi.org/10.1007/s10708-008-9186-0
- Engin, Z., van Dijk, J., Lan, T., Longley, P. A., Treleaven, P., Batty, M., & Penn, A. (2019). Data-driven urban management: Mapping the landscape. Journal of Urban Management, 9(2), 140–150. https://doi.org/https://doi.org/10.1016/j.jum.2019.12.001
- Everett Community Health Partnership, GreenRoots, MIT CoLab, & Research Action Design (2020). Greater Boston anti-displacement toolkit. https://www.greaterbostontoolkit.org/en
- Fals-Borda, O. (1987). The application of participatory action-research in Latin America. International Sociology, 2(4), 329–347. https://doi.org/https://doi.org/10.1177/026858098700200401
- Freeman, L. (2005). Displacement or succession? Residential mobility in gentrifying neighborhoods. Urban Affairs Review, 40(4), 463–491. https://doi.org/https://doi.org/10.1177/1078087404273341
- Freeman, L., & Braconi, F. (2004). Gentrification and displacement New York City in the 1990s. Journal of the American Planning Association, 70(1), 39–52. https://doi.org/https://doi.org/10.1080/01944360408976337
- Freire, P. (2000). Pedagogy of the oppressed. Continuum Publishing Group.
- Frickel, S., Gibbon, S., Howard, J., Kempner, J., Ottinger, G., & Hess, D. J. (2010). Undone science: Charting social movement and civil society challenges to research agenda setting. Science, Technology & Human Values, 35(4), 444–473. https://doi.org/https://doi.org/10.1177/0162243909345836
- Greenwood, D. J., & Levin, M. (2007). Introduction to action research: Social research for social change. Sage Publications, Inc.
- Hauer, M. E., & Byars, J. (2019). IRS county-to-county migration data, 1990‒2010. Demographic Research, 40(May), 1153–1166. https://doi.org/https://doi.org/10.4054/DemRes.2019.40.40
- The Healthy Neighborhoods Study. (2020). A field guide for participatory action research. Conservation Law Foundation. https://www.clf.org/publication/field-guide-for-participatory-action-research/
- Innes, J. E. (1995). Planning theory’s emerging paradigm: Communicative action and interactive practice. Journal of Planning Education and Research, 14(3), 183–189. https://doi.org/https://doi.org/10.1177/0739456X9501400307
- Kindon, S., Pain, R., & Kesby, M. (2007). Participatory action research approaches and methods: Connecting people, participation and place. Routledge. https://doi.org/https://doi.org/10.4324/9780203933671
- Kitchin, R., & McArdle, G. (2016). What makes Big Data, Big Data? Exploring the ontological characteristics of 26 datasets. Big Data & Society, 3(1), 205395171663113–205395171663110. https://doi.org/https://doi.org/10.1177/2053951716631130
- Kontokosta, C. E. (2018). Urban informatics in the science and practice of planning. Journal of Planning Education and Research. Advance online publication. https://doi.org/https://doi.org/10.1177/0739456X18793716
- Lancichinetti, A., & Fortunato, S. (2012). Consensus clustering in complex networks. Scientific Reports, 2, 336. https://doi.org/https://doi.org/10.1038/srep00336
- Lee, D., Van der Klaauw, W. (2010). An introduction to the FRBNY consumer credit panel. https://www.newyorkfed.org/research/staff_reports/sr479
- Lewin, K. (1946). Action research and minority problems. Journal of Social Issues, 2(4), 34–46. https://doi.org/https://doi.org/10.1111/j.1540-4560.1946.tb02295.x
- Mah, A. (2017). Environmental justice in the age of big data: Challenging toxic blind spots of voice, speed, and expertise. Environmental Sociology, 3(2), 122–133. https://doi.org/https://doi.org/10.1080/23251042.2016.1220849
- Metropolitan Area Planning Council (2008). Massachusetts community types. http://www.mapc.org/wp-content/uploads/2017/09/Massachusetts-Community-Types-Summary-July_2008.pdf
- Minkler, M., Blackwell, A. G., Thompson, M., & Tamir, H. B. (2003). Community-based participatory research: Implications for public health funding. American Journal of Public Health, 93(8), 1210–1213. https://doi.org/https://doi.org/10.2105/ajph.93.8.1210
- Miraftab, F. (2009). Insurgent planning: Situating radical planning in the global south. Planning Theory, 8(1), 32–50. https://doi.org/https://doi.org/10.1177/1473095208099297
- Morello-Frosch, R., Pastor, M., Sadd, J., Prichard, M., & Matsuoka, M. (2013). Citizens, science, and data judo: Leveraging secondary data analysis to build a community-academic collaborative for environmental justice in Southern California. In B. A. Israel, E. Eng, A. J. Schulz, & E. A. Parker (Eds.), Methods for community-based participatory research for health (2nd ed.). Wiley.
- Nelson, A. A. (2010). Credit scores, race, and residential sorting. Journal of Policy Analysis and Management, 29(1), 39–68. https://doi.org/https://doi.org/10.1002/pam.20478
- O’Brien, D. T. (2018). The urban commons book. Harvard University Press. https://doi.org/https://doi.org/10.3390/su70x000x
- Reason, P., & Bradbury, H. (2008). The SAGE handbook of action research: Participative inquiry and practice (2nd ed.). Sage Publications Ltd.
- Roberts, A., & Kelly, G. (2019). Remixing as praxis: Arnstein’s ladder through the grassroots preservationist’s lens. Journal of the American Planning Association, 85(3), 301–320. https://doi.org/https://doi.org/10.1080/01944363.2019.1622439
- Rosvall, M., Axelsson, D., & Bergstrom, C. T. (2009). The map equation. The European Physical Journal Special Topics, 178(1), 13–23. https://doi.org/https://doi.org/10.1140/epjst/e2010-01179-1
- Rosvall, M., & Bergstrom, C. T. (2008). Maps of random walks on complex networks reveal community structure. Proceedings of the National Academy of Sciences, 105(4), 1118–1123. https://doi.org/https://doi.org/10.1073/pnas.0706851105
- Rothstein, R. (2017). The color of law: A forgotten history of how our government segregated America. Liveright Publishing.
- Schuetz, J. (2009). No renters in my suburban backyard: Land use regulation and rental housing. Journal of Policy Analysis and Management, 28(2), 296–320. https://doi.org/https://doi.org/10.1002/pam.20428
- Schweitzer, L. A., & Afzalan, N. (2017). 09 F9 11 02 9D 74 E3 5B D8 41 56 C5 63 56 88 C0: Four reasons why AICP needs an open data ethic. Journal of the American Planning Association, 83(2), 161–167. https://doi.org/https://doi.org/10.1080/01944363.2017.1290495
- Sharkey, P. T. (2013). Stuck in place: Urban neighborhoods and the end of progress towards racial equality. University of Chicago Press.
- Spears Johnson, C. R., Kraemer Diaz, A. E., & Arcury, T. A. (2016). Participation levels in 25 community-based participatory research projects. Health Education Research, 31(5), 577–586. https://doi.org/https://doi.org/10.1093/her/cyw033
- Tobler, W. (1970). A computer movie simulating urban growth in the Detroit region. Economic Geography, 89(4), 234–240. https://doi.org/https://doi.org/10.1126/science.11.277.620
- Torre, M. E., Fine, M., Stoudt, B. G., & Fox, M. (2012). Critical participatory action research as public science. In H. Cooper, M. Fine, B. G. Stoudt, & M. Fox (Eds.), APA handbook of research methods in psychology, Vol. 2. Research designs: Quantitative, qualitative, neuropsychological, and biological (pp. 171–184). American Psychological Association. https://doi.org/https://doi.org/10.1037/13620-011
- Whitaker, S. D. (2018). Big Data versus a survey. The Quarterly Review of Economics and Finance, 67, 285–296. https://doi.org/https://doi.org/10.1016/j.qref.2017.07.011
- Whitman, M., Hsiang, C. Y., & Roark, K. (2018). Potential for participatory big data ethics and algorithm design: A scoping mapping review. ACM International Conference Proceeding Series, 2, 1–6. https://doi.org/https://doi.org/10.1145/3210604.3210644
- Williams, S. (2020). Data action. MIT Press.
- Zhong, C., Arisona, S. M., Huang, X., Batty, M., & Schmitt, G. (2014). Detecting the dynamics of urban structure through spatial network analysis. International Journal of Geographical Information Science, 28(11), 2178–2199. https://doi.org/https://doi.org/10.1080/13658816.2014.914521