
Abstract
Problem, research strategy, and findings
Zoning has been proposed as a way of reducing unhealthy food access for youth, but little research has evaluated outcomes of proposed or existing junk food bans, and even less research has considered equity implications of such zoning policies. In this simulation study, set in the Region of Waterloo, Ontario (Canada), we examined how secondary student access to fast food restaurants and convenience stores would change under such a policy over 10 years in a mid-sized Canadian municipality. Outcomes are presented by school-level advantage (derived from the proportion of students in equity-deserving subgroups: low income, students who speak English as an additional language, and students not born in Canada). Current fast food restaurant and convenience store access was higher around schools with a higher proportion of equity-deserving students, and access remained higher around these schools even after 10 years under each policy scenario. After 10 years, the mean number of fast food restaurants and convenience stores within a 1-km network distance still exceeded five unhealthy outlets for both disadvantaged and advantaged schools, which was above the threshold associated with lower junk food consumption among youth. These findings bring into question the potential effectiveness and equity implications of restrictive zoning policies aimed at protecting youth from poor-quality food environments.
Takeaway for practice
Planners may consider prioritizing interventions to improve the healthfulness of food environments around schools where there are large proportions of equity-deserving students, but consideration of different interventions seems warranted in this context.
A healthy food environment is a key component of healthy communities (Downs & Demmler, Citation2020). Unhealthy food environments may be especially detrimental to children, which is why some organizations have advocated for municipalities to create restrictive zoning bylaws that would prohibit sources of unhealthy foods from operating within walking distance of schools (Alberta Policy Coalition for Chronic Disease Prevention, Citation2019; Association Pour La Sante publique Du Quebec [ASPQ], Citation2011; Einstoss et al., Citation2015; Helmer, Citation2019; Mah et al., Citation2016; Minaker et al., Citation2016; University of Wisconsin Population Health Institute, Citation2020; U.S. Centers for Disease Control and Prevention, Citation2010). However, only one study to date has examined health-related impacts of a food-related zoning policy (Sturm & Cohen, Citation2009), and none has examined impacts of any kind related to restrictive zoning bylaws near schools. We therefore examined how high school students’ potential access to sources of unhealthy foods around schools would be projected to change over 10 years under a restrictive zoning policy and examined differences in these changes by equity-deserving subgroups.
The following sections synthesize key literature and describe methods used in the current study. We then present results, after which we discuss key findings, limitations, and recommendations for future research. Results showed that, on average, disadvantaged schools had almost seven more unhealthy retailers within walking distance compared with advantaged schools and that a disparity in access to unhealthy retailers between school-level advantage persisted over time. Despite an increasing number of calls by both planning and public health organizations to implement restrictive zoning policies to reduce youth access to unhealthy food, our results suggest that this policy option may be quite ineffective in reducing youth access to junk food in established communities. Thus, different interventions aimed at supporting healthy environments for youth should be explored.
Healthy Food Environments as a Key Component of Healthy Communities
Healthy built environments can promote and sustain beneficial lifestyle patterns that contribute to chronic disease prevention (American Planning Association, Citation2017; Hilmers et al., Citation2012; Public Health Agency of Canada, Citation2020). Healthy food systems are foundational to healthy built environments, which planners and public health practitioners increasingly recognize as important in community planning and equity promotion (Mui et al., Citation2021). The quality of the food environment, such as geographic access to healthy or unhealthy foods, differs systematically by neighborhood income, which affects neighborhoods’ access to food retailers and may perpetuate disparities in health outcomes (Gordon-Larsen, Citation2014; Larson et al., Citation2009). There may be an oversaturation of unhealthy food retailers within equity-deserving (e.g., low-income, racialized, and immigrant) communities (Fleischhacker et al., Citation2011; Jang & Kim, Citation2018; Kwate & Loh, Citation2010), in parallel with a lack of healthy food options in these same communities (Bower et al., Citation2014; Hilmers et al., Citation2012; Jeong & Liu, Citation2020; Luan et al., Citation2016; Ohri-Vachaspati et al., Citation2019; P. K. Powell et al., Citation2021). In addition, a growing body of research has explored associations between access to food and adverse health outcomes in equity-deserving subgroups that indicate inequitable access to food (Drewnowski, Citation2009; Kraft et al., Citation2020; Matsuzaki et al., Citation2020).
Children, Youth, and Food Environments
Children may be especially vulnerable to poor-quality food environments, given that they are typically less mobile than adults (Pitt et al., Citation2021). Few food environment interventions targeting children and adolescents have been conducted in community settings, and no intervention studies have examined how changes in access to sources of unhealthy food, typically considered fast food restaurants (FFRs) and convenience stores (CSs), affect diet-related outcomes (Downs & Demmler, Citation2020).
Food environments deemed particularly relevant to children and youth are those around schools, given that most children spend at least 6 hours a day and eat at least one meal in these environments. Extant youth-focused food environment research is typically either equity focused, examining area-level sociodemographic disparities in healthy food environments, or impact focused, examining associations between food environment features and youth diet-related outcomes, such as dietary intake or weight status.
Equity-focused research in this field has sought to explain well-established disparities in diet-related outcomes like obesity by immigration status, race/ethnicity, and household socioeconomic status (Chatham & Mixer, Citation2020; Ogden et al., Citation2016; Olstad et al., Citation2019; Singh et al., Citation2009). This thread of research has typically shown that access to healthy or unhealthy food varies systematically by school neighborhood income (Fleischhacker et al., Citation2011; Jeong & Liu, Citation2020; Kestens & Daniel, Citation2010; Luan et al., Citation2016) or racial composition (Bower et al., Citation2014; Kwate & Loh, Citation2010; Ohri-Vachaspati et al., Citation2019), with equity-deserving populations (e.g., low-income, immigrant, or racialized youth) having poorer quality food environments. For example, the availability of FFRs and CSs within walking distance of U.S. public secondary schools was found to be higher in the lowest-income neighborhoods relative to the highest-income neighborhoods, and schools in predominantly African American neighborhoods had overall fewer food outlets relative to predominantly White neighborhoods (Zenk & Powell, Citation2008). In Montréal (Canada), schools in the lowest income quartile had 10 times more food retailers within 740 m than schools in the highest income quartile, even after accounting for commercial density (Kestens & Daniel, Citation2010). These findings appear context specific, however, given that a cross-Canada study found access to food retailers was generally not associated with the neighborhood socioeconomic status in the immediate proximity of schools, although within the broader neighborhood, lower socioeconomic status neighborhoods had access to fewer food retailers of all types (Seliske et al., Citation2009b).
Second, in terms of impact-focused research, understanding of the extent to which food environments around schools are linked to youth food purchasing and dietary and health outcomes is also growing (Cutumisu et al., Citation2017; Engler-Stringer et al., Citation2014; He et al., Citation2012; Williams et al., Citation2014; Xin et al., Citation2019). A recent systematic review of the evidence on associations between CS access and childhood obesity found that, in general, CS density and proximity are positively associated with unhealthy eating behaviors, but the association with children’s weight status varied significantly by region (e.g., associations between CS access and children’s weight status were negative in Canada and mixed in the United States and the United Kingdom; Xin et al., Citation2019). In another recent systematic review of associations between the presence of retail food outlets around schools and prevalence of overweight among students, most reviewed articles found direct associations between proximity or density of establishments (mainly FFRs, CSs, and grocery stores) around schools and overweight and obesity among children and adolescents, but inconsistent research findings were again noted, with some studies finding no association and a few finding an inverse association (da Costa Peres et al., Citation2020). In yet another recent systematic review, the relationship between youths’ exposure to food environments around schools and body weight was more consistent among racialized (vs. White) students but seemed less certain by socioeconomic status, which was unsurprising given that only two studies examined differences by socioeconomic advantage (Matsuzaki et al., Citation2020). These findings were like those of another recent systemic review examining associations between neighborhood food environments and health outcomes in populations with the highest obesity rates in the United States, which found that negative health outcomes are more strongly associated with CS and FFR access for Black and Hispanic youth versus White youth (Kraft et al., Citation2020).
Policy Options to Reduce Youth Access to Junk Food
As noted, no studies to date have examined the impact of planning interventions to change access to different food sources on diet-related outcomes among children, and there is only one example of an evaluation of a restrictive zoning regulation. Sturm and Cohen (Citation2009) evaluated the impact of a freestanding FFR zoning restriction in an equity-deserving community (racially diverse and low-income) and found no impact on population health outcomes, including obesity and body mass index (BMI). However, this was unsurprising given the short implementation length of the ordinance (1 year) and the documented failure of the policy to change population-level FFR access (Sturm & Cohen, Citation2009). Notably, restaurants located within shared space (e.g., located inside a mall) were excluded from the policy and not subject to regulation (Sturm & Cohen, Citation2009).
Despite the lack of evidence on how changing access to sources of food affects health, both planning and public health organizations have suggested that zoning regulations could improve food access (and, ultimately, health) by restricting children’s access to sources of unhealthy food such as FFRs and CSs (Alberta Policy Coalition for Chronic Disease Prevention, Citation2019; Einstoss et al., Citation2015; Helmer, Citation2019; Mah et al., Citation2016; Minaker et al., Citation2016; University of Wisconsin Population Health Institute, Citation2020; U.S. Centers for Disease Control and Prevention, Citation2010). In 2005, the Center for Law and the Public’s Health published a guide for city planners to create zoning regulations to reduce access to FFRs, citing many examples of municipalities in the United States where restrictive zoning policies already existed (Mair et al., Citation2005). In 2011, the Ontario Professional Planners Institute (OPPI) released a call to action to prioritize the creation of healthy communities and emphasized the importance of planning for food systems (OPPI, Citation2011). Municipalities in two Canadian provinces (York Region, Ontario, and Québec City, Québec) have implemented zoning regulations prohibiting new food outlets near secondary schools (ASPQ, Citation2011; Einstoss et al., Citation2015; Robitaille et al., Citation2016), and the municipality of Lavaltrie in Quebec adopted a motion prohibiting new FFRs within a 500-m radius around schools (Robitaille et al., Citation2016). By 2016, 27 municipalities in Canada had also adopted bylaws to fully or partially ban restaurant drive-thrus, with a proliferation of this type of bylaw over time (Nykiforuk et al., Citation2018). In the United States, several major cities including Detroit (MI) and Los Angeles (CA) have also implemented zoning restrictions to limit or ban FFRs in some areas or regulate the proximity of FFRs around other sites such as schools or hospitals (ASPQ, Citation2011; Mair et al., Citation2005).
To date, effects of restrictive zoning bylaws that would prohibit FFRs or CSs from opening around schools have not been evaluated. This is an important gap given that these types of policies are proliferating and that features of the food environment may be tied to equitable access to food and, ultimately, health. Therefore, the objective of this simulation study was to examine accessibility to sources of unhealthy foods around secondary schools in a mid-sized municipality in Canada over 10 years of implementing a restrictive junk food ban. This study focused exclusively on FFRs and CSs, which directly aligns with recent policy developments, as described above. A particular focus of our study was on how long-term accessibility might differ by school-level markers of inequity based on students’ household income, whether they spoke English as an additional language (EAL), and immigrant status. Our primary research questions were the following: How does current food environment accessibility differ by school-level proportion of low-income, EAL, and immigrant students in secondary schools in the Region of Waterloo (Ontario)? How would projected changes in food environment accessibility after 10 years of restrictive policy implementation differ by these groups?
Methodology
Study Area
The Region of Waterloo had a population of 617,870 in 2019 (Region of Waterloo, Citation2020). It comprises three urban (Waterloo, Kitchener, Cambridge) and four rural (North Dumfries, Woolwich, Wellesley and Wilmot) municipalities. There are 25 high schools in the Region of Waterloo (23 urban high schools and 2 rural high schools), and approximately 27,535 students in the Region of Waterloo attended high school in 2019–2020 (Government of Ontario, Citation2020a).
In 2009, the Region of Waterloo adopted a new regional official plan that included commitments to support the regional food system through actions to facilitate access to healthy, local food and is currently in the process of undertaking a Regional Official Plan Review (Region of Waterloo, Citation2021). Waterloo Region planning staff began exploring issues related to hunger and food insecurity as early as 1999. In the past 2 decades, collaboration has increased between public health staff and planners to explore how supporting the regional food systems can improve community food security and help protect against sprawl (Wegener et al., Citation2012).
The 2019/2020 Region of Waterloo regional official plan review was recognized by the region’s public health unit as an opportunity to solicit greater government buy-in when adopting supportive food policies within the region. Furthermore, the Food System Roundtable of Waterloo Region’s stated objective is to identify and prioritize food system needs while raising awareness of food system issues (University of Waterloo, Citation2020).
In 2016, about a third (35%) of households in the Waterloo Region had an annual household income of less than $60,000 (Region of Waterloo, Public Health, Citation2016). For context, to receive the Low-Income Workers Tax Credit from the Government of Ontario, annual family net income must be below $68,500 (Government of Ontario, Citation2020a). In 2016 there were approximately 120,000 immigrants in the Waterloo Region, comprising 23% of the Region’s population (Folkema & Vandebelt, Citation2019). The Waterloo Region has been similar to the overall Canadian population in terms of population growth rate (5.5% for Waterloo Region, 5.0% for Canada between 2011 and 2016), proportion of people whose mother tongue is neither English nor French (1.7% for Waterloo Region, 1.8% for Canada), the prevalence of low income based on the low-income cutoffs after tax (7% in Waterloo Region, 9% in Canada), and the proportion of immigrants in the population (23% in Waterloo Region, 22% in Canada (Government of Canada, Citation2021). Approximately 19% of youth aged 12 to 17 in the Region of Waterloo were overweight or obese in 2013/2014 (Region of Waterloo, Citation2016).
Policy Description
In this study we examined a restrictive food planning policy aimed to improve the healthfulness of food environments around schools by reducing accessibility to unhealthy retailers through prohibiting new FFRs and CSs from opening within various geographic locations (ASPQ, Citation2011). Similar to other policies (National Policy and Legal Analysis Network [NPLAN], Citation2009), we assumed that any new food planning policy would include a legacy clause that would exempt existing FFRs and CSs from the policy. Four configurations of this policy were examined; each would ban FFRs and CSs from opening within the following distances from schools: an 800-m Euclidean buffer, 1-km Euclidean buffer, 800-m network buffer, and 1-km network buffer.
Euclidean and network buffers were selected given their use in existing literature that has sought to measure food environments, access, and exposure (DuBreck et al., Citation2018; He et al., Citation2012; Kestens & Daniel, Citation2010; Seliske et al., Citation2009a; Shareck et al., Citation2018). Euclidean buffers appear as perfect circles around the school and measure straight-line distances between two points on a place (ESRI, Citation2011). Network buffers follow the existing road network but do not consider possible walkways and shortcuts students may take (ArcGIS, Citation2021). Previous research has used both 800 m and 1 km when measuring food environments and access (Day & Pearce, Citation2011; DuBreck et al., Citation2018; Seliske et al., Citation2009b; Shareck et al., Citation2018), in correspondence with the average distance a person could walk in 10 to 15 min (Davis & Carpenter, Citation2009; Shearer et al., Citation2015). Given that schools may allow a maximum of 1 hour for lunch, the distances examined would provide students with adequate time to leave campus to purchase and eat lunch, aligned with extant literature defining the school–neighborhood environment as a 1-km radius around the school (He et al., Citation2012).
Data Sources
School-Level Data
We retrieved school type and geocoded location data from the Government of Ontario School Information and Student Demographics (Government of Ontario, Citation2020b). Public and Catholic secondary schools that consisted of Grades 9 to 12 (approximately ages 14–18 years) were included in school type. Secondary schools were selected due to the likelihood that middle or elementary schools would be subject to closed campus policies, whereas secondary schools in this region have policies that allow students to leave school property during lunchtime (Waterloo Region District School Board, personal communication, January 11, 2021). In the Region of Waterloo there were a total of 25 secondary schools: 18 from the Waterloo Region District School Board, 5 from the Waterloo Catholic District School Board, and 2 private Catholic schools.
We retrieved school-level demographic data from the Government of Ontario School Information and Student Demographics (Government of Ontario, Citation2020b). For this study, school-level demographic data included the percentage of students within each school a) living in low-income households, b) whose first language was not English (EAL), and c) who were new to Canada from a non-English-speaking country (immigrants). As noted, food access has been hypothesized to at least partially explain income, race/ethnicity, and immigration-related disparities in diet-related health outcomes (Chatham & Mixer, Citation2020; Ogden et al., Citation2016; Olstad et al., Citation2019; Singh et al., Citation2009). Given additional language-related barriers faced by EAL students, we also included EAL as a variable of interest. The three school-level variables used here to signify equity-deserving groups reflect both limited data availability at the school level and previous research on disparities in diet-related outcomes by group membership. Of the 25 public and Catholic secondary schools in the Waterloo Region, 17 had complete data on all variables of interest and were included in the current study.
Though this study was limited by the availability of school-level data and resulted in a relatively small sample size (17 schools with complete data), the sample nevertheless covered most secondary schools in the Waterloo Region. Moreover, as described above, the sociodemographic composition of Waterloo Region is similar to the overall Canadian population; thus, findings may be relevant for other mid-sized municipalities as well. That said, both results and the policies explored may not be transferable to other countries given the diversity in planning laws and contexts that exist.
Food Retailer–Level Data
Retail food type (FFRs and CSs) and geocoded location data from March 2020 were retrieved from the Region of Waterloo’s Public Health Inspection Database (Region of Waterloo, 2022). We focused on less healthy food retail outlet accessibility such as FFRs and CSs as described in the Ontario Public Health Standard’s report on calculating access to different food sources (Government of Ontario, Citation2020b). Although grocery stores and restaurants also sell unhealthy food, standard practice in the current literature to date has defined these retailers as a proxy for healthier food access (Lind et al., Citation2016; Moudon et al., Citation2013). In keeping with existing literature and policy recommendations (ASPQ, Citation2011; Cutumisu et al., Citation2017; Sturm & Cohen, Citation2009), we excluded grocery stores and other food retailers from the analysis. Although some research has suggested that the overall mix of food outlets is more strongly associated with diet- or weight-related outcomes than the absolute density of FFRs and CSs (Clary et al., Citation2015), other research has found the exact opposite (Pinho et al., Citation2019). The limited child-focused research that exists suggests that absolute accessibility matters for youth dietary intake (Cutumisu et al., Citation2017).
As described in the North American Industry Classification System Canada 2012, FFRs consist of establishments that primarily engage in providing over-the-counter food services where customers pay before eating (Statistics Canada, Citation2018). CSs are establishments primarily retailing a limited line of items such as soft drinks, snacks, and some general food items such as bread and milk (Statistics Canada, Citation2018). Full-service restaurants were excluded from this study due to the lack of time students would have to sit down, order, consume, and pay for lunch at these establishments during relatively brief lunch periods.
Community-Level Network Data
The Region of Waterloo Road Network (v2019.3) was retrieved from DMTI Spatial Inc. (Citation2019). The road network was used to determine how many unhealthy retailers are within the designated policy configuration areas (described above).
Methodological Approach
Current School–Neighborhood Food Environments
Unhealthy food accessibility, defined as the number of FFRs and CSs within each buffer, was calculated for the four different policy configurations described above: an 800-m Euclidean buffer, a 1-km Euclidean buffer, an 800-m network buffer, and a 1-km network buffer. We explored the current state of unhealthy food accessibility around secondary schools within four buffers by each school-level variable individually to examine how access to FFRs and CSs varies by school-level sociodemographic characteristics.
School-Level Advantage Categories
Based on literature suggesting that food environments in higher income, predominantly White, nonimmigrant neighborhoods are typically more health promoting, we categorized schools into advantaged and disadvantaged groups within each variable (income, EAL, and immigrant) by dichotomizing each variable at the median. Disadvantaged schools were those with an above-the-median proportion of low-income, EAL, or immigrant students, whereas advantaged schools were those with a below-the-median proportion of students in each category.
We further categorized schools using all three variables so that disadvantaged schools were those that ranked above the median in at least two of the variables, neither advantaged nor disadvantaged schools ranked above the median in only one of the variables, and advantaged schools ranked below the median in all three variables.
Analysis
Spatial Analysis of Food Environments
Studies typically have two methods of measuring exposure: 1) using buffers around schools to measure potential exposure and 2) using activity spaces and global positioning system (GPS) to measure true exposure (Sadler et al., Citation2016; Sadler & Gilliland, Citation2015). It is important to note the bias in geospatial proxies when measuring exposure, given that proxy measures are not true exposure (Sadler & Gilliland, Citation2015); therefore, accessibility may be a more appropriate term when measuring potential exposure within retail food environments.
Accessibility is typically calculated with geographic information systems and operationalized as density and/or proximity of different types of food outlets (Charreire et al., Citation2010; Cutumisu et al., Citation2017; Seliske et al., Citation2009). We conducted two types of spatial analysis of retail food environments around secondary schools using ArcMap (10.8.1): a spatial buffer analysis (e.g., Euclidean) and a network analysis using the Road Network Extension. All FFRs and CSs on or within the buffer area serving the Euclidean buffer were identified, indicating unhealthy food retailers within the buffer at both 800 m and 1 km. We conducted a road network analysis to determine the road network distance of 800 m and 1 km to identify FFRs and CSs on or within the road network buffer. Accessibility to unhealthy food was thus defined as the total number of FFRs and CSs within each buffer. One potential limitation of this approach is that we did not examine smaller intervention areas or other policy-relevant neighborhood boundaries that could increase feasibility in terms of policy implementation.
Community Population Projections Using Life Tables
In this study, we used life tables, a type of population projection model, to estimate the total number of unhealthy food outlets identified within the policy area(s) after 10 years according to average business survival rates by age (described in Results section). Planners commonly use population projection models to predict demand for land uses, infrastructure, and community facilities (Berke et al., Citation2006, p. 126). Briefly, life tables are employed in a variety of ways in the field of demography (Siegel & Swanson, Citation2004, pp. 564–594) but are typically used to examine mortality, survivorship, and life expectancy. In the current application, we constructed life tables to show the probability that restaurants (instead of people) would survive based on a standard restaurant birth rate and age-specific death rate. A linear growth model where growth increments remain consistent over time was assumed based on national business survival rate data (Berke et al., Citation2006).
Under the policy, calculations used a modified population projection model that excluded the birth rate to account for the fact that no new FFRs or CSs would open within the policy area, recognizing that existing businesses would not be forced to close given the legacy clause.
Business Survival Rates
In this study, we assumed a legacy clause for existing food businesses for any new food planning policy, like existing policies, exempting existing targeted food outlets from the policy (NPLAN, Citation2009). Under this legacy clause, only new FFRs and CSs would be prohibited from opening within the designated policy area.
The restaurant birth rate was defined as the national average of new restaurants for the service-producing sector and was retrieved from Statistics Canada (Government of Canada, Citation2019). Specifically, we assumed the average birth rate of 8.9% for enterprises with more than one employee within the service-producing sector from 2005 to 2015 to be the annual birth rate (Government of Canada, Citation2019).
Restaurant death rate was defined as business survival rates year over year for 10 years and was retrieved from Statistics Canada (Government of Canada, Citation2019). Like human death rates, business death rates are linked to age. For example, a business that has been open for 7 years has an approximately 53% survival rate (47% death rate) for the year, whereas a recently opened establishment has an approximately 95% survival rate (5% death rate) for the year (Government of Canada, Citation2019). Therefore, policy impacts may be affected by the age distribution of food retailers within a community. Given that local restaurant birth rate and death rate data were not available, these variables were derived from national data, as described above.
Policy Projections by School Disadvantage
We examined projected changes under each policy configuration both within the policy area and the greater school neighborhood environment. The greater school neighborhood was defined as a 1-km Euclidean distance buffer around each school address, assuming this distance as the threshold distance students would typically walk during their lunch period (He et al., Citation2012). The total number of FFRs and CSs at 10 years across all policy scenarios under each school disadvantage level was calculated within the greater school neighborhood to standardize findings across policy configurations. The final analysis presented all results in terms of the greater school neighborhood rather than policy area because the policy areas differ by size (800 m vs. 1,000 m) and type of buffer (Euclidean vs. network).
Sensitivity Analysis
Food outlets have different death rates by age; therefore, policy impacts might be different depending on community context (i.e., communities with less established or younger food outlets might be affected differently than communities with a more established or older food environment). Therefore, we also conducted a sensitivity analysis in which we created population projection models for a young food environment (i.e., we assumed 70% of establishments were between 0 and 5 years old and 30% were between 6 and 10 years old), a medium food environment (i.e., establishments were assumed to be evenly distributed between 0 and 10 years), and an old food environment (i.e., we assumed 30% of establishments were between 0 and 5 years and 70% were between 6 and 10 years). Across each food environment (young, medium, and old), availability projections showed little difference in the average number of FFRs/CSs after 10 years, with a mean difference of approximately 1.2 retailers (9.1 for a young food environment vs. 10.3 for an old food environment). Below, we present results from the medium context, where outlet age was assumed to be evenly distributed between 0 and 10 years.
Results
Current State of Food Environments Around Schools by School Disadvantage Variable
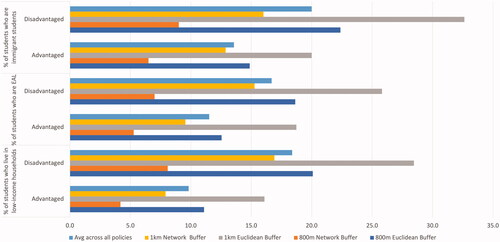
Across each variable, disadvantaged schools had the highest number of FFRs and CSs within a 1-km Euclidean buffer (the largest buffer), with 28.5 retailers around low-income schools, 25.8 retailers around schools with a high proportion of EAL students, and 32.6 retailers around schools with a high proportion of immigrant students. Across all buffers, schools with a high proportion of immigrant students had a mean of 20 unhealthy retailers, whereas low-income schools and schools with a high proportion of EAL students had a mean of 18.4 and 16.7 unhealthy retailers, respectively. In contrast, schools with a low proportion of immigrant students had a mean of 13.6 unhealthy retailers across all buffers. High-income schools and schools with a low proportion of EAL students had a mean of 9.8 and 11.5 unhealthy retailers around schools, respectively. There was a mean difference of 6.7 more unhealthy retailers around disadvantaged schools relative to advantaged schools. represents the current number of unhealthy retailers around secondary schools in the Region of Waterloo by individual variable.
Figure 1. The current mean number of unhealthy retailers around secondary schools in the Waterloo Region by individual variable and buffer.
Current State of Food Environments Around Schools by Overall School Disadvantage
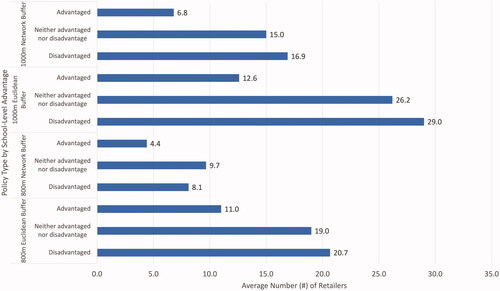
In total, nine schools were disadvantaged, three were neither advantaged nor disadvantaged, and five schools were considered advantaged. In three of the four buffer-type configurations, disadvantaged schools had more unhealthy retailers than other schools. shows the current mean number of unhealthy food retailers around schools by overall level of disadvantage and buffer type.
Figure 2. The current mean number of unhealthy food retailers around secondary schools by school-level advantage (i.e., disadvantaged, neither advantaged nor disadvantaged, and advantaged) and buffer type.
Food Environment Projections by School Disadvantage
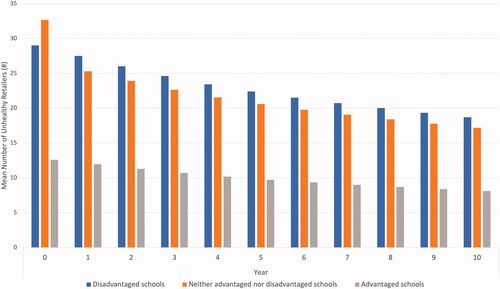
On average, across all policy configurations and school advantage levels, there were still more than five unhealthy outlets around schools at the end of 10 years. Disadvantaged schools across all policy configurations had a mean of 12 unhealthy retailers, schools that were neither advantaged nor disadvantaged had a mean number of 11 retailers, and advantaged schools had a mean number of 6 unhealthy retailers within their buffers after 10 years. Under the 1-km Euclidean distance policy configuration, disadvantaged schools had an average of 18 unhealthy retailers, whereas neither advantaged nor disadvantaged schools and advantaged schools had 17 and 8 unhealthy retailers, respectively, after 10 years (see ).
Figure 3. The projected mean number of unhealthy retailers within 1-km Euclidean distance of schools by school-level advantage over 10 years.
Discussion
In this study, we examined how current food environment accessibility around secondary schools differed by the proportion of equity-deserving students and how projected changes caused by potential restrictive food planning policies after 10 years would vary by school-level advantage in a mid-sized Canadian municipality. Two key findings emerged. First, at the end of the 10-year period, despite mean overall reductions in the number of unhealthy retailers, all schools had at least two unhealthy retailers within the school neighborhood. Second, current food environment accessibility to unhealthy retailers was higher among disadvantaged schools compared with advantaged schools, and this inequity was not ameliorated by the policy: At the end of 10 years, disadvantaged schools still had higher projected accessibility to unhealthy food retailers relative to other schools. Each of these findings is described in greater detail below.
First, despite differences in unhealthy food access between disadvantaged and advantaged schools, ultimately, all schools maintained ample access to unhealthy retailers even after 10 years. This is important given that two or more fast food outlets located within 750 m of schools is the threshold associated with a higher likelihood of junk food consumption at lunch, even after accounting for student, family, and school characteristics (Cutumisu et al., Citation2017). Even in the policy configuration showing the greatest reduction of FFRs and CSs (the 1-km Euclidean distance policy configuration), every school still had at least two unhealthy retailers within walking distance. This overarching finding brings into question the potential effectiveness of these restrictive zoning policies in meaningfully reducing accessibility to unhealthy food outlets at the population level. If a restrictive policy such as the one we examined in this study fails to make significant changes to the food environment around schools, it is extremely unlikely that such policies would affect youths’ diet-related health outcomes.
Second, disadvantaged schools and schools that were neither advantaged or disadvantaged currently have access to approximately twice as many unhealthy food retailers (mean of 29 and 26 retailers, respectively) relative to advantaged schools (mean of 13 retailers). This finding is in keeping with most previous research that showed disadvantaged neighborhoods had higher access to unhealthy food sources relative to advantaged neighborhoods (Bower et al., Citation2014; Hilmers et al., Citation2012; Kestens & Daniel, Citation2010; L. M. Powell et al., Citation2007; Zenk & Powell, Citation2008). Importantly, policy implementation over time did not ameliorate observed inequitable access to FFRs and CSs. After 10 years of policy implementation, disadvantaged schools and schools that were neither advantaged or disadvantaged still had access to approximately twice as many unhealthy food retailers (12 and 11, respectively) relative to advantaged schools (which had access to a mean of 6 retailers). Such policies may thus be further unwarranted if they fail to address inequities in access. Several studies, along with our results, have highlighted the current oversaturation of unhealthy food outlets in equity-deserving communities, with the criticism that restricting new outlets would have little impact on school–neighborhood food environments (Díez et al., Citation2019; Green et al., Citation2018). Health equity is an important dimension of retail food environment interventions because they are often tailored to communities where inadequate household income is likely to amplify the effects of spatial disparities in food access (Minaker et al., Citation2016). This is equally true for interventions aimed at supporting healthy environments for youth.
Physical environmental factors (i.e., healthy food availability) are explicitly connected to and shaped by social environmental factors (i.e., socioeconomic status; Díez et al., Citation2019). For example, FFRs and CSs primarily sell energy-dense foods, which typically cost less than nutritious foods, making unhealthy foods more financially accessible for people living on low incomes (Drewnowski, Citation2009). Therefore, regardless of the projected effectiveness of this type of restrictive zoning policy, the question remains: Is equity upheld if restrictive policies reduce geographic access to financially accessible food access for low-income youth and their families? Is no food better than unhealthy food? This may be a particularly important question in areas characterized as food deserts (areas with low access to sources of nutritious foods) or food mirages (areas with adequate access to sources of nutritious foods that are economically inaccessible to lower income populations living there; see Breyer & Voss-Andreae, Citation2013; Jang & Kim, Citation2018). At the same time, children and youth, especially equity-deserving youth, are specifically targeted by food marketing that exists within unhealthy food outlets (Cairns et al., Citation2013; Hastings et al., Citation2003; Kumanyika & Grier, Citation2006). Therefore, striving to reduce youths’ exposure to powerful, point-of-sale marketing in unhealthy food outlets may still be warranted and ultimately support equity.
It is important to note that jurisdictions in some countries may not have the legal authority to implement this type of restrictive zoning policy. For those that do, when exploring restrictive policies of this type, they must consider the potential unintended consequences or impacts, especially for equity-deserving communities. For both planning and public health, even if a policy is effective, better understanding whether these policies will improve quality of life for equity-deserving youth or simply perpetuate systemic issues that contribute to social inequities will be important for moving forward. Given that access to food is associated with other social inequities, planners and public health practitioners should consider the impacts of restricting access to food retailers without providing additional supports to improve availability and financial accessibility to healthier food options (Díez et al., Citation2019).
One option that has been explored is a Healthy Corner Store program, which encourages and incentivizes small store owners to stock and promote healthier foods (The Food Trust, Citation2012; Mah et al., Citation2017). These types of programs aim to increase access to nutritious foods in settings (e.g., CSs) that are more likely to be in equity-deserving neighborhoods. Healthy Corner Store programs can be undertaken in collaboration with community members, researchers, and business owners to serve equity-deserving communities (Rollins et al., Citation2021).
Other municipal policy options to improve nutrition environments include planning policies that support primary agricultural production in urban places, economic and fiscal instruments (for example, institutional procurement policies in municipal buildings that prioritize nutritious foods), and the establishment of food policy councils, which bring a variety of stakeholders together to identify important food-related policy issues (Mah et al., Citation2016). Other, alternative agrifood projects aiming to create transformative local food system change are also increasingly being undertaken with racially diverse food justice organizations and have potential impacts far beyond merely access to nutritious foods (for example, civic engagement; Sweeney et al., Citation2015).
Future Research Directions
Our study was the first to examine projected impacts of proposed restrictive food planning policies on various equity-deserving groups, and there are several promising avenues for future research. First and foremost, built environments affect youth health via multiple pathways, including structuring opportunities for both physical activity and food consumption. Research on the built environment and obesity, for example, typically falls into one category (e.g., walkability and physical activity) or the other (e.g., food environments and diet-related outcomes), and the limited research that assessed both pathways simultaneously has found conflicting results. Food and physical activity environments can interact to form combinations of environmental characteristics that may synergistically (rather than additively) influence children’s health-related behaviors (DeWeese et al., Citation2018). Specifically, with the confluence of walkability and a high prevalence of unhealthy food sources, impacts on health are complex, such that children in these environments both walk more and eat more unhealthy foods (DeWeese et al., Citation2018).
It may also be true that in more walkable environments, students are more inclined to walk to food outlets at lunch. Although we did not adjust for walkability in our analyses, we did account for all FFRs and CSs within reasonable walking distance. Future research could examine the impact of pleasant walking environments on students’ food purchasing during the school day. Related, a recent large study used electronic medical records of youth to examine various built environment associations with BMI and found that, most notable, community socioeconomic deprivation was associated with higher youth BMI in all types of communities (rural, suburban, urban), even after controlling for built environment factors related to both food and physical activity (Poulsen et al., Citation2019). Measures of the food environment were highly correlated with the availability of both recreational and utilitarian physical activity infrastructure, indicating that the food environment may be difficult to disentangle from other health-related built environment features (Poulsen et al., Citation2019). Environmental “goods” such as physical activity facilities and fruit and vegetable outlets frequently co-occur with environmental “bads,” such as CSs and FFRs, and are themselves patterned by area-level deprivation (Marek et al., Citation2021). Despite complex relationships between built environment features themselves and their potential impacts on health behaviors, our study sought only to examine potential impacts of a specific type of restrictive food environment policy on the food environment because this policy has been recommended by multiple prominent organizations despite a complete lack of empirical support. How such a policy might change other features of the built environment (e.g., walkability, which is often in part operationalized as mixed land use, to which the existence of restaurants and food stores contribute) and, ultimately, youth health outcomes remains to be seen and should be examined in future research that aims to evaluate these policies. Clearly, promoting walkable design is an important goal, and walkable designs that also support healthy diets should be considered.
Another promising avenue for future research is to consider urban/rural differences in policy implementation and outcomes, particularly given urban/rural differences in the diets of school-aged children (McCormack & Meendering, Citation2016; Minaker et al., Citation2006).
Conclusions
Under all policy configurations, after 10 years of implementation, all schools still had ample access to FFRs and CSs, and inequities in accessibility were maintained, with disadvantaged schools having higher access than advantaged schools. Ultimately, the objective of restrictive food planning policies is to reduce access to unhealthy foods and, in so doing, improve youth diets and long-term health. However, there may be adverse, unintended consequences on equity-deserving youth whose families may rely on more financially accessible food options. Using restrictive zoning policies in areas that are already oversaturated with FFRs and CSs may have little impact on changing accessibility to unhealthy food retailers in school neighborhoods. As evidenced by results from the sensitivity analysis, this type of zoning restriction seems to be ineffective in reducing unhealthy food access for youth during the school day even in communities that are less well established (i.e., the young food environment scenario). Therefore, for this policy to meaningfully support reduced access to unhealthy food for youth, it would need to be implemented prior to the opening of these types of businesses (for example, in new residential developments or in potentially more rural areas where there may be fewer FFRs and CSs).
With a growing need and desire for intersectoral collaboration of planning professional and public health, this simulation study aimed to contribute to the ongoing conversation of social inequities across food environments and highlight equity considerations of restrictive food planning policies.
Acknowledgment
We acknowledge that a considerable portion of the article text originated in a master’s thesis written by the first author.
Additional information
Notes on contributors
Lindsey Soon
LINDSEY SOON ([email protected]) graduated from the University of Waterloo’s School of Planning Master of Arts program in 2021.
Jason Gilliland
JASON GILLILAND ([email protected]) is a professor and director of the Urban Development Program in Western University’s Department of Geography and Environment.
Leia M. Minaker
LEIA M. MINAKER ([email protected]) is an assistant professor in the School of Planning at the University of Waterloo.
References
- Alberta Policy Coalition for Chronic Disease Prevention (APCCP). (2019). Creating protective environments: Restricting access to unhealthy foods around schools. https://abpolicycoalitionforprevention.ca/wp-content/uploads/2019/06/apccp-issue-brief-restricting-access-to-unhealthy-foods-around-schools.pdf
- American Planning Association. (2017). Healthy communities policy guide. Centers for Disease Control and Prevention. https://www.cdc.gov/healthyplaces/healthtopics/healthyfood/zoning.htm https://planning.org/publications/document/9141726/
- ArcGIS. (2021). Buffer (Analysis)-ArcGIS Pro|Documentation. https://pro.arcgis.com/en/pro-app/latest/tool-reference/analysis/buffer.htm
- Association pour la Sante Publique du Quebec (ASPQ). (2011). The school zone and nutrition: Courses of action for the municipal sector. https://www.aspq.org/nos-outils/the-school-zone-and-nutrition-a-guide-for-the-municipal-sector/
- Berke, P. R., Godschalk, D. R., Kaiser, E. J., & Rodriguez, D. A. (Eds.). (2006). Urban land use planning (5th ed.). University of Illinois Press.
- Bower, K. M., Thorpe, R. J., Rohde, C., & Gaskin, D. J. (2014). The intersection of neighborhood racial segregation, poverty, and urbanicity and its impact on food store availability in the United States. Preventive Medicine, 58, 33–39. https://doi.org/10.1016/j.ypmed.2013.10.010
- Breyer, B., & Voss-Andreae, A. (2013). Food mirages: Geographic and economic barriers to healthful food access in Portland, Oregon. Health & Place, 24, 131–139. https://doi.org/10.1016/j.healthplace.2013.07.008
- Cairns, G., Angus, K., Hastings, G., & Caraher, M. (2013). Systematic reviews of the evidence on the nature, extent and effects of food marketing to children. A retrospective summary. Appetite, 62, 209–215. https://doi.org/10.1016/j.appet.2012.04.017
- Charreire, H., Casey, R., Salze, P., Simon, C., Chaix, B., Banos, A., Badariotti, D., Weber, C., & Oppert, J.-M. (2010). Measuring the food environment using geographical information systems: A methodological review. Public Health Nutrition, 13(11), 1773–1785. https://doi.org/10.1017/S1368980010000753
- Chatham, R. E., & Mixer, S. J. (2020). Cultural influences on childhood obesity in ethnic minorities: A qualitative systematic review. Journal of Transcultural Nursing, 31(1), 87–99. https://doi.org/10.1177/1043659619869428
- Clary, C. M., Ramos, Y., Shareck, M., & Kestens, Y. (2015). Should we use absolute or relative measures when assessing foodscape exposure in relation to fruit and vegetable intake? Evidence from a wide-scale Canadian study. Preventive Medicine, 71, 83–87. https://doi.org/10.1016/j.ypmed.2014.11.023
- Cutumisu, N., Traoré, I., Paquette, M.-C., Cazale, L., Camirand, H., Lalonde, B., & Robitaille, E. (2017). Association between junk food consumption and fast-food outlet access near school among Quebec secondary-school children: Findings from the Quebec Health Survey of High School Students (QHSHSS) 2010–11. Public Health Nutrition, 20(5), 927–937. https://doi.org/10.1017/S136898001600286X
- da Costa Peres, C. M., Gardone, D. S., Costa, B. V., de, L., Duarte, C. K., Pessoa, M. C., & Mendes, L. L. (2020). Retail food environment around schools and overweight: A systematic review. Nutrition Reviews, 78(10), 841–856. https://doi.org/10.1093/nutrit/nuz110
- Davis, B., & Carpenter, C. (2009). Proximity of fast-food restaurants to schools and adolescent obesity. American Journal of Public Health, 99(3), 505–510. https://doi.org/10.2105/AJPH.2008.137638
- Day, P. L., & Pearce, J. (2011). Obesity-promoting food environments and the spatial clustering of food outlets around schools. American Journal of Preventive Medicine, 40(2), 113–121. https://doi.org/10.1016/j.amepre.2010.10.018
- DeWeese, R. S., Ohri-Vachaspati, P., Adams, M. A., Kurka, J., Han, S. Y., Todd, M., & Yedidia, M. J. (2018). Patterns of food and physical activity environments related to children’s food and activity behaviors: A latent class analysis. Health & Place, 49, 19–29. https://doi.org/10.1016/j.healthplace.2017.11.002
- Díez, J., Cebrecos, A., Rapela, A., Borrell, L. N., Bilal, U., & Franco, M. (2019). Socioeconomic inequalities in the retail food environment around schools in a southern European context. Nutrients, 11(7), Article 1511. https://doi.org/10.3390/nu11071511
- DMTI Spatial. (2019). CanMap Content Suite, v2019.3. Abacus Data Network. https://abacus.library.ubc.ca/dataset.xhtml;jsessionid=3335293e5978953f76ebd6caaa3c?persistentId=hdl%3A11272.1%2FAB2%2FPCTBFN&version=1.0&q=&fileTypeGroupFacet=&fileAccess=Restricted&fileTag=%22Delta%2BLayers%22&fileSortField=&fileSortOrder=
- Downs, S., & Demmler, K. M. (2020). Food environment interventions targeting children and adolescents: A scoping review. Global Food Security, 27, Article 100403. https://doi.org/10.1016/j.gfs.2020.100403
- Drewnowski, A. (2009). Obesity, diets, and social inequalities. Nutrition Reviews, 67, S36–S39. https://doi.org/10.1111/j.1753-4887.2009.00157.x
- DuBreck, C. M., Sadler, R. C., Arku, G., & Gilliland, J. A. (2018). Examining community and consumer food environments for children: An urban-suburban-rural comparison in Southwestern Ontario. Social Science & Medicine, 209, 33–42. https://doi.org/10.1016/j.socscimed.2018.05.004
- Einstoss, C., Finkelstein, S., & Pimbert, H. (2015). Healthy food zones: Assessing food outlet density and purchasing behaviours of students.
- Engler-Stringer, R., Le, H., Gerrard, A., & Muhajarine, N. (2014). The community and consumer food environment and children’s diet: A systematic review. BMC Public Health, 14(1), 522. https://doi.org/10.1186/1471-2458-14-522
- ESRI. (2011). Understanding geodesic buffering. https://www.esri.com/news/arcuser/0111/geodesic.html
- Fleischhacker, S. E., Evenson, K. R., Rodriguez, D. A., & Ammerman, A. S. (2011). A systematic review of fast food access studies: Fast food access review. Obesity Reviews, 12(5), e460–e471. https://doi.org/10.1111/j.1467-789X.2010.00715.x
- Folkema, A., & Vandebelt, D. (2019). Waterloo region immigration profile—June 2019. https://www.regionofwaterloo.ca/en/regional-government/resources/Reports-Plans–Data/Public-Health-and-Emergency-Services/WR_ImmigrationProfile_2019.pdf
- The Food Trust. (2012). What we do: In corner stores. http://thefoodtrust.org/what-we-do/corner-store
- Gordon-Larsen, P. (2014). Food availability/convenience and obesity. Advances in Nutrition (Bethesda, Md.), 5(6), 809–817. https://doi.org/10.3945/an.114.007070
- Government of Canada. (2019). Key small business statistics—January 2019.
- Government of Canada. (2021). Census profile, 2016 census Waterloo, Regional Municipality [Census Division], Ontario and Canada [country]. Census Profile, 2016 Census - Waterloo, Regional municipality [Census division], Ontario and Canada [Country]. https://www12.statcan.gc.ca/census-recensement/2016/dp-pd/prof/details/page.cfm?Lang=E&Geo1=CD&Code1=3530&Geo2=PR&Code2=01&SearchText=Canada&SearchType=Begins&SearchPR=01&B1=All&TABID=1&type=1
- Government of Ontario. (2020a). School enrolment by gender—Ontario data catalogue. https://data.ontario.ca/dataset/school-enrolment-by-gender
- Government of Ontario. (2020b). School information and student demographics—Ontario data catalogue. https://data.ontario.ca/dataset/school-information-and-student-demographics/resource/602a5186-67f5-4faf-94f3-7c61ffc4719a
- Green, M. A., Radley, D., Lomax, N., Michelle, M. A., & Claire, G. (2018). Is adolescent body mass index and waist circumference associated with the food environments surrounding schools and homes? A longitudinal analysis. BMC Public Health, 18(1), Article 482. https://doi.org/10.1186/s12889-018-5383-z
- Hastings, G., Stead, M., Mcdermott, L., Forsyth, A., Mackintosh, A., Rayner, M., Godfrey, C., Caraher, M., & Angus, K. (2003). Review of research on the effects of food promotion to children. https://www.fabresearch.org/viewItem.php?id=11053
- He, M., Tucker, P., Gilliland, J., Irwin, J. D., Larsen, K., & Hess, P. (2012). The influence of local food environments on adolescents’ food purchasing behaviors. International Journal of Environmental Research and Public Health, 9(4), 1458–1471. https://doi.org/10.3390/ijerph9041458
- He, M., Tucker, P., Irwin, J. D., Gilliland, J., Larsen, K., & Hess, P. (2012). Obesogenic neighbourhoods: The impact of neighbourhood restaurants and convenience stores on adolescents’ food consumption behaviours. Public Health Nutrition, 15(12), 2331–2339. https://doi.org/10.1017/S1368980012000584
- Helmer, J. (2019, October 10). Why U.S. cities are banning new fast-food drive-throughs. NPR. https://www.npr.org/sections/thesalt/2019/10/10/765789694/why-u-s-cities-are-banning-new-fast-food-drive-throughs
- Hilmers, A., Hilmers, D. C., & Dave, J. (2012). Neighborhood disparities in access to healthy foods and their effects on environmental justice. American Journal of Public Health, 102(9), 1644–1654. https://doi.org/10.2105/AJPH.2012.300865
- Jang, S., & Kim, J. (2018). Remedying food policy invisibility with spatial intersectionality: A case study in the Detroit metropolitan area. Journal of Public Policy & Marketing, 37(1), 167–187. https://doi.org/10.1509/jppm.16.194
- Jeong, J., & Liu, C. Y. (2020). Neighborhood diversity and food access in a changing urban spatial structure. City & Community, 19(4), 963–986. https://doi.org/10.1111/cico.12426
- Kestens, Y., & Daniel, M. (2010). Social inequalities in food exposure around schools in an urban area. American Journal of Preventive Medicine, 39(1), 33–40. https://doi.org/10.1016/j.amepre.2010.03.014
- Kraft, A. N., Thatcher, E. J., & Zenk, S. N. (2020). Neighborhood food environment and health outcomes in U.S. low-socioeconomic status, racial/ethnic minority, and rural populations: A systematic review. Journal of Health Care for the Poor and Underserved, 31(3), 1078–1114. https://doi.org/10.1353/hpu.2020.0083
- Kumanyika, S., & Grier, S. (2006). Targeting interventions for ethnic minority and low-income populations. The Future of Children, 16(1), 187–207.
- Kwate, N. O. A., & Loh, J. M. (2010). Separate and unequal: The influence of neighborhood and school characteristics on spatial proximity between fast food and schools. Preventive Medicine, 51(2), 153–156. https://doi.org/10.1016/j.ypmed.2010.04.020
- Larson, N. I., Story, M. T., & Nelson, M. C. (2009). Neighborhood environments: Disparities in access to healthy foods in the U.S. American Journal of Preventive Medicine, 36(1), 74–81. https://doi.org/10.1016/j.amepre.2008.09.025
- Lind, P. L., Jensen, P. V., Glümer, C., & Toft, U. (2016). The association between accessibility of local convenience stores and unhealthy diet. The European Journal of Public Health, 26(4), 634–639. https://doi.org/10.1093/eurpub/ckv242
- Luan, H., Minaker, L. M., & Law, J. (2016). Do marginalized neighbourhoods have less healthy retail food environments? An analysis using Bayesian spatial latent factor and hurdle models. International Journal of Health Geographics, 15(1), 29. https://doi.org/10.1186/s12942-016-0060-x
- Mah, C. L., Cook, B., Rideout, K., & Minaker, L. M. (2016). Policy options for healthier retail food environments in city-regions. Canadian Journal of Public Health/Revue Canadienne de sante publique, 107(Suppl 1), 5343–eS64. https://doi.org/10.17269/cjph.107.5343
- Mah, C. L., Minaker, L. M., Jameson, K., Rappaport, L., Taylor, K., Graham, M., Moody, N., & Cook, B. (2017). An introduction to the healthy corner store intervention model in Canada. Canadian Journal of Public Health, 108(3), e320–324. https://doi.org/10.17269/CJPH.108.5801
- Mair, J. S., Pierce, M. W., & Teret, S. P. (2005). The city planner’s guide to the obesity epidemic: Zoning and fast food. https://www.jhsph.edu/research/centers-and-institutes/center-for-law-and-the-publics-health/research/ZoningCityPlannersGuide.pdf
- Marek, L., Hobbs, M., Wiki, J., Kingham, S., & Campbell, M. (2021). The good, the bad, and the environment: Developing an area-based measure of access to health-promoting and health-constraining environments in New Zealand. International Journal of Health Geographics, 20(1), 16 https://doi.org/10.1186/s12942-021-00269-x
- Matsuzaki, M., Sánchez, B. N., Acosta, M. E., Botkin, J., & Sanchez‐Vaznaugh, E. V. (2020). Food environment near schools and body weight: A systematic review of associations by race/ethnicity, gender, grade, and socio‐economic factors. Obesity Reviews, 21(4), e12997. https://doi.org/10.1111/obr.12997
- McCormack, L. A., & Meendering, J. (2016). Diet and physical activity in rural vs urban children and adolescents in the United States: A narrative review. Journal of the Academy of Nutrition and Dietetics, 116(3), 467–480. https://doi.org/10.1016/j.jand.2015.10.024
- Minaker, L. M., McCargar, L., Lambraki, I., Jessup, L., Driezen, P., Calengor, K., & Hanning, R. M. (2006). School region socio-economic status and geographic locale is associated with food behaviour of Ontario and Alberta adolescents. Canadian Journal of Public Health/Revue Canadienne de Santé Publique, 97(5), 357–361.
- Minaker, L. M., Shuh, A., Olstad, D. L., Engler-Stringer, R., Black, J. L., & Mah, C. L. (2016). Retail food environments research in Canada: A scoping review. Canadian Journal of Public Health/Revue Canadienne de Santé Publique, 107(Suppl. 1), eS4. https://doi.org/10.17269/cjph.107.5344
- Moudon, A. V., Drewnowski, A., Duncan, G. E., Hurvitz, P. M., Saelens, B. E., & Scharnhorst, E. (2013). Characterizing the food environment: Pitfalls and future directions. Public Health Nutrition, 16(7), 1238–1243. https://doi.org/10.1017/S1368980013000773
- Mui, Y., Khojasteh, M., Judelsohn, A., Sirwatka, A., Kelly, S., Gooch, P., & Raja, S. (2021). Planning for regional food equity. Journal of the American Planning Association, 87(3), 354–369. https://doi.org/10.1080/01944363.2020.1845781
- National Policy & Legal Analysis Network. (2009). Creating a healthy food zone around schools (report).
- Nykiforuk, C. I. J., Campbell, E. J., Macridis, S., McKennitt, D., Atkey, K., & Raine, K. D. (2018). Adoption and diffusion of zoning bylaws banning fast food drive-through services across Canadian municipalities. BMC Public Health, 18(1), 137. https://doi.org/10.1186/s12889-018-5061-1
- Ogden, C. L., Carroll, M. D., Lawman, H. G., Fryar, C. D., Kruszon-Moran, D., Kit, B. K., & Flegal, K. M. (2016). Trends in obesity prevalence among children and adolescents in the United States, 1988-1994 through 2013-2014. Journal of the American Medical Association, 315(21), 2292–2299. https://doi.org/10.1001/jama.2016.6361
- Ohri-Vachaspati, P., DeWeese, R. S., Acciai, F., DeLia, D., Tulloch, D., Tong, D., Lorts, C., & Yedidia, M. J. (2019). Healthy food access in low-income high-minority communities: A longitudinal assessment—2009–2017. International Journal of Environmental Research and Public Health, 16(13), 2354. https://doi.org/10.3390/ijerph16132354
- Olstad, D. L., Campbell, N. R. C., & Raine, K. D. (2019). Diet quality in Canada: Policy solutions for equity. CMAJ: Canadian Medical Association Journal/Journal de l'Association Medicale Canadienne, 191(4), E100–E102. https://doi.org/10.1503/cmaj.180938
- Ontario Professional Planners Institute (OPPI). (2011). Healthy communities and planning for food. Planning for food systems in Ontario—A call to action. https://ontarioplanners.ca/OPPIAssets/Documents/Calls-to-Action/oppi_media_release_june_24_2011.pdf
- Pinho, M., Mackenbach, J., Oppert, J.-M., Charreire, H., Bárdos, H., Rutter, H., Compernolle, S., Beulens, J., Brug, J., & Lakerveld, J. (2019). Exploring absolute and relative measures of exposure to food environments in relation to dietary patterns among European adults. Public Health Nutrition, 22(6), 1037–1047. https://doi.org/10.1017/S1368980018003063
- Pitt, T. M., Aucoin, J., HubkaRao, T., Goopy, S., Cabaj, J., Hagel, B., & McCormack, G. R. (2021). The relationship of urban form on children and adolescent health outcomes: A scoping review of Canadian evidence. International Journal of Environmental Research and Public Health, 18(8), 4180. https://doi.org/10.3390/ijerph18084180
- Poulsen, M. N., Glass, T. A., Pollak, J., Bandeen-Roche, K., Hirsch, A. G., Bailey-Davis, L., & Schwartz, B. S. (2019). Associations of multidimensional socioeconomic and built environment factors with body mass index trajectories among youth in geographically heterogeneous communities. Preventive Medicine Reports, 15, 100939. https://doi.org/10.1016/j.pmedr.2019.100939
- Powell, L. M., Slater, S., Mirtcheva, D., Bao, Y., & Chaloupka, F. J. (2007). Food store availability and neighborhood characteristics in the United States. Preventive Medicine, 44(3), 189–195. https://doi.org/10.1016/j.ypmed.2006.08.008
- Powell, P. K., Lawler, S., Durham, J., & Cullerton, K. (2021). The food choices of US university students during COVID-19. Appetite, 161, 105130. https://doi.org/10.1016/j.appet.2021.105130
- Public Health Agency of Canada. (2020). The Chief Public Health Officer’s report on the state of public health in Canada 2017—Designing healthy living. https://www.canada.ca/en/public-health/services/publications/chief-public-health-officer-reports-state-public-health-canada/2017-designing-healthy-living.html
- Region of Waterloo. (2016). Adult body mass index, Waterloo Region & Ontario, 2009–2010, 2011–2012, 2013–2014. Region of Waterloo quick stats. Region of Waterloo. https://www.regionofwaterloo.ca/en/regional-government/resources/Reports-Plans--Data/Public-Health-and-Emergency-Services/QSADULT_BODY_MASS_INDEX.pdf
- Region of Waterloo. (2020). Region of Waterloo: Population. https://www.regionofwaterloo.ca/en/regional-government/population.aspx#
- Region of Waterloo. (2021). Regional official plan. Region of Waterloo—Planning and Development Services. https://www.regionofwaterloo.ca/en/doing-business/Regional_Official_Plan.aspx#Regional-Official-Plan-ROP-Review
- Robitaille, E., Paquette, M.-C., Cutumisu, N., Lalonde, B., Cazale, L., Traoré, I., & Camirand, H. (2016). The food environment around public schools and the consumption of junk food for lunch by Quebec secondary school students (report). Institut National de Sante Publique du Quebec (INSPQ). https://www.inspq.qc.ca/pdf/publications/2143_food_environment_public_schools.pdf
- Rollins, L., Carey, T., Proeller, A., Anne Adams, M., Hooker, M., Lyn, R., Taylor, O., Holden, K., & Henry Akintobi, T. (2021). Community-based participatory approach to increase African Americans’ access to healthy foods in Atlanta, GA. Journal of Community Health, 46(1), 41–50. https://doi.org/10.1007/s10900-020-00840-w
- Sadler, R. C., Clark, A. F., Wilk, P., O’Connor, C., & Gilliland, J. A. (2016). Using GPS and activity tracking to reveal the influence of adolescents’ food environment exposure on junk food purchasing. Canadian Journal of Public Health/Revue Canadienne de Santé Publique, 107(Suppl. 1), eS14. https://doi.org/10.17269/cjph.107.5346
- Sadler, R. C., & Gilliland, J. A. (2015). Comparing children’s GPS tracks with geospatial proxies for exposure to junk food. Spatial and Spatio-Temporal Epidemiology, 14–15, 55–61. https://doi.org/10.1016/j.sste.2015.09.001
- Seliske, L. M., Pickett, W., Boyce, W. F., & Janssen, I. (2009a). Association between the food retail environment surrounding schools and overweight in Canadian youth. Public Health Nutrition, 12(9), 1384–1391. https://doi.org/10.1017/S1368980008004084
- Seliske, L. M., Pickett, W., Boyce, W. F., & Janssen, I. (2009b). Density and type of food retailers surrounding Canadian schools: Variations across socioeconomic status. Health Place, 15(3), 903–907. https://doi.org/10.1016/j.healthplace.2008.11.001
- Shareck, M., Lewis, D., Smith, N. R., Clary, C., & Cummins, S. (2018). Associations between home and school neighbourhood food environments and adolescents' fast-food and sugar-sweetened beverage intakes: Findings from the Olympic Regeneration in East London (ORiEL) Study. Public Health Nutrition, 21(15), 2842–2851. https://doi.org/10.1017/S1368980018001477
- Shearer, C., Rainham, D., Blanchard, C., Dummer, T., Lyons, R., & Kirk, S. (2015). Measuring food availability and accessibility among adolescents: Moving beyond the neighbourhood boundary. Social Science & Medicine, 133, 322–330. https://doi.org/10.1016/j.socscimed.2014.11.019
- Siegel, J. S., & Swanson, D. A. (Eds.). (2004). The methods and materials of demography (2nd ed.). Elsevier.
- Singh, G. K., Kogan, M. D., & Yu, S. M. (2009). Disparities in obesity and overweight prevalence among US immigrant children and adolescents by generational status. Journal of Community Health, 34(4), 271–281. https://doi.org/10.1007/s10900-009-9148-6
- Statistics Canada. (2018). North American Industry Classification System (NAICS) Canada 2012. https://www23.statcan.gc.ca/imdb/p3VD.pl?Function=getVD&TVD=118464
- Sturm, R., & Cohen, D. A. (2009). zoning for health? The year-old ban on new fast-food restaurants in south LA. Health Affairs (Project Hope), 28(6), W1088–W1097. https://doi.org/10.1377/hlthaff.28.6.w1088
- Sweeney, G., Rogers, C., Hoy, C., Clark, J., Usher, K., Holley, K., & Spees, C. (2015). Alternative agrifood projects in communities of color: A civic engagement perspective. Journal of Agriculture, Food Systems, and Community Development, 5(4), 69–75. https://doi.org/10.5304/jafscd.2015.054.005
- University of Waterloo. (2020). Food system roundtable. Our food future—Waterloo region. https://uwaterloo.ca/food-future-waterloo-region/about/food-system-roundtable
- University of Wisconsin Population Health Institute. (2020). Zoning regulations for fast food. County Health Rankings & Roadmaps. https://www.countyhealthrankings.org/take-action-to-improve-health/what-works-for-health/strategies/zoning-regulations-for-fast-food
- U.S. Centers for Disease Control and Prevention. (2010). Healthy places: Zoning. https://www.cdc.gov/healthyplaces/healthtopics/healthyfood/zoning.htm
- Wegener, J., Raine, K. D., & Hanning, R. M. (2012). Insights into the government’s role in food system policy making: Improving access to healthy, local food alongside other priorities. International Journal of Environmental Research and Public Health, 9(11), 4103–4121. https://doi.org/10.3390/ijerph9114103
- Williams, J., Scarborough, P., Matthews, A., Cowburn, G., Foster, C., Roberts, N., & Rayner, M. (2014). A systematic review of the influence of the retail food environment around schools on obesity-related outcomes. Obesity Reviews, 15(5), 359–374. https://doi.org/10.1111/obr.12142
- Xin, J., Zhao, L., Wu, T., Zhang, L., Li, Y., Xue, H., Xiao, Q., Wang, R., Xu, P., Visscher, T., Ma, X., & Jia, P. (2019). Association between access to convenience stores and childhood obesity: A systematic review. Obesity Reviews, 22(S1). https://doi.org/10.1111/obr.12908
- Zenk, S. N., & Powell, L. M. (2008). US secondary schools and food outlets. Health & Place, 14(2), 336–346. https://doi.org/10.1016/j.healthplace.2007.08.003