
Abstract
Problem, research strategy, and findings
Limiting housing and infrastructure in flood-prone places has long been recognized as critical to managing long-term risk. However, due to the difficulty of tracking development at small spatial scales, little empirical research has been conducted to explain differences between communities’ floodplain development patterns. We analyzed new construction across 5 million parcels in the state of North Carolina to develop standardized measures of floodplain development and evaluated the relationships between flood risk management effort and development outcomes. Statewide, for every property removed through buyouts from 1996 to 2017, more than 10 new residences were built in floodplains. At the community level, indicators of flood risk management effort (participation in the Community Rating System and use of buyouts) did not consistently align with floodplain development outcomes. Based on a sample of urban and suburban counties, we found more than 75,000 acres of vacant floodplain land currently zoned for development. Although we did not capture the full range of flood risk mitigation practices, results indicate that local development policies often run counter to efforts to limit long-term risk.
Takeaway for practice
Land use planning and floodplain management have the potential to play a larger role in flood risk mitigation. Modifying federal programs to more strongly disincentivize floodplain development could enhance local regulation and minimize future flood exposure. Given extensive undeveloped floodplain land and projected climate change, additional effort to manage development is needed to limit increases in flood risk.
In the face of escalating climate change, effectively managing the population and assets exposed to natural hazards is critical to limiting damages (APA, Citation2020). Recognizing the potential benefits of moving out of harm’s way, a growing number of communities around the world are grappling with the possibility of retreat (Dannenberg et al., Citation2019; Doberstein et al., Citation2020; Hino et al., Citation2017). However, without simultaneous efforts to limit new development in hazardous places, the population and infrastructure exposed to floods and other extreme weather events may continue to grow. Some communities may manage flood risk by encouraging new development away from floodplains and buying out existing flood-prone structures, whereas others may ignore floodplains altogether in their decision making. Although a growing body of research has examined hazard mitigation plans and policies (e.g., Butler et al., Citation2021; Lyles et al., Citation2014a), data on a key outcome of interest—floodplain development—have historically been scarce. As a result, surprisingly little is known about how floodplain development patterns vary across communities and the influence of policies, plans, and regulations.
We synthesized multiple building- and parcel-scale data sets to present novel evidence on the relationships between floodplain development, geographic and socioeconomic characteristics, and local flood risk management practices. First, we constructed measures of floodplain development—the amount of housing and infrastructure in the regulatory 100-year floodplain—over the past 2 decades. We did this for all communities in the state of North Carolina, enabling a systematic comparison across a larger geography and more diverse set of communities than previous analyses (Burby & French, Citation1981). Then, we evaluated how those floodplain development outcomes related to community characteristics and local flood risk management efforts. We assessed local flood risk management efforts through two indicators: use of property buyouts to remove housing from the floodplain and participation and score in the Community Rating System (CRS), a federal program promoting local flood risk management. We hypothesized that communities that actively bought out flood-prone properties and participated in the CRS would have experienced lower levels of floodplain development. Though past research has examined which communities implement such flood risk management practices and their risk reduction benefits (Brody et al., Citation2007; Li & Landry, Citation2018; Mach et al., Citation2019), the extent to which the CRS and property buyouts relate to floodplain development outcomes has not yet been evaluated at scale.
Evaluating floodplain development over time offers decision makers empirical evidence to support their own hazard mitigation and climate change adaptation planning efforts. For example, municipal regulations that seek to discourage floodplain development can be strengthened by adopting practices from peer communities that have effectively channeled new infrastructure and housing into safer areas. As climate change alters the frequency and severity of extreme weather events, establishing evidence-based policies for encouraging climate-smart development is urgently needed to address community flood risk (Intergovernmental Panel on Climate Change, Citation2021; Sweet et al., Citation2022).
We begin by reviewing the benefits of managing development in floodplains and the relevant planning and policy landscape in the United States. Next, we describe the data and methods used to address this study’s three main research questions:
How much development has occurred in North Carolina’s floodplains in the past two decades?
How does floodplain development relate to number of buyouts, participation in the CRS, and other community socioeconomic and geographic characteristics?
Based on current zoning, what is the potential for future floodplain development across the state?
Our analysis shows that new housing construction in floodplains has far outpaced property buyouts and that many of the communities actively mitigating risk through buyouts and participation in the CRS are also experiencing substantial floodplain development. Moreover, more than 75,000 acres of vacant floodplain land is zoned for development in a subset of 85 municipalities and counties within the state. We conclude with recommendations for more strongly incentivizing development management efforts that reduce flood risk.
Floodplain Management and Overlapping Jurisdictions
Managing development in hazardous locations such as floodplains has long been recognized as a critical component of broader efforts to limit damages from natural hazards. More than 60 years ago, Gilbert White, a pioneer in floodplain management study and practice, identified limiting development in floodplains as possibly “the single adjustment most likely to lead to a decline in national flood losses” (White, Citation1975, p. 89). Larger amounts of open space, wetlands, and the presence of clustered developments have all been linked to fewer flood losses (Brody et al., Citation2011; Brody & Highfield, Citation2013; Sun & Carson, Citation2020). Preventing development in flood-prone areas has been shown to substantially reduce risk: the cost of purchasing vacant floodplain land to prevent future development is often less than the avoided damages from flooding, in some cases by a factor of more than two to one (Atoba et al., Citation2021; Johnson et al., Citation2020). Despite the recognition of the benefits of reducing floodplain development, studies have indicated that the population and assets exposed to flood risk have been increasing over time in many places, though sometimes at a slower rate than in safer areas (Climate Central & Zillow, Citation2018; Ferguson & Ashley, Citation2017; Iglesias et al., Citation2021; Jongman et al., Citation2014; Patterson & Doyle, Citation2009).
However, few studies have linked observed floodplain development patterns to governance strategies, even though a range of local, state, and federal programs and policies influence development in floodplains. Local governments possess a range of tools to influence the location and character of new development. These can make it more difficult to develop in floodplains—for instance, through stringent flood-proofing requirements—or make it more attractive to develop in less hazardous locations, such as through tax incentives (Burby et al., Citation2000). Local governments also develop hazard mitigation plans (and, increasingly, climate change adaptation plans) that characterize risks and management strategies (Shi et al., Citation2015; Woodruff & Stults, Citation2016). These plans are inconsistent in whether they address land use at all, potentially due to a focus on emergency management rather than long-term planning (Lyles et al., Citation2014b). In Florida, plans concerning adaptation to sea level rise have discussed measures such as beach nourishment and elevation more often than measures to alter development patterns, perhaps due to political concerns about discouraging development (Butler et al., Citation2016, Citation2021).
States can also influence floodplain development by requiring local governments to develop plans that meet certain criteria and providing technical and financial support for hazard mitigation (Berke et al., Citation2014). For example, North Carolina mandates that local governments in coastal areas craft plans that address coastal ecosystem protection and natural hazards, in addition to economic growth (Norton, Citation2005). However, the effectiveness of state policy is not clear: Florida passed a state mandate requiring consideration of coastal high-hazard areas in comprehensive planning, but one study of Okaloosa County (FL) found that development rates in those areas actually increased afterwards, suggesting that stronger requirements or enforcement would be needed to prevent development (Chapin et al., Citation2008).
The federal government provides financial support for floodplain development through several mechanisms. The U.S. Federal Emergency Management Agency (FEMA) administers the National Flood Insurance Program (NFIP), which sets prices and mandates flood insurance coverage for most floodplain properties. To participate in the NFIP, communities must adopt a floodplain management ordinance that meets minimum criteria. In addition, federal funding covers most post-disaster recovery costs from major events, making it easier to stay and rebuild in flood-affected areas (Olshansky & Johnson, Citation2014). Federal funding for infrastructure, post-disaster assistance, and flood insurance has been shown to influence development patterns: within areas where those financial supports were removed by the Coastal Barrier Resources Act (CBRA), development rates were lower relative to nearby areas unaffected by the CBRA (Branham et al., Citation2022; Onda et al., Citation2020).
Community Flood Risk Management Measures
In this analysis, we focused on two measures of community flood risk management. The first was the CRS (Brody et al., Citation2009). This voluntary program, administered as part of the NFIP, provides discounts on flood insurance premiums to residents of participating communities based on specific flood risk mitigation activities. Local governments earn points based on which activities they undertake, and discounts scale with the number of points. Many of the highest point-scoring activities entail reducing or limiting floodplain development. CRS scores are higher in communities with higher incomes and education levels, and high CRS scores have been associated with reduced property damage from floods (Brody et al., Citation2008, Citation2009; Li & Landry, Citation2018). However, the CRS rewards communities for many different activities, including early warning systems and educational campaigns, and there are concerns that the insurance discounts incentivize development in floodplains (Brody & Highfield, Citation2013; Highfield et al., Citation2014). Thus, although communities participating in the CRS may be successfully reducing risk through other mechanisms, it is unclear whether they are limiting floodplain development as part of those efforts.
Some local governments, often with state and federal funding support, have sought to reduce risk through voluntary property buyout programs. Property buyouts, in which willing homeowners sell their flood-prone land to the government, occur predominantly in the aftermath of major floods and signal severe flood damage. The land is permanently restored to open space. Evaluations of buyout projects have shown that the avoided losses exceed project costs, and buyouts are often used to remove residential structures that were constructed under outdated building codes from the most flood-prone areas of a community (FEMA, 2010, Citation2013).
Buyouts require government and household willingness and capacity to carry out the process, and they are not straightforward to implement. Funding is often at least partially provided by federal agencies, but state and local sources are also typically required (Peterson et al., Citation2020). Lack of political will and administrative capacity can also pose barriers to buyout implementation (Curran-Groome et al., Citation2022; Koslov, Citation2016). Nationwide, buyouts are more common among wealthier and Whiter communities (Elliott et al., Citation2020; Mach et al., Citation2019). Because buyouts can serve multiple purposes, such as aiding household recovery, communities implementing buyouts may or may not be committed to floodplain management more broadly (Binder et al., Citation2020).
We focus here on participation in the CRS and use of buyouts and ask how these flood risk management efforts relate to floodplain development outcomes. Our focus on observed floodplain development across a broad range of communities makes our study most like that of Burby and French (Citation1981). They surveyed local officials in communities across the United States in 1979 and found that communities with the most advanced floodplain management programs also experienced the most floodplain development. However, their study relied on self-reported floodplain development estimates, and they excluded municipalities with small populations (Burby & French, Citation1981). To address these limitations, we developed standardized measures of floodplain development and flood risk management efforts across a large set of communities of varying geographic and socioeconomic characteristics. These methodological and data improvements enabled us to provide more recent and consistent insight into our research questions.
Data and Methods
We describe our methods with respect to each of our three research questions. First, we constructed statewide measures of floodplain development. We then evaluated floodplain development at the community scale and examined how floodplain development relates to use of buyouts, participation and performance in the CRS, and other socioeconomic and geographic characteristics. Finally, we assessed the potential for future floodplain development in a subset of our study area communities based on current zoning regulations.
The spatial scope of the study is the state of North Carolina, which has substantial inland and coastal flood exposure, extensive data on flood hazards, and a long history of property buyouts (Mach et al., Citation2019; North Carolina Floodplain Mapping Program, Citation2020). From 1991 through 2020, 29 major disaster declarations for floods or storms have been issued for the state (FEMA, Citation2022). Recent flood disasters include Hurricane Florence in 2018, which caused more than $22 billion in damage across the eastern half of the state, and Tropical Storm Fred in 2021, which caused six fatalities in the mountainous west (Kunkel et al., Citation2020; North Carolina Department of Public Safety, Citation2021). Six of the seven heaviest precipitation events on record have occurred since 1999, a trend that is likely to continue with climate change (Paerl et al., Citation2019). North Carolina has also experienced rapid population growth over that time period, increasing from 8.0 million in 2000 to 9.5 million in 2010 and 10.4 million in 2020, with much of the growth in and around urban centers (Tippett, Citation2021; U.S. Census Bureau, Citation2022). The combination of consistent growth and frequent flooding made North Carolina an ideal state for this analysis.
The unit of analysis (a community) refers to incorporated cities and towns (generally equivalent to U.S. Census–designated places), unincorporated parts of counties, and tribal areas. These were identified using the community boundaries from the U.S. Census (U.S. Census Bureau, Citation2018a). This definition of community matches the NFIP’s Participating Community designation (FEMA, n.d.). We selected this local unit because most decisions about permitting, zoning, floodplain management (including floodplain manager designations), and other development management policies are made at that scale. In addition, to participate in the NFIP, communities must commit to certain policies, adopt minimum standards, and meet reporting requirements.
Flood hazard information was sourced from FEMA’s Digital Flood Insurance Rate Maps (DFIRMs), which are widely used in local policy and regulation, including insurance rate-setting and building code enforcement (Kousky et al., Citation2016). Though we recognize that these maps are often out of date and may underestimate flood hazards (Association of State Floodplain Managers, Citation2020), they are also a primary source of information for local governments and carry regulatory force regardless of their accuracy. These maps identify areas with a 1% or greater chance of flooding in any given year (100-year floodplains), as well as areas with a 0.2% to 1% chance of flooding (500-year floodplains). We used the 100-year floodplain boundaries as our definition of the floodplain. Recent insurance pricing reform (Risk Rating 2.0), which occurred after our study time period, has reduced reliance on these zones for setting prices, but they are still used for determining where flood insurance is required (FEMA, Citation2021). We used DFIRMs from 2020 and 2021, so it is possible that the digitized maps diverge from the official local delineations used in permitting at the time of construction due to map revisions and Letters of Map Change. Some residences that we identified as floodplain construction may not have been in the floodplain at the time that they were built, and we may have also missed construction that was in the floodplain at one time and has since been removed.
Measuring Statewide Floodplain Development
We measured two forms of new development: residential construction and impervious surface cover. Our primary results focus on residential construction, and methods and results for our impervious surface analysis are included in the Technical Appendix.
We tracked new residential construction using the State of North Carolina’s harmonized parcel database (NC Geographic Information Coordinating Council, Citation2020) and Zillow, Inc.’s ZTRAX parcel-level real estate database (Zillow, Citation2020). We joined the two using parcel identification numbers and spatial information to minimize missingness of land use type (residential/commercial/other) and year built information. Including only residential parcels, we overlaid building and parcel locations on regulatory floodplain maps to classify their flood zones. We calculated the total amount of new housing constructed from 1996 through 2017 and the share of that housing within the floodplain. The processes for merging the two parcel data sets and defining flood zone presence are explained in the Technical Appendix and in the replication code.
The number of parcels we tabulated may differ from the number of households and housing units. Multifamily buildings, for example, are typically represented as a single parcel when they have a single owner for tax purposes, so our property-level estimates were not equivalent to the number of households or people living in the floodplain. In addition, we relied on construction dates, assessed values, and land use classifications reported in tax assessor data. The completeness and accuracy of this information may differ across communities and over time, and errors may have affected our development estimates, especially for small communities. For example, of the residential parcels with a building, 6.8% did not have any information on year built and were omitted from our estimates.
Elevation or freeboard requirements for floodplain housing are commonly used to reduce risk. In addition to considering horizontal avoidance of the floodplain, we considered vertical avoidance by integrating building-specific first-floor elevation data and base flood elevations (BFEs) from the North Carolina Flood Risk Information System (North Carolina Floodplain Mapping Program, Citation2020). The BFE refers to the depth of water associated with the 1% annual chance flood event; the higher the first-floor elevation relative to the BFE, the less likely it is that the structure will flood. We assigned BFEs to buildings using the maximum BFE (10-ft spatial resolution) on the building footprint (see the Technical Appendix). We evaluated time trends and geographic patterns in the difference between the first-floor elevation and the BFE at the building level. The first-floor elevation data were collected in 2010, so we only examined housing originally constructed prior to 2010.
Linking Floodplain Development Outcomes to Community Characteristics
To identify communities that have experienced either high or limited floodplain development, we constructed measures of a) how much development has occurred in floodplains, as a share of total development; and b) how much developable land within the community is within the floodplain, as a share of total developable land. By examining the share of floodplain development in relation to the share of floodplain land, we accounted for differences across communities in growth pressure and exposure to flooding.
For example, take a community with 85% of its developable land in the floodplain. If new development were randomly scattered across the community, we would expect 85% of it to fall within the floodplain. If, in practice, only 20% of new development has been within the floodplain, it would indicate that the community has experienced limited floodplain development relative to the extent of the hazard. On the other hand, if 100% of new development were in the floodplain, it would represent disproportionately high levels of floodplain development.
We measured developable land to estimate the community’s share of developable land in the floodplain. Starting with total community area, we used the 2016 National Land Cover Dataset (Homer & Fry, Citation2012) to remove open water and perennial ice or snow (classes 11 and 12). Next, we removed land in protected areas using the U.S. Geological Survey’s Protected Area Database of the United States (U.S. U.S. Geological Survey Gap Analysis Project, Citation2020). Finally, we removed areas that were steeper than 25% grade because those areas are more physically difficult to develop, but we tested the sensitivity of our results to that exclusion. We then overlaid the flood zone data to calculate the community’s share of developable land within the floodplain. Additional details on our definitions of developable land are provided in the Technical Appendix and replication code.
We evaluated floodplain development patterns along several measures of community characteristics. We aggregated the parcel data to estimate median assessed value for residential property within a community as a proxy for wealth. In addition, we organized communities on a spectrum from rural to urban based on the share of their area classified as either an urbanized area or an urban cluster (U.S. Census Bureau, Citation2018b). Finally, we delineated between coastal and inland properties using the flood zone designations in the DFIRMs; communities with at least one property in the VE zones, which are exposed to wave action, were marked as coastal communities.
We also compared floodplain development in communities with different degrees of investment in flood risk management. Our first indicator of local flood risk management effort was the number of property buyouts occurring in the community. Our data set of buyouts in North Carolina was derived from a combination of sources, including data provided by the North Carolina Department of Emergency Management, Charlotte–Mecklenburg Stormwater Management Department, and multiple Freedom of Information Act requests to FEMA. After an extensive cleaning and review process to integrate the diverse data sets, we used the parcel characteristics of buyout properties to assess the validity of each record and remove properties that were unlikely to be buyouts (see the Technical Appendix). Buyout years were assigned based on the date that the mitigation was completed, if available, and then by the year approved.
Our second indicator of flood risk management effort was participation and performance in the CRS (Zahran et al., Citation2010). We obtained CRS scores from FEMA documentation in 2007 (the oldest report we could find) and 2016. For each year, communities were categorized as either a high performer with a score of 7 or lower, a low performer with a score of 8 or 9, and otherwise not participating. We also evaluated the change in community rating over time: If a community’s score improved from 2007 to 2016 or if they went from not participating to participating, they were classified as improving. If their score worsened or they dropped out of the program, they were classified as worsening.
We tested for differences across groups using χ2 tests and calculated p values using a Monte Carlo simulation of 10,000 replicates. Where there was a clear order to the categories, we used the χ2 test for trends.
Evaluating Future Floodplain Development Potential
Open space protection and zoning demonstrate the limitations, or lack thereof, on future floodplain development. Current zoning data were compiled from county and municipal governments with a primary focus on urban and suburban counties, defined as having population densities of more than 750 people/mi2 and 250 to 750 people/mi2, respectively (North Carolina Rural Center, Citation2015). The zoning classifications were harmonized into single-family residential, multifamily, mixed use, and open space categories and overlaid onto parcels. Based on the availability and completeness of zoning data, we ultimately included 85 communities in this analysis. We then overlaid protected areas from the Protected Area Database of the United States to identify parcels that had been protected; protected parcels were not considered developable.
We defined developable floodplain area as parcels that were a) currently vacant but could be developed or b) currently single-family but zoned for multifamily or mixed use. We also used parcel geometries to exclude small, highly irregularly shaped parcels that would be difficult to develop. Additional detail on this process is provided in the Technical Appendix.
Results
Measuring Statewide Floodplain Development Outcomes
Construction of new housing in North Carolina floodplains has far outstripped collective efforts to remove houses from flood-prone areas ( and ). From 1996 (the first year of property buyouts in our data) through 2017, 5,234 properties were bought out and restored to open space, whereas more than 59,000 parcels were developed into residential uses. Single-family homes represented 47,414 of the new housing parcels. The total of statewide buyout efforts over 22 years is equivalent to just 2 to 3 years of new construction in the floodplain.
Figure 1. New floodplain housing has been constructed across the state, whereas buyouts are clustered in certain areas. Map depicts new floodplain construction (circles) and voluntary property buyouts (crosses) in North Carolina from 1996 to 2017.
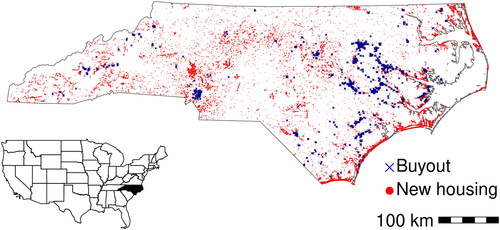
Figure 2. Construction of new housing in the floodplain far exceeded property buyouts in North Carolina over the last 2 decades. a) Time series of all residential construction, single-family homes, and buyouts per year. The y-axis represents the number of residential parcels either bought out or developed in each year. New construction was assigned to years based on the year built, and buyouts were assigned to years based on our best estimate of the completion date. Major hurricane events are represented by vertical lines. b) The share of residential construction in the floodplain increased from approximately 4% in the late 1990s up to 6% from 2011 through 2017.
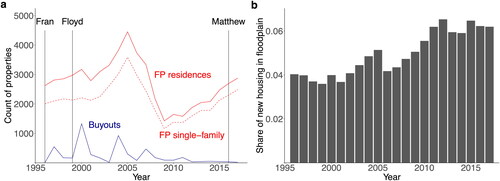
Although floodplain housing construction appeared to drop in the late 2000s, this trend was due to a decrease in the overall rate of construction rather than a decrease specific to floodplains. In fact, the share of residential construction in floodplains increased over the same period from 4% to 6%.
Not all floodplain development contributes equally to flood risk; elevation and other flood-proofing measures can reduce the expected damage from flood events. The NFIP requires residences in participating communities to be built above the BFE, and local ordinances can mandate even higher standards. We found that first-floor elevations of all floodplain structures (not just residential structures) gradually increased over time relative to today’s BFEs, with newer buildings therefore less likely to be inundated than older ones (see the Technical Appendix). Floodplain structures were built at a median of 1.6 ft above BFE in 1990 and 3.3 ft above BFE in 2009. However, this trend was not consistent across all communities, and even after elevating, substantial damage is still possible (Tonn & Guikema, Citation2018).
Linking Floodplain Development Outcomes to Community Characteristics
Because communities face different flood hazard and development pressures, we considered the share of development in the floodplain relative to the share of developable land in the floodplain. We refer to communities where the share of new housing in the floodplain exceeds the share of developable land in the floodplain as communities with high levels of floodplain development. Communities with a lower share of new housing in the floodplain than developable land are referred to as communities with limited levels of floodplain development. We identified 81 communities with no developable floodplain land and 22 with no new housing built from 1996 to 2017; these were not included in the final analysis.
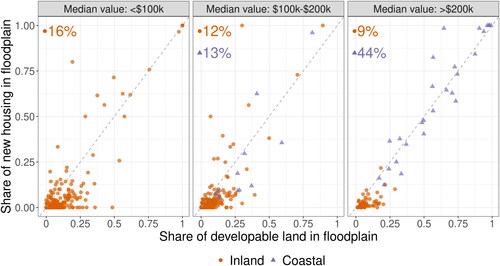
Examining floodplain development patterns at the community scale, results showed that wealth and geography were strongly associated with floodplain development patterns (). Among communities with high property values, more coastal communities exhibited high floodplain development rates than inland communities. Of the inland communities with median assessed property values above $200,000, just 9% (6 of 70) had high rates of housing construction in the floodplain (, right panel). In contrast, of the coastal communities in the same wealth category, 44% (12 of 27) exhibited similarly high rates (p < .001). The share of inland communities with high floodplain development rates declined as property values increased, though this difference was not statistically significant (p = .11).
Figure 3. Floodplain development patterns differed along wealth and geographic lines. Panels group communities based on the median assessed property value, with the least expensive properties on the left and the most expensive on the right. Color and shape demarcate inland and coastal communities. The percentages report the share of communities in that panel with high floodplain development rates (above the diagonal line), split between inland communities (circles) and coastal communities (triangles).
Floodplain development trends also differed across urban and rural communities. Twenty-two percent (38 of 172) of communities with no urban areas experienced high rates of floodplain housing development compared with 10% (15 of 151) of communities with more than three-quarters of their land in urban areas, a statistically significant difference (p < .01). Thus, although urban centers were often responsible for large numbers of new residences built in the floodplain, the results differed sharply when adjusted for exposure and overall growth rates.
Linking Development Outcomes With Flood Risk Management Measures
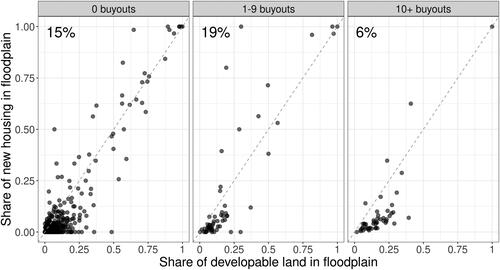
Fifteen percent (68 of 444) of communities with 0 buyouts and 19% (11 of 58) of communities with 1 to 9 buyouts exhibited high levels of new housing in the floodplain (). Of the communities with 10 or more buyouts, only 6% (3 of 49) had high levels of floodplain housing, but differences across the three groups were not statistically significant (p = .16).
Figure 4. Buyouts were not strongly associated with floodplain development rates. Panels group communities based on the number of buyouts taking place within them. The percentages report the share of communities in that panel with high floodplain development rates (above the diagonal line).
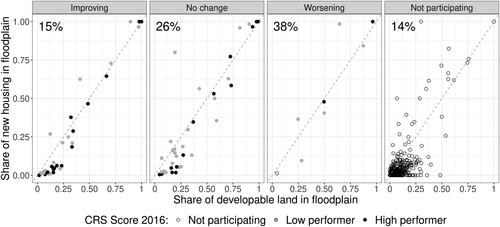
Our analysis of CRS performance used two measures: the CRS score in 2016 (grouped into high performers, low performers, and nonparticipants) as well as the change in score between 2007 and 2016 (grouped into improving, no change, worsening, and not participating). We hypothesized that communities performing well under the CRS would also have relatively low levels of floodplain development, given the CRS’s emphasis on floodplain management. However, our findings did not support this hypothesis (). Only 14% (63 of 466) of communities not participating in the CRS had high levels of floodplain development, compared with 22% (19 of 85) of communities participating (p = .05). All communities that meet NFIP requirements are eligible to participate in the CRS, but many choose not to participate due to the administrative requirements. Within participating communities, low performers and high performers had very similar shares of communities with high floodplain development (23% and 22%, respectively). Although the share of communities with high floodplain development increased when moving from improving to no change to worsening groups, the trend was not statistically significant (p = .12).
Figure 5. Participation and stronger performance in the CRS were not strongly associated with improved floodplain development outcomes. Panels group communities based on the change in CRS score between 2007 and 2016, and color indicates the community’s CRS score in 2016. The percentages report the share of communities in that panel with high floodplain development rates (above the diagonal line).
Evaluating Future Floodplain Development Potential
We found numerous floodplain areas where additional development was permitted to occur in the future. Zoning data were not readily available for the entire state, but our compiled data set covered 74 incorporated municipalities and 11 counties (see the Technical Appendix). Within this subset of North Carolina communities, there were more than 75,000 acres of undeveloped floodplain land zoned for either single-family, multifamily, or mixed-use development. Moreover, an additional 2,522 floodplain parcels were used as single-family housing but zoned for densification (multifamily or mixed use). Particularly considering the likely expansion of floodplains as the climate changes, these findings indicate substantial potential for continued creation of future liabilities in hazardous locations across the state.
Discussion
These results demonstrate a new method for comparing floodplain development outcomes across community contexts, and they provide insight into which communities are and are not developing in the floodplain. Our analysis demonstrates that commonly used indicators for flood risk mitigation effort—the CRS and buyouts—did not consistently reflect floodplain development outcomes in North Carolina communities. This finding resonates with Burby and French (Citation1981), who theorized that mitigation investments were motivated only after widespread development has already taken place. Moreover, there is substantial potential for future floodplain development across the state. Although the CRS and buyouts address risk after development has already occurred, our findings suggest the need for greater attention to flood risk in development decision making.
The differences in floodplain development along wealth and geographic lines demonstrate that risk is socially constructed in multiple ways, affecting not only what structures are in harm’s way but also who is in harm’s way. In coastal areas, wealthy households may choose to take on risk, whereas in many inland areas, individuals may lack affordable alternatives and end up in hazardous places as a result. The two contexts present different challenges from a flood risk management perspective. For example, as the U.S. government reforms flood insurance pricing and climate hazards worsen, it is likely to become more expensive to live in flood-prone areas (FEMA, Citation2021). Such changes may have little effect on those building nonprimary residences but pose a substantial burden for low-income households with few alternative housing options. Property buyouts also pose different concerns for marginalized communities, because those households may have few safe options to which to move, and relocating may disrupt valuable social networks and cultural ties (Kraan et al., Citation2021). Considering the different circumstances of current and potential future floodplain residents can help planners develop climate risk management efforts that align with housing needs and avoid putting vulnerable households at further risk.
Differences in Development Patterns Across Communities
Local approaches to flood risk management are shaped by both willingness and capacity to adopt different strategies. For example, our finding that high levels of floodplain development were more common among rural communities than urban communities may be due to staff capacity to implement or enforce development restrictions. Regional collaboration or state-level support for floodplain management can help address capacity constraints, with particular benefits for hydrologically connected communities where upstream development affects downstream risk.
Communities with higher capacity (larger tax base, higher incomes, higher education) generally score higher in the CRS and participate in buyouts, so continued floodplain development in those areas is likely less affected by lack of capacity (Brody et al., Citation2009; Li & Landry, Citation2018; Mach et al., Citation2019). Modifications to the CRS and buyout programs can encourage those communities to integrate flood risk concerns more strongly into development decisions; for instance, by providing additional incentives for communities who restrict development or densification in areas proximate to buyout properties. Re-examining the reward structure of the CRS—reduced flood insurance premiums—may also be needed to avoid indirectly encouraging floodplain development without jeopardizing the affordability and uptake of insurance (Brody et al., Citation2007). Given economic incentives to continue developing, such efforts can encourage planners to consider the economic and ecological benefits of preventing development in the most flood-prone areas beforehand, rather than seeking out buyouts after the fact.
Though we document widespread floodplain development, there are positive examples of communities across the United States that recognize the importance of constraining development in hazardous areas. The city of Raleigh (NC) recently passed an ordinance to prevent construction on vacant floodplain lots larger than 0.5 acre (City of Raleigh, Citation2022). In Staten Island (NY), a dedicated Special Coastal Risk District zoning was applied to prevent additional densification in neighborhoods that were partially bought out after Superstorm Sandy (NYC Planning, Citationn.d.). Deeper integration of planners, emergency managers, and other stakeholders in development of plans and permitting decisions can strengthen consideration of land use in risk management (Lyles et al., Citation2014b). Coordination with plans for other infrastructure, such as affordable housing and transportation, can also help promote development in safer areas and discourage it in hazardous areas.
Multiple Approaches to Managing Flood Risk
Avoiding development in floodplains is not the only way to reduce risk, and continued floodplain development may indicate that communities are pursuing other strategies for flood risk management. For example, the CRS rewards a range of other flood risk mitigation activities, so communities with high scores may be focusing their efforts on elevation, early warning systems, or public information campaigns, rather than limiting floodplain development. Similarly, communities may be buying out the most flood-prone homes while continuing to permit floodplain development that meets the most stringent building codes. Future research can delve more deeply into how communities choose their approaches to risk management.
New development does not nullify the risk-reducing benefits of buyouts, early warning systems, or public information campaigns. More broadly, our results are not necessarily indicative of success in floodplain management because some communities may have built out their floodplains already and thus face little new development pressure in flood-prone areas. However, our results do indicate that many communities have room for improvement when it comes to managing development. The FEMA-designated floodplains we evaluated are most salient from a regulatory perspective, but they do not capture all drivers of flood hazards, nor do they reflect future changes in flood hazard. Managing development both inside and outside regulatory floodplains will likely become increasingly important for planners as the climate changes.
Evaluating the impacts of different floodplain management approaches on development is a critical next step for informing planning practice. Although the results presented here illustrate statewide trends, quasi-experimental analyses can provide greater insight into the impacts of specific regulatory tools or plans, ranging from federal to local scales. For example, withdrawal of federal support through the CBRA was associated with reduced rates of new development (Branham et al., Citation2022), and it will be useful to evaluate whether flood insurance pricing reform (Risk Rating 2.0) has a similar discouraging effect. In-depth analysis of the impacts of local floodplain regulations and development plans, including political and economic drivers and obstacles, will provide valuable lessons about the extent to which practices are generalizable across contexts.
Managing land use in hazardous areas such as floodplains can contribute substantially to reducing damages and risk. Local governments, with their zoning and permitting authorities, play a critical role in flood risk management. Yet, our understanding of where floodplain development is occurring—and what measures can effectively encourage growth in less hazardous areas—is limited. Our results provide new insight into the extent and geography of floodplain development at statewide and community scales. Further, we have shown that many communities participating in federal flood risk management programs have continued to develop substantially in floodplains.
At the local level, increasing capacity and promoting stronger coordination between land use planning and hazard mitigation efforts can improve outcomes. At state and federal levels, providing additional resources through existing programs can enable and encourage more widespread development management efforts. As sea levels rise and storms become more intense, identifying and disseminating effective strategies for managing floodplain development are urgently needed to reduce future losses across the United States.
Research Support
This study was performed with support from the University of North Carolina Policy Collaboratory and the U.S. National Science Foundation’s Humans, Disasters, and Built Environment program (Grant No. 2044929).
Technical Appendix
Download PDF (4.7 MB)ACKNOWLEDGMENTS
We thank the North Carolina Department of Emergency Management for sharing data used in this article. In addition, we thank Phil Berke for comments on an earlier draft.
Data Availability Statement
Detailed results and replication code are available at https://doi.org/10.15139/S3/USWRGZ. Data were provided by Zillow through the Zillow Transaction and Assessment Dataset (ZTRAX). More information on accessing the data can be found at http://www.zillow.com/ztrax. ZTRAX data and address-level buyout records cannot be shared publicly, but all other data sources are public. The results and opinions are those of the authors and do not reflect the position of Zillow Group.
SUPPLEMENTAL MATERIAL
Supplemental data for this article is available online at https://doi.org/10.1080/01944363.2022.2141821.
Additional information
Notes on contributors
Miyuki Hino
MIYUKI HINO ([email protected]) is an assistant professor at the University of North Carolina at Chapel Hill.
Todd K. BenDor
TODD K. BENDOR ([email protected]) is a professor at the University of North Carolina at Chapel Hill.
Jordan Branham
JORDAN BRANHAM ([email protected]) is a graduate student at the University of North Carolina at Chapel Hill.
Nikhil Kaza
NIKHIL KAZA ([email protected]) is a professor at the University of North Carolina at Chapel Hill.
Antonia Sebastian
ANTONIA SEBASTIAN ([email protected]) is an assistant professor at the University of North Carolina at Chapel Hill.
Shane Sweeney
SHANE SWEENEY ([email protected]) is a recent graduate of the University of North Carolina at Chapel Hill.
REFERENCES
- American Planning Association. (2020). Climate change policy guide. https://www.planning.org/publications/document/9210766/
- Association of State Floodplain Managers. (2020). Flood mapping for the nation: A cost analysis for completing and maintaining the nation’s NFIP flood map inventory. https://biotech.law.lsu.edu/blog/Flood_Mapping_for_the_Nation_ASFPM_Report_3-1-2013.pdf
- Atoba, K., Newman, G., Brody, S., Highfield, W., Kim, Y., & Juan, A. (2021). Buy them out before they are built: Evaluating the proactive acquisition of vacant land in flood-prone areas. Environmental Conservation, 48(2), 118–126. https://doi.org/10.1017/S0376892921000059
- Berke, P. R., Lyles, W., & Smith, G. (2014). Impacts of federal and state hazard mitigation policies on local land use policy. Journal of Planning Education and Research, 34(1), 60–76. https://doi.org/10.1177/0739456X13517004
- Binder, S. B., Greer, A., & Zavar, E. (2020). Home buyouts: A tool for mitigation or recovery? Disaster Prevention and Management, 29(4), 497–510. https://doi.org/10.1108/DPM-09-2019-0298
- Branham, J., Kaza, N., BenDor, T. K., Salvesen, D., & Onda, K. (2022). Removing federal subsidies from high-hazard coastal areas slows development. Frontiers in Ecology and the Environment, 20(9), 500–506. https://doi.org/10.1002/fee.2532
- Brody, S. D., Gunn, J., Peacock, W., & Highfield, W. E. (2011). Examining the influence of development patterns on flood damages along the Gulf of Mexico. Journal of Planning Education and Research, 31(4), 438–448. https://doi.org/10.1177/0739456X11419515
- Brody, S. D., & Highfield, W. E. (2013). Open space protection and flood mitigation: A national study. Land Use Policy, 32, 89–95. https://doi.org/10.1016/j.landusepol.2012.10.017
- Brody, S. D., Zahran, S., Highfield, W. E., Bernhardt, S. P., & Vedlitz, A. (2009). Policy learning for flood mitigation: A longitudinal assessment of the community rating system in Florida. Risk Analysis, 29(6), 912–929. https://doi.org/10.1111/j.1539-6924.2009.01210.x
- Brody, S. D., Zahran, S., Highfield, W. E., Grover, H., & Vedlitz, A. (2008). Identifying the impact of the built environment on flood damage in Texas. Disasters, 32(1), 1–18. https://doi.org/10.1111/j.1467-7717.2007.01024.x
- Brody, S. D., Zahran, S., Maghelal, P., Grover, H., & Highfield, W. E. (2007). The rising costs of floods: Examining the impact of planning and development decisions of property damage in Florida. Journal of the American Planning Association, 73(3), 330–345. https://doi.org/10.1080/01944360708977981
- Burby, R. J., Deyle, R. E., Godschalk, D. R., & Olshansky, R. B. (2000). Creating hazard resilient communities through land-use planning. Natural Hazards Review, 1(2), 99–106. https://doi.org/10.1061/(ASCE)1527-6988(2000)1:2(99)
- Burby, R. J., & French, S. P. (1981). Coping with floods: The land use management paradox. Journal of the American Planning Association, 47(3), 289–300. https://doi.org/10.1080/01944368108976511
- Butler, W. H., Deyle, R. E., & Mutnansky, C. (2016). Low-regrets incrementalism: Land use planning adaptation to accelerating sea level rise in Florida’s coastal communities. Journal of Planning Education and Research, 36(3), 319–332. https://doi.org/10.1177/0739456X16647161
- Butler, W., Holmes, T., & Lange, Z. (2021). Mandated planning for climate change: Responding to the Peril of Flood Act for sea level rise adaptation in Florida. Journal of the American Planning Association, 87(3), 370–382. https://doi.org/10.1080/01944363.2020.1865188
- Chapin, T. S., Deyle, R. E., & Baker, E. J. (2008). A parcel-based GIS method for evaluating conformance of local land-use planning with a state mandate to reduce exposure to hurricane flooding. Environment and Planning B: Planning and Design, 35(2), 261–279. https://doi.org/10.1068/b32114
- City of Raleigh. (2022). Floodplain regulations. https://raleighnc.gov/projects/content/PWksStormwater/Articles/UpdatingFloodRegulations.html
- Climate Central, & Zillow. (2018). Ocean at the door: New homes and the rising sea. http://assets.climatecentral.org/pdfs/Nov2018_Report_OceanAtTheDoor.pdf?pdf=OceanAtTheDoor-Report
- Curran-Groome, W., Hino, M., BenDor, T. K., & Salvesen, D. (2022). Complexities and costs of floodplain buyout implementation. Land Use Policy, 118, 106128. https://doi.org/10.1016/j.landusepol.2022.106128
- Dannenberg, A. L., Frumkin, H., Hess, J. J., & Ebi, K. L. (2019). Managed retreat as a strategy for climate change adaptation in small communities: Public health implications. Climatic Change, 153(1–2), 1–14. https://doi.org/10.1007/s10584-019-02382-0
- Doberstein, B., Tadgell, A., & Rutledge, A. (2020). Managed retreat for climate change adaptation in coastal megacities: A comparison of policy and practice in Manila and Vancouver. Journal of Environmental Management, 253, 109753. https://doi.org/10.1016/j.jenvman.2019.109753
- Elliott, J. R., Brown, P. L., & Loughran, K. (2020). Racial inequities in the federal buyout of flood-prone homes: A nationwide assessment of environmental adaptation. Socius: Sociological Research for a Dynamic World, 6, 237802312090543. https://doi.org/10.1177/2378023120905439
- Ferguson, A. P., & Ashley, W. S. (2017). Spatiotemporal analysis of residential flood exposure in the Atlanta, Georgia metropolitan area. Natural Hazards, 87(2), 989–1016. https://doi.org/10.1007/s11069-017-2806-6
- Highfield, W. E., Brody, S. D., & Blessing, R. (2014). Measuring the impact of mitigation activities on flood loss reduction at the parcel level: The case of the Clear Creek watershed on the upper Texas coast. Natural Hazards, 74(2), 687–704. https://doi.org/10.1007/s11069-014-1209-1
- Hino, M., Field, C. B., & Mach, K. J. (2017). Managed retreat as a response to natural hazard risk. Nature Climate Change, 7(5), 364–370. https://doi.org/10.1038/nclimate3252
- Homer, C., & Fry, J. (2012). The national land cover database. U.S. Geological Survey Fact Sheet, February, 1–4. http://pubs.usgs.gov/fs/2012/3020/
- Iglesias, V., Braswell, A. E., Rossi, M. W., Joseph, M. B., McShane, C., Cattau, M., Koontz, M. J., McGlinchy, J., Nagy, R. C., Balch, J., Leyk, S., & Travis, W. R. (2021). Risky development: Increasing exposure to natural hazards in the United States. Earth’s Future, 9(7), 1–20. https://doi.org/10.1029/2020EF001795
- Intergovernmental Panel on Climate Change. (2021). Summary for policymakers. Climate change 2021: The physical science basis. Contribution of working group I to the sixth assessment report of the intergovernmental panel on climate change. https://doi.org/10.1017/9781009157896.001
- Johnson, K. A., Wing, O. E. J., Bates, P. D., Fargione, J., Kroeger, T., Larson, W. D., Sampson, C. C., & Smith, A. M. (2020). A benefit-cost analysis of floodplain land acquisition for US flood damage reduction. Nature Sustainability, 3(1), 56–62. https://doi.org/10.1038/s41893-019-0437-5
- Jongman, B., Koks, E. E., Husby, T. G., & Ward, P. J. (2014). Increasing flood exposure in the Netherlands: Implications for risk financing. Natural Hazards and Earth System Sciences, 14(5), 1245–1255. https://doi.org/10.5194/nhess-14-1245-2014
- Koslov, L. (2016). The case for retreat. Public Culture, 28(2), 359–387. https://doi.org/10.1215/08992363-3427487
- Kousky, C., Lingle, B., & Shabman, L. (2016). NFIP premiums for single-family residential properties: Today and tomorrow (RFF Policy Brief 16–10). Resources for the Future. https://www.rff.org/publications/issue-briefs/nfip-premiums-for-single-family-residential-properties-today-and-tomorrow/
- Kraan, C. M., Hino, M., Niemann, J., Siders, A. R., & Mach, K. J. (2021). Promoting equity in retreat through voluntary property buyout programs. Journal of Environmental Studies and Sciences, 11(3), 481–492. https://doi.org/10.1007/s13412-021-00688-z
- Kunkel, K. E., Easterling, D. R., Ballinger, A., Bililign, S., Champion, S. M., Corbett, D. R., Dello, K. D., Dissen, J., Lackmann, G. M., Luettich, R. A., Perry, L. B., Robinson, W. A., Stevens, L. E., Stewart, B. C., Terando, A. J. (2020). North Carolina climate science report. https://ncics.org/nccsr
- Li, J., & Landry, C. E. (2018). Flood risk, local hazard mitigation, and the community rating system of NFIP. Land Economics, 94(2), 175–198. https://doi.org/10.3368/le.94.2.175
- Lyles, W., Berke, P., & Smith, G. (2014a). A comparison of local hazard mitigation plan quality in six states, USA. Landscape and Urban Planning, 122, 89–99. https://doi.org/10.1016/j.landurbplan.2013.11.010
- Lyles, L. W., Berke, P., & Smith, G. (2014b). Do planners matter? Examining factors driving incorporation of land use approaches into hazard mitigation plans. Journal of Environmental Planning and Management, 57(5), 792–811. https://doi.org/10.1080/09640568.2013.768973
- Mach, K. J., Kraan, C. M., Hino, M., Siders, A. R., Johnston, E. M., & Field, C. B. (2019). Managed retreat through voluntary buyouts of flood-prone properties. Science Advances, 5(10), 1–10. https://doi.org/10.1126/sciadv.aax8995
- NC Geographic Information Coordinating Council. (2020). NC OneMap. https://www.nconemap.gov/
- North Carolina Department of Public Safety. (2021, September 8). Major disaster declaration granted for seven western North Carolina counties recovering after tropical storm Fred. https://www.ncdps.gov/news/press-releases/2021/09/08/major-disaster-declaration-granted-seven-western-north-carolina
- North Carolina Floodplain Mapping Program. (2020). North Carolina flood risk information system. https://fris.nc.gov/fris/Home.aspx?ST=NC
- North Carolina Rural Center. (2015). About us. https://www.ncruralcenter.org/
- Norton, R. K. (2005). More and better local planning state mandated local planning in coastal North Carolina. Journal of the American Planning Association, 71(1), 55–71. https://doi.org/10.1080/01944360508976405
- NYC Planning. (n.d). East Shore neighborhoods. https://www1.nyc.gov/site/planning/plans/resilient-neighborhoods/east-shore-rezoning.page
- Olshansky, R. B., & Johnson, L. A. (2014). The evolution of the federal role in supporting community recovery after U.S. disasters. Journal of the American Planning Association, 80(4), 293–304. https://doi.org/10.1080/01944363.2014.967710
- Onda, K., Branham, J., BenDor, T. K., Kaza, N., & Salvesen, D. (2020). Does removal of federal subsidies discourage urban development? An evaluation of the US Coastal Barrier Resources Act. PLOS One, 15(6), e0233888–18. https://doi.org/10.1371/journal.pone.0233888
- Paerl, H. W., Hall, N. S., Hounshell, A. G., Luettich, R. A., Rossignol, K. L., Osburn, C. L., & Bales, J. (2019). Recent increase in catastrophic tropical cyclone flooding in coastal North Carolina, USA: Long-term observations suggest a regime shift. Scientific Reports, 9(1), 1–9. https://doi.org/10.1038/s41598-019-46928-9
- Patterson, L. A., & Doyle, M. W. (2009). Assessing effectiveness of national flood policy through spatiotemporal monitoring of socioeconomic exposure. Journal of the American Water Resources Association, 45(1), 237–252. https://doi.org/10.1111/j.1752-1688.2008.00275.x
- Peterson, K., Apadula, E., Salvesen, D., Hino, M., Kihslinger, R., & Bendor, T. K. (2020). A review of funding mechanisms for US floodplain buyouts. Sustainability, 12(23), 10112–10120. https://doi.org/10.3390/su122310112
- Shi, L., Chu, E., & Debats, J. (2015). Explaining progress in climate adaptation planning across 156 U.S. municipalities. Journal of the American Planning Association, 81(3), 191–202. https://doi.org/10.1080/01944363.2015.1074526
- Sun, F., & Carson, R. T. (2020). Coastal wetlands reduce property damage during tropical cyclones. Proceedings of the National Academy of Sciences of the United States of America, 117(11), 5719–5725. https://doi.org/10.1073/pnas.1915169117
- Sweet, W. V., Hamlington, B. D., Kopp, R. E., Weaver, C. P., Barnard, P. L., Bekaert, D., Brooks, W., Craghan, M., Dusek, G., Frederikse, T., Garner, G., Genz, A. S., Krasting, J. P., Larour, E., Marcy, D., Marra, J. J., Obeysekera, J., Osler, M., Pendleton, M., … Zuzak, C. (2022). Global and regional sea level rise scenarios for the United States: Updated mean projections and extreme water level probabilities along U.S. coastlines. https://oceanservice.noaa.gov/hazards/sealevelrise/noaa-nos-
- Tippett, R. (2021). First look at 2020 Census for North Carolina. Carolina Demography. https://www.ncdemography.org/2021/08/12/first-look-at-2020-census-for-north-carolina/
- Tonn, G. L., & Guikema, S. D. (2018). An agent-based model of evolving community flood risk. Risk Analysis, 38(6), 1258–1278. https://doi.org/10.1111/risa.12939
- U.S. Census Bureau. (2018a). TIGER/Line shapefiles. https://www.census.gov/geographies/mapping-files/time-series/geo/tiger-line-file.2018.html
- U.S. Census Bureau. (2018b). Urban and rural. https://www.census.gov/programs-surveys/geography/guidance/geo-areas/urban-rural.html
- U.S. Census Bureau (2022). P001, total population. data.census.gov
- U.S. Federal Emergency Management Agency (FEMA). (n.d). Community status book. https://www.fema.gov/flood-insurance/work-with-nfip/community-status-book
- U.S. Federal Emergency Management Agency (FEMA). (2010). Loss avoidance study: Eastern Missouri, building acquisition. https://www.fema.gov/es/case-study/loss-avoidance-study-eastern-missouri-building-acquisition
- U.S. Federal Emergency Management Agency (FEMA). (2013). Loss avoidance study. https://dps.mn.gov/divisions/hsem/hazard-mitigation/Documents/AustinLossAvoidanceStudy
- U.S. Federal Emergency Management Agency (FEMA). (2021). National flood insurance program: Risk rating 2.0 methodology and data sources. https://www.fema.gov/sites/default/files/documents/fema_risk-rating-2.0-methodology-data-sources_4-21.pdf
- U.S. Federal Emergency Management Agency (FEMA). (2022). OpenFEMA dataset: Disaster declarations summaries - v2. https://www.fema.gov/openfema-data-page/disaster-declarations-summaries-v2
- U.S. Geological Survey Gap Analysis Project. (2020). Protected areas database of the United States (PAD-US 2.0). https://doi.org/10.5066/P92QM3NT
- White, G. F. (1975). Flood hazard in the United States: A research assessment. Institute of Behavioral Science.
- Woodruff, S. C., & Stults, M. (2016). Numerous strategies but limited implementation guidance in US local adaptation plans. Nature Climate Change, 6(8), 796–802. https://doi.org/10.1038/nclimate3012
- Zahran, S., Brody, S. D., Highfield, W. E., & Vedlitz, A. (2010). Non-linear incentives, plan design, and flood mitigation: The case of the Federal Emergency Management Agency’s community rating system. Journal of Environmental Planning and Management, 53(2), 219–239. https://doi.org/10.1080/09640560903529410
- Zillow . (2020). Zillow’s transaction and assessment database (ZTRAX). https://www.zillow.com/research/ztrax/