
 ?Mathematical formulae have been encoded as MathML and are displayed in this HTML version using MathJax in order to improve their display. Uncheck the box to turn MathJax off. This feature requires Javascript. Click on a formula to zoom.
Abstract
This study proposes a three-staged approach to data envelopment analysis (DEA) modeling for hospital efficiency. The approach aims to overcome the constraint on the number of inputs/outputs relative to the number of DMUs. Initially, the principal components of all inputs and outputs are determined using principal component analysis (PCA). Next, these principal components enter a factor analysis (FA) process to construct a two-level hierarchy of inputs/outputs and to establish a weighting scheme based on explained variances of components. Finally, a two-level DEA (TLDEA) method is applied to the resultant framework to determine the relative efficiency of hospitals using data from the healthcare context of Iran as an emerging economy. The outcomes of applying the proposed PCA-FA-TLDEA approach are argued to offer a substantial increase in the discriminatory power of classical DEA methods and could incorporate a relatively large set of inputs/outputs already existing in the hospital efficiency literature. As demonstrated in the evaluated hospitals, the PCA-FA-TLDEA methodology improved the discrimination from 0% in the original DEA to 45%. The paper proposes a novel three-stage DEA model by using PCA to extract the principal components from the inputs and outputs; therefore, reducing the number of inputs and outputs and their inter-correlations. Secondly, a hierarchy of inputs and outputs by applying FA to the principal components is constructed. Finally, the TLDEA method to the hierarchy of inputs and outputs is applied to evaluate the performance of public hospitals.
Introduction
To ensure the welfare of its people, every society requires a health care system that provides standard services, offers effective performance, and shares common concerns with its shareholders’ benefits (Kohl et al. Citation2019). Hospitals, clinics, and other health care institutions as members of health care systems are often dealing with limited supplies of pharmaceutical and non-pharmaceutical resources. The Covid-19 pandemic has also highlighted the resource shortage remarkably and affected the healthcare system performance (Mirmozaffari et al. Citation2022a). Besides, healthcare systems have been required to reduce the level of expenditures and, at the same time, improve both the appropriateness and quality of services (Fragkiadakis et al. Citation2016; Kohl et al. Citation2019). Thus, health care systems in general and hospitals, in particular, are required to meticulously monitor their performance to detect sources of inefficiencies and eliminate them to save resources and ascertain that quality services are offered to their customers (Erickson et al. Citation2020).
To date, several parametric and nonparametric models such as stochastic frontier analysis (SFA), data envelopment analysis (DEA), and their combinations have been developed to measure hospital efficiency (Omrani, Shafaat, and Emrouznejad Citation2018; Omrani et al. Citation2022). The DEA method only requires information regarding the inputs and outputs’ quantities (Mirmozaffari et al. Citation2022b). Nevertheless, the issue of insufficient discrimination power is omnipresent and mostly overlooked among those studies that use DEA. The problem of discriminatory power deals with the fact that when the dimension of DMUs exceeds the number of inputs and outputs, nearly most of the DMUs are rated as efficient. Therefore, the lack of discrimination is referred to as the “curse of dimensionality” (Charles, Aparicio, and Zhu Citation2019). Different methods have been proposed to deal with the cures of dimensionality to improve the discrimination power. While some solutions have been proposed in a general sense to eliminate this limitation (Adler and Yazhemsky Citation2010; Omrani, Shafaat, and Emrouznejad Citation2018), the enhanced DEA models are not yet capable of solving real-world problems with relatively large numbers of inputs and outputs compared to the total number of decision-making units (DMUs) (Marins et al. Citation2020; Wang Citation2020). Furthermore, few relevant studies have focused on the healthcare systems of developing nations, particularly Iran (Bahrami et al. Citation2018; Rezaee et al. Citation2020; Zare et al. Citation2019). These studies have considered a limited number of inputs and outputs in their proposed models that could hardly capture the various aspects of hospital performance (Ferreira and Marques Citation2021).
To address this gap and limitation in the academic literature, the present paper proposes a novel three-stage data envelopment analysis approach for assessing the performance of hospitals. The proposed approach is comprised of the following phases: (i) using principal component analysis (PCA) to extract the principal components from the inputs and outputs, hence reducing the number of inputs and outputs and their inter-correlations, (ii) constructing a hierarchy of inputs and outputs by applying factor analysis (FA) to the principal components, and (iii) applying the two-level DEA (TLDEA) method to the hierarchy of inputs and outputs to evaluate the performance of DMUs. Accordingly, the numerical results are compared to the results obtained from common and discriminatory-enhanced DEA models to show the capabilities of the proposed model. The proposed three staged data envelopment analysis approach can be employed by healthcare providers, and in particular, hospitals, to measure and identify efficiency improvement opportunities when using their resources to deliver the expected services. Since public hospitals consume government resources, evaluating public hospitals’ efficiency can be used as an approach to allocating such resources more purposefully. Also, results can be considered as a benchmarking baseline for efficient hospitals by non-efficient units as target setting.
The remainder of the paper is organized as follows. Section 2 provides a review of the literature on the selective DEA models applied heretofore to compare hospital efficiencies. This section also presents an overview of the structure of the health care system and hospitals in Iran as the case study of this research. Section 3 explains the common measures in the literature as inputs and outputs to evaluate hospital efficiency. Section 4 presents the proposed PCA-FA-TLDEA approach and adopts the resultant model to the data obtained from 11 public hospitals in Iran. Further analysis is also presented to identify the roots of inefficiency in hospitals. The efficiency decomposition includes finding the roots of inefficiency as managerial, technical, or mixed inefficiency. Eventually, the study concludes by enumerating the main findings of the research and avenues for future attempts to apply and extend the proposed model.
Hospital Efficiency Evaluation Measures
Numerous studies have been conducted heretofore aiming at improving the procedure of hospitals’ efficiency comparison using DEA in diverse contextual environments. However, the outcomes of most of these studies have identified a relatively large number of efficient DMUs, which might raise some concerns about the discriminatory power of DEA models used in them. Recent attempts to assess hospital efficiency include Bilsel and Davutyan (Citation2014) compared the operational performance of 202 rural hospitals in Turkey using DEA with the ‘risk of mortality as an undesirable output. In another attempt, the DEA model proposed by Bilsel and Davutyan (Citation2014) using constant and variable returns to scale and a set of six inputs and four outputs revealed roughly 90% of DMUs efficiency. Using an additive super-efficiency DEA model, Du et al. (Citation2014) measured the efficiency of 119 general acute care hospitals in Pennsylvania/USA using a set of seven inputs and outputs. The total number of efficient DMUs using their model was limited to 31 hospitals. Since 2015, various developments in DEA models and their application in hospital performance measurement have been evolved. A group of researchers combined game theory and DEA to consider the competition between hospitals (e.g. Yeşilyurt et al. Citation2021; Zare et al. Citation2019). Other researchers considered network and dynamic approaches in DEA models to evaluate hospital performance (e.g. Khushalani and Ozcan Citation2017; Kočišová and Sopko Citation2020; Pereira et al. Citation2021). Nonetheless, none of these enhanced DEA models are capable of solving real-world problems with relatively large numbers of inputs and outputs compared to the total number of decision-making units (DMUs). There is also an abundant number of similar researches (e.g., Bahari and Emrouznejad Citation2014; Cheng and Zervopoulos Citation2014; Fragkiadakis et al. Citation2016; Hu, Li, and Tung Citation2017; Kočišová and Sopko Citation2020; Razavi Hajiagha, Hashemi, and Amoozad Mahdiraji Citation2014; Hajiagha et al. Citation2018, Hajiagha, Mahdiraji, and Tavana Citation2019), which also overlook the criticality of improving the discrimination power of DEA models. There have been, however, several attempts using various statistical and operations research-related techniques to enhance the discrimination power of DEA models in general (e.g., Adler and Yazhemsky Citation2010; Hajiagha et al. Citation2018, Hajiagha, Mahdiraji, and Tavana Citation2019), where some have particularly focused on healthcare systems (Zare et al. Citation2019, Kohl et al. Citation2019). However, we later argue that even these models could not fully capture all the necessary criteria to measure limited numbers of hospitals compared to inputs and outputs.
In Iran, healthcare institutions are divided into public and private. Among these sectors, hospitals are the primary consumers of healthcare funds. Unlike private hospitals, Iranian public hospitals are not allowed to charge patients with fee rates higher than those approved by the government. On the other end, healthcare expenditures in Iran have been rising rapidly in the past few years (Davari, Haycox, and Walley Citation2012). This has made expenditures and efficient budget assignments critical aspects of managing public hospitals. Moreover, considering the 8.65% share of health expenditures from Iran GDP in 2017, according to the Global Health Expenditure Database, and the rapid growth in healthcare expenditure for the past few years provide sufficient evidence that the measurement and improvement of efficiency in Iranian public hospitals have become an overriding priority (Khosravi et al. Citation2020). While there have been studies that considered the context of developing countries and the efficiency measurement of healthcare systems, a limited number of these studies have focused on Iran’s healthcare system (Bahrami et al. Citation2018, Zare et al. Citation2019, Bastani et al. Citation2020). Additionally, all of these studies have considered a limited number of inputs and outputs which restrict their ability to capture the various aspects of hospital performance.
Comparing efficiency levels of hospitals could be justified following the social welfare point of view and Stakeholder Theory. From a social welfare point of view, hospitals must provide quality medical services at a reasonable cost for improving health in society (Cinaroglu Citation2021; Plaza-Úbeda, de Burgos-Jiménez, and Carmona-Moreno Citation2010). Furthermore, according to the Stakeholder Theory, in addition to increasing the wealth of their shareholders, hospitals should also be concerned about the well-being of their customers and all other stakeholders involved. This could, in turn, help hospitals to maintain and/or improve their image and their competitive advantage (Harrison et al. Citation2019). Thus, hospitals should retain their costs and the quality of their services at a reasonable level to ensure financial stability and performance sustainability. Various measures could be considered as inputs or outputs of hospital performance according to these two vantage points. provides a summary of some selective studies that have proposed several inputs and outputs for hospital efficiency measurement. These measures, inputs, and outputs have been investigated and confirmed by various authors (e.g. Alatawi et al. Citation2019; Kohl et al. Citation2019; Yousefi, Saen, and Hosseininia Citation2019) through their systematic literature review-based research.
Table 1. Hospital efficiency evaluation measures.
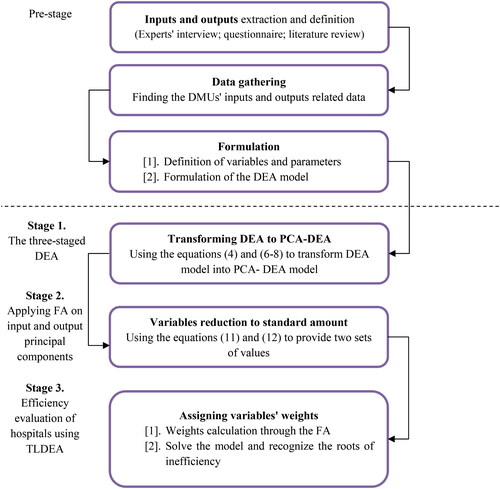
The set of inputs and outputs presented in are extracted by the literature review. Additionally, Boussofiane, Dyson, and Thanassoulis (Citation1991) argued that receiving a good discriminatory power out of the CCR and BCC models requires the lower bound on the number of DMUs to be equal or larger than the multiple of the numbers of inputs and outputs (i.e. in this case 160 DMUs). Bowlin (Citation1998) asserted the number of DMUs to be three times the number of input and output variables. However, the number of inputs and outputs is often different from this assumption. To overcome this issue, the three-stage DEA model is designed and implemented in this paper. Different methods have been proposed for variable selection and reduction in the context of DEA. Nataraja and Johnson (Citation2011) reviewed different methods of variable reduction, including the efficiency contribution measure (ECM), principal component analysis (PCA-DEA), a regression-based test (RB), and bootstrapping. They compared these methods using Monte Carlo simulation. As a result, their study indicated that the PCA-DEA method, which is used in this study, performed well with a small sample size and low run time, while bootstrapping-based techniques required a heavy computational effort and still resulted in poor performance. They proposed using the PCA-DEA approach for a smaller sample size (suitable for this research according to the number of decision-making units) while ECM and RB were proposed for larger sample sizes. Hence, the PCA-DEA-based method was considered the best alternative to conduct the current study. The stages of the proposed method are illustrated in .
Figure 1. The methodology flowchart.
The Three-Staged Data Envelopment Analysis
DEA is a non-parametric performance evaluation tool that measures the relative efficiency of a set of n DMUs that use a set of m inputs to produce a set of s outputs (Charnes, Cooper, and Rhodes Citation1978). Generally, the efficiency of a DMU in the presence of multiple inputs and outputs is defined as the ratio of its weighted sum of outputs to the weighted sum of inputs. Considering DMU j, with an input vector of
and output vector of
the CCR model for DMU0 can be formulated as follows (Hajiagha et al. Citation2013, Citation2015; Moncayo–Martínez, Ramírez–Nafarrate, and Hernández–Balderrama Citation2020). Model (1) is transformed into an equivalent linear programming formulation. A comprehensive review of DEA foundations and their models can be found in Cooper et al. (Citation2007) and other recent literature review articles (e.g. Contreras Citation2020; Mardani et al. Citation2017)
(1)
(1)
As discussed earlier, the main concern in the context of hospital efficiency is that the numbers of inputs or outputs exceed the limits of the mentioned bounds; therefore, the discrimination power of DEA is substantially reduced (Limleamthong and Guillén-Gosálbez Citation2018). This would put a curb on the inclusion of some indicators and culminates in a dramatic change in the numerical outcomes (See, Hamzah, and Yu Citation2021). Various attempts have been made to eliminate this problem (Adler and Yazhemsky Citation2010; da Silva, Marins, and Dias Citation2020; Ebrahimnejad and Ziari Citation2019). Other statistical methods including a variable reduction (VR), built upon partial covariance, have been identified to be less pragmatic than PCA to this end (Adler and Yazhemsky Citation2010). Furthermore, the common set of weights, target settings, uncertain approaches, and bi-level and multi-level DEA have been developed and implemented in real-world cases (Hajiagha et al. Citation2015, Citation2018, Hajiagha, Mahdiraji, and Tavana Citation2019; İlgün et al. Citation2021). There are some cases in which discriminatory improved DEA methods do not apply to problems with numerous outputs and inputs; in this scenario, using a different technique is advised. A guide to the notations used in the following formulas is provided in .
Table 2. Notations used in model formulation.
Stage 1. Applying PCA on Hospital Inputs and Outputs
Adler and Yazhemsky (Citation2010) transformed the initial output-oriented BCC formulation into the PCA-DEA form as follows.
(2)
(2)
(3)
(3)
(4)
(4)
(5)
(5)
(6)
(6)
(7)
(7)
(8)
(8)
(9)
(9)
(10)
(10)
Equations (Equation2-10) divide each set of inputs or outputs into two main categories of inputs with original values inputs transformed by PCA
outputs with original values
and outputs transformed by PCA
respectively.
and
represent groups of correlated inputs and outputs. Hence, equations (Equation2-10) constitute a typical output-oriented BCC formulation, except for the presence of PCs illustrated in Equationequations (4)
(4)
(4) and Equation(6-8). Accordingly, the values for
and
are transformed through the input
and output
matrices of coefficients. This leads to a systematic reduction in the total number of inputs and outputs and thus to an improvement in the discriminatory power of PCA-DEA.
As the first step of the proposed methodology and to reduce the number of inputs and outputs, in this section a PCA analysis is carried out on inputs and outputs presented in . Using this method, the original observations X are imaged in (Härdle and Simar Citation2012).
Stage 2. Applying FA on Input and Output Principal Components
By implementing the PCA method, the number of evaluation criteria was reduced; however, this attempt was not sufficient since the total number still exceeded the standard amount (as discussed previously). Consequently, the hybrid FA-TLDEA was applied to the PCA-DEA to overcome this issue. According to the results of PCA (see and for the studied case), there were two sets of values for running a factor analysis. The first set was to input principal components (PCIs), assuming that K principal components were extracted, taken from transforming the original inputs to principal components as follows:
(11)
(11)
Table 4. Average data for one period.
Table 5. PCA on input measures.
Where is the kth input principal component of DMU j,
is the coefficient of ith original input in kth principal component (), and
is the value of ith input in jth DMU. These transformations are carried out similarly for outputs, assuming P principal components are extracted on outputs, applying coefficient values.
(12)
(12)
In EquationEq. (12)(12)
(12) ,
is the pth output principal component of DMU j,
is the coefficient of rth original output in pth principal component (), and
is the value of rth output in jth DMU. The coefficients of
and
are obtained by applying PCA on original data. These weights were used to transform original data into principal components. This is the first step for reducing DMUs dimensions regarding inputs and outputs. These weights were extracted using the IBM-SPSS 28.0 package. After extracting the values for
and
they have been inserted in the FA to categorize m inputs and s outputs to form a hierarchical structure. It is worth noting here that if any negative value in the vector of the PCs exists, all values should be increased by the most negative value plus one (Adler and Yazhemsky Citation2010). Thus, the use of negative values in FA would be eliminated.
Stage 3. Efficiency Evaluation of Hospitals Using TLDEA
The main advantage behind TLDEA (Chen et al. Citation2017) is that it classifies and sorts inputs and outputs and assigns weights to the groups at lower levels. Thus, using this technique, equations (Equation2-10) are transformed into equations (Equation13-21) as follows:
(13)
(13)
(14)
(14)
(15)
(15)
(16)
(16)
(17)
(17)
(18)
(18)
(19)
(19)
(20)
(20)
(21)
(21)
These two sets of equations are differentiated by the pre-assigned weights to inputs and outputs that are illustrated in equations (Equation14-17) as matrices of weights ( and
). To formulate a TLDEA model, it was assumed that inputs and outputs were categorized in a hierarchical structure and some weights were assigned to these groups. According to Eqs. (Equation14-17), inputs were classified as (i) their original form, i.e.
and (ii) by methods like PCA, i.e.
A similar categorization was applied for the outputs. These weights are calculated through the analytical hierarchy process (AHP) (Meng et al. Citation2008). However, there have been debates that have proved that AHP suffers from some limitations to accurately extracting the hierarchical weights (Ramanathan and Ramanathan Citation2010). To overcome this limitation, the authors initially applied the values for
and
in FA to categorize the larger groups of criteria to construct a hierarchical structure. To this aim, an exploratory factor analysis (EFA) was applied to the over-extracted input and output principal components. Using PCA, the original inputs and outputs were transformed into principal components. Then, to formulate a TLDEA, a categorization of the extracted principal components was required, i.e., PCIs and PCOs. Therefore, EFA was employed to identify the underlying and unknown common factors behind the PCIs and PCOs and to extract the hierarchy of these principal components (Fabrigar and Wegener Citation2012; Watkins Citation2021). The EFA results revealed the categorization of PCIs and PCOs in a hierarchy and the weights associated with these categories. The EFA was applied also by using the IBM-SPSS 28.0 package.
Beyond appraising the efficiency of hospitals using the PCA-FA-TLDEA method, a valuable outcome of DEA evaluations is to recognize the roots of inefficiency. Cooper et al. (Citation2007) introduced the following decomposition of technical efficiency.
(22)
(22)
While TE stands for technical efficiency obtained from the CCR model, PTE illustrates the pure technical efficiency from the BCC model which presents the managerial efficiency of DMU, and SE is defined as scale efficiency which demonstrates the inefficiency resulting from the environment and is defined as the ratio of CCR efficiency to BCC efficiency.
A further decomposition will be obtained using a slack-based measure (SBM) efficiency (Cooper et al. Citation2007). In this case, MIX efficiency is defined as the ratio of SBM efficiency to CCR efficiency.
(23)
(23)
The MIX efficiency illustrates the decomposition of the non-radial efficiency into radial and mixes efficiencies as follows.
(24)
(24)
Case Study
In Section 3, a hybrid three-stage approach consisting of PCA-FA-TLDEA was developed. In this section, the results are discussed. As previously mentioned, the developed approach was implemented in eleven public hospitals in Iran. The results emanated from each stage are illustrated in the following sections. The set of inputs and outputs presented in was used to compare the efficiency levels of 11 public hospitals in Tehran province (see ).
Table 3. inputs and outputs of hospital efficiency measurement.
The identified criteria in the literature review were considered as input and output to measure selected hospitals’ efficiency. According to the numerous outputs and inputs, this case study does not comply with the aforementioned limitations on the number of DMUs. Furthermore, discriminatory improved DEA methods were not applicable for this research with the total number of 26 inputs/outputs and only 11 public hospitals. Therefore, a significantly improved DEA in terms of discrimination power using PCA, factor analysis (FA), and two-level DEA (TLDEA) was developed to enhance the accuracy of the DEA model to distinct efficient and inefficient DMUs (i.e. hospitals).
Given the total number of inputs and outputs (i.e. 26), the rule of thumb proposed by Golany and Roll (Citation1989) for applying classical DEA models to solve this problem requires at least twice this amount (i.e. 52) DMUs for the DEA model to yield a reasonable outcome. The archival data for this study (see ) was collected by accessing databases of hospitals either directly onsite or indirectly through the official websites affiliated with the relevant Iranian health authorities. These data show the average daily performance of the 11 public hospitals.
Stage 1. (PCA-DEA)
The PCA analysis was performed separately for inputs and outputs using MINITAB 19.0 software. The PCA analysis of inputs revealed the principal components of inputs. Since the scales of inputs were different, the correlation matrix was used to compute the principal components. To select the number of principal components, the Scree plot of inputs was used as shown in . According to , six components that explain roughly 93% of data variances of input measures were chosen.
Figure 2. Scree plot of inputs.
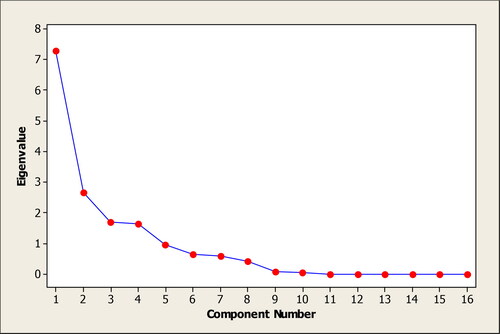
Moreover, illustrates PCA coefficients for six selected components.
Since PCA extracts the linear combination of inputs and outputs separately, each output and input had a coefficient in these combinations that indicated the element was close to which principal component. According to , comparisons of coefficients for each of the inputs on the principal components helped to categorize the most similar inputs under a specific principal component. For instance, I1, I2, I3, I4, I6, I12, I13, and I16 in show a relatively higher value of coefficients on PCI1 compared to other principal components; meaning that the number of beds, doctors, nurses, administrative staff, buildings, food-rations, total assets, and hospital area has more relevance to PCI1, renamed in as ‘Necessities’. Similarly, the number of support services (I8) and drugs (I11) were categorized under PCI2, entitled ‘Complementary services’. PCI3 mainly considers medical services (I9) and this component can be treated as ‘Main services’ of hospitals. Coefficients related to the number of technical employees (I10) and inpatients who died during hospitalization (I14) were more remarkable in PCI4, renamed as ‘Undesirables’. Finally, expenses (I5) and the number of ancillary services (I7) were grouped in PCI5, entitled as ‘Besides’ and the number of laboratory technicians (I15) was categorized within PCI6, identified here as ‘Accessories’. Bold numbers in columns of PCIs in are related to the inputs that were categorized under the specific principal component. The proportion row in represents the contribution of each principal component in describing the total variance of the data. Similarly, using PCA on outputs data, 5 components were identified which described 92% of variances of data. The five selected principal component coefficients of outputs are illustrated in .
Table 6. PCA on output measures.
Similarly, admissions, deliveries, the number of inpatients, and discharged patients were the most important outputs in PCO1. This component was the “Main results” expected from a hospital. Total revenue was the main purpose of PCO2; thus, this component was named “Revenue”. On this account, the length of stay and number of outpatients were more effective in PCO3, a component which showed the “Treatment process”, and the number of surgeries can define the issue of PCO4 that represents the “Risky events”. In the end, "the number of emergency operations" and "conclusion cases" were the most important criteria in PCO5 that indicated the “Additional services” in hospitals. The last rows in both and , titled as proportion, illustrate the contribution of each principal component in explaining the total variance of data.
Stage 2. (FA)
By implementing the PCA-DEA approach, the number of inputs and outputs (i.e. evaluation criteria for hospitals) was reduced from 26 to 11 (as explored in the previous section). After extracting the values for and
they were inserted in the FA to categorize 6 inputs and 5 outputs to form a hierarchical structure.
However, this attempt was not sufficient since the total number still exceeded the standard amount (as discussed previously). Thus, the FA-TLDEA combination was scheduled to solve this problem. denotes the results of FA on and
values.
According to the above tables, 7 input components were organized into two factors, while 5 output components were organized into three factors. On the input side, three components of “complementary services, main services and besides”, constructed the factor of services. While the second factor, including “necessities, undesirables, and accessories”, showed the infrastructural aspects of a hospital. On the other hand, outputs were composed of three factors. The first output factor was the main results consisting of the same components, while the second factor of “revenue” similarly included a unique component of the same name. The last output factor of medical treatments included the “treatment process, risky and additional services”.
Stage 3 (FA-TLDEA)
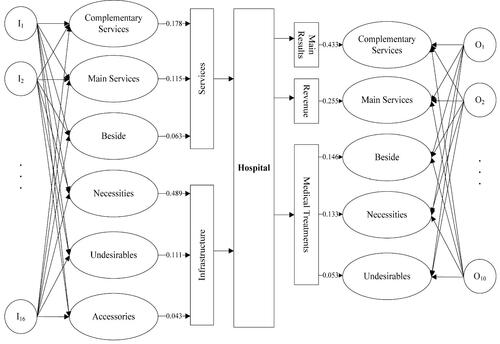
illustrates the hierarchy of inputs and outputs in the corresponding hospital efficiency evaluation case. To complete this hierarchy, a set of weights must be assigned to components corresponding to each factor. In this paper, these weights were extracted from the contribution of each component in describing the total variability of data. The proportion of each component in (inputs) and (outputs) was normalized by dividing them by the total sum of proportions. These weights are shown in above the connecting arrows of components and their associated factors.
Figure 3. Inputs and outputs hierarchy in hospitals efficiency evaluation.
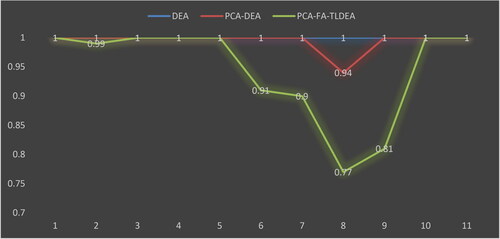
illustrates the efficiency scores of hospitals using the output-oriented BCC model. These analyses were performed over three sets of data. The DEA line shows the results of running DEA over the original data in . The PCA-DEA graph presents the results of running DEA over PCA data of and by replacing negative principal components. Finally, the PCA-FA-TLDEA figure presents the results of efficiency evaluations on constructed factors by assigned weights in . By comparing the obtained efficiency scores of three different methodologies, it is clear that the original DEA method does not determine any discrimination between hospitals. However, the status improves a little in PCA-DEA by determining the 8th hospital as an inefficient unit. However, the PCA-FA-TLDEA methodology determines 5 hospitals as inefficient in the output-oriented BCC model. Considering the results of , the improvement of the discriminatory power of DEA in the applied PCA-FA-TLDEA methodology is apparent.
Figure 4. Efficiency evaluation of hospitals comparison of centers.
Considering the different decompositions discussed in Section 3, a decomposition of the inefficiency roots of hospitals is illustrated in .
Figure 5. Decomposition of technical efficiency.
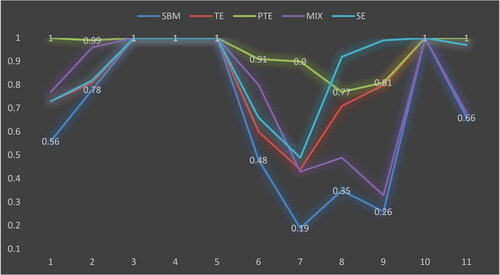
According to , the following conclusions are considerable.
Hospitals 3, 4, 5, and 10 were determined as strongly efficient hospitals.
While hospitals 1 and 11 were pure technical efficient units, they had the scale and mix inefficiencies. Even though these units' managerial performances were efficient, their environment and resource mix performed inefficiently.
Other hospitals incurred all types of pure, mix, and scale inefficiencies. These units must improve their managerial procedures and resource usage.
Practical Implications
One of the main challenges of public institutions, e.g. public hospitals, is to effectively and efficiently manage their allocated resources in a way in which they can provide more and better services. This paper proposes an approach to address this challenge by proposing a hybrid multi-stage method based on data envelopment analysis. From the conducted implementation of the method to evaluate the efficiency of 11 hospitals in Iran, several practical implications can be considered. One of the main managerial findings of the current study refers to the elaboration of the problem of identifying evaluation criteria. While data envelopment analysis, as a non-parametric efficiency evaluation method, is considered as a less sensitive method, its dependency on evaluation criteria, i.e. inputs and outputs, can affect the results of the evaluation (Aibing et al. Citation2015). An unsuitable measure list can dramatically reduce the applications of the efficiency evaluation for managerial applications due to contradictions with reality ().
Table 7. Rotated component matrix for s and
s.
The proposed method can be used by policymakers and resource owners to make better decisions regarding the allocation of hospital resources and justification of such decisions. For example, considering , the obtained efficiency scores of hospitals can be used as a measure to determine the number of resources allocated to them. For hospitals with efficiency scores of less than 1, it may suggest that their resources can be reduced by a proportionate magnitude according to their efficiency. Implying the usual inflation rate to increase the cost of inputs, the efficiency measures derived from the proposed approach can be used to determine the number of allocated resources. For instance, considering an inflation rate and an obtained efficiency score
for a given time period t, the amount of monetary budget allocated to the considered hospital at the next time period
i.e.
can be adjusted as
to compensate for the effects of inflation and simultaneously consider the hospital’s efficiency in the allocated resources.
Another guiding fact from the results that can be considered by managers is the decomposition of efficiency scores to their constructing elements. One of the appealing results that can be inferred regarding the obtained results is to use them as an illustration of hospital managerial performance. According to the results, pure technical efficiency (PTE) can be considered as the contribution of managerial procedures inefficiency of hospitals. First of all, it seems that hospital internal management practices performed well since the lowest PTE was 77% while 9 out of 11 hospitals reached a PTE of more than 90%. However, it seems hospitals 8 and 9 are required to improve their internal management practices using benchmarking or enabling the internal managerial practices using mentoring or coaching. The effectiveness of these enabling approaches can be assessed using a similar method after a given period.
On the other hand, it seems that the scale efficiency of hospitals, meaning the effect of their scale and environment, is required to be improved. A scale efficiency of 49% in the 7th hospitals means a required decision to change its location or enhance its performance scale by investing in its facilities, types of equipment, etc. A similar proposition can be made about other hospitals with low-scale efficiency.
Conclusions
Data envelopment analysis is a well-developed and widely accepted method in appraising the efficiency of a set of homogeneous units. This method has been applied in various areas like banking, insurance, educational systems, etc. One of its application fields is evaluating the efficiency of health systems, especially in hospitals. The importance of healthcare and the necessity of proper resource usage in this sector has made efficiency a vital parameter of good healthcare management. In this paper, a three-stage PCA-FA-TLDEA methodology was proposed and applied in a set of public hospitals in Iran.
Theoretically, the motivation for adopting this methodology was to improve the discrimination power of the original DEA method. While the numbers of inputs and outputs increase in classic DEA methods, more and more decision-making units are classified as efficient which will decrease the discrimination between evaluated units. To overcome this shortcoming of the original DEA, a combination of statistical methods of principal component analysis and factor analysis was applied in the context of two-level DEA. first, the original inputs and outputs were combined to form a set of principal components that explain a wide portion of data variation. Afterward, the constituted principal components were applied in a factor analysis to construct a hierarchy of principal components, according to the two-level DEA methodology. Eventually, the constructed hierarchy was used to form a set of weighted factors. These factors were then used in DEA models to appraise the efficiency of hospitals. The main novelty of the proposed method can be considered its ability to handle real-world problems where decision-makers prefer to appraise a set of units with a wide set of measures while classic DEA models are not capable of discriminating in these situations.
As demonstrated in the evaluated hospitals, the PCA-FA-TLDEA methodology improved the discrimination from 0% in the original DEA to 45%. Also, a further analysis was performed to identify the sources of inefficiencies. This study illustrated that only 4 of 11 hospitals had performed efficiently while other hospitals were incurred from at least one type of purely technical, mix, or scale inefficiencies. The proposed approach can be used in the case when the number of DMUs is small compared to the number of inputs and outputs.
One of the main limitations of this research is that the efficiency of public hospitals has been investigated at a specific point time. Thus, this approach has not considered dynamic and multi-period analysis. As a clue for future studies, researchers can focus on developing the proposed method in dynamic and multi-period environments where some measures might be eliminated or added in different periods (e.g. Mozaffari et al. Citation2021). Moreover, the relationship of healthcare processes has not been considered in this research. Hence, the situation studied in this paper and the proposed structure can be extended to network structures (e.g. Yazdi et al. Citation2018). Application of machine learning feature selection methods to reduce the dimensionality of inputs and outputs in big data environments can also be considered in future research.
References
- Aibing, J., Hui, L., Hong-Jie, Q. and Haobo, L., (2015). Data envelopment analysis with interactive variables. Management Decision 53 (10): 2390–2406.
- Adler, N, and E. Yazhemsky. 2010. Improving discrimination in data envelopment analysis: PCA–DEA or variable reduction. European Journal of Operational Research 202 (1):273–84. doi:10.1016/j.ejor.2009.03.050.
- Akkan, C., M. A. Karadayi, Y. Ekinci, F. Ülengin, N. Uray, and E. Karaosmanoğlu. 2020. Efficiency analysis of emergency departments in metropolitan areas. Socio-Economic Planning Sciences 69:100679. doi:10.1016/j.seps.2019.01.001.
- Alatawi, A., S. Ahmed, L. Niessen, and J. Khan. 2019. Systematic review and meta-analysis of public hospital efficiency studies in Gulf region and selected countries in similar settings. Cost Effectiveness and Resource Allocation 17 (1):17. doi:10.1186/s12962-019-0185-4.
- Alinejhad, M., S. Aghlmand, S. Feizollahzadeh, and H. Yusefzadeh. 2020. The economic efficiency of clinical laboratories in public hospitals: A case study in Iran. Journal of Clinical Laboratory Analysis 34 (2):e23067. doi:10.1002/jcla.23067.
- Alidina, S., S. Kuchukhidze, G. Menon, I. Citron, T. Lama, J. Meara, D. Barash, A. Hellar, N. Kapologwe, E. Maina, et al. 2019. Effectiveness of a multicomponent safe surgery intervention on improving surgical quality in Tanzania's Lake Zone: Protocol for a quasi-experimental study. BMJ Open 9 (10):e031800. doi:10.1136/bmjopen-2019-031800.
- Bahari, A. R, and A. Emrouznejad. 2014. Influential DMUs and outlier detection in data envelopment analysis with an application to health care. Annals of Operations Research 223 (1):95–108. doi:10.1007/s10479-014-1604-8.
- Bahrami, M. A., S. Rafiei, M. Abedi, and R. Askari. 2018. Data envelopment analysis for estimating efficiency of intensive care units: A case study in Iran. International Journal of Health Care Quality Assurance 31 (4):276–82. doi:10.1108/IJHCQA-12-2016-0181.
- Bastani, M., S. Ketabi, R. Maddahi, and R. M Ahari. 2020. Efficient resource allocation to social security organization hospitals in Iran by using centralized data envelopment analysis. Journal of Health Management and Informatics 7 (1):59–67.
- Bilsel, M, and N. Davutyan. 2014. Hospital efficiency with risk adjusted mortality as undesirable output: The Turkish case. Annals of Operations Research 221 (1):73–88. doi:10.1007/s10479-011-0951-y.
- Boussofiane, A., R. G. Dyson, and E. Thanassoulis. 1991. Applied data envelopment analysis. European Journal of Operational Research 52 (1):1–15. doi:10.1016/0377-2217(91)90331-O.
- Bowlin, W. F. 1998. Measuring performance: An introduction to data envelopment analysis (DEA). The Journal of Cost Analysis 15 (2):3–27. doi:10.1080/08823871.1998.10462318.
- Bulakh, I. V. 2019. Common features of architectural design of the medical purpose building.
- Card, D., A. Fenizia, and D. Silver. 2019. The health impacts of hospital delivery practices (No. w25986). Cambridge, MA: National Bureau of Economic Research.
- Charles, V., J. Aparicio, and J. Zhu. 2019. The curse of dimensionality of decision-making units: A simple approach to increase the discriminatory power of data envelopment analysis. European Journal of Operational Research 279 (3):929–40. doi:10.1016/j.ejor.2019.06.025.
- Charnes, A., W. W. Cooper, and E. Rhodes. 1978. Measuring the efficiency of decision making units. European Journal of Operational Research 2 (6):429–44. doi:10.1016/0377-2217(78)90138-8.
- Chen, F. H. J. H. Zeng, M. F. Hsu, and S. J. Lin. 2017. Management decision by combination two-level DEA and kernel-based mechanism. In 2017 Joint 17th World Congress of International Fuzzy Systems Association and 9th International Conference on Soft Computing and Intelligent Systems (IFSA-SCIS), 1–5. IEEE, June. doi:10.1109/IFSA-SCIS.2017.8023333.
- Cheng, G, and P. D. Zervopoulos. 2014. Estimating the technical efficiency of health care systems: A cross-country comparison using the directional distance function. European Journal of Operational Research 238 (3):899–910. doi:10.1016/j.ejor.2014.05.007.
- Cinaroglu, S. 2021. Changes in hospital efficiency and size: An integrated propensity score matching with data envelopment analysis. Socio-Economic Planning Sciences 76:100960.
- Contreras, I. 2020. A review of the literature on DEA models under common set of weights. Journal of Modelling in Management 15 (4):1277–300. doi:10.1108/JM2-02-2019-0043.
- Cooper, W. W., L. M. Seiford, K. Tone, and J. Zhu. 2007. Some models and measures for evaluating performances with DEA: Past accomplishments and future prospects. Journal of Productivity Analysis 28 (3):151–63. doi:10.1007/s11123-007-0056-4.
- da Silva, A. F., F. A. S. Marins, and E. X. Dias. 2020. Improving the discrimination power with a new multi-criteria data envelopment model. Annals of Operations Research 287 (1):127–59. doi:10.1007/s10479-019-03446-1.
- Davari, M., A. Haycox, and T. Walley. 2012. The Iranian health insurance system; past experiences, present challenges and future strategies. Iranian Journal of Public Health 41 (9):1.
- Du, J., J. Wang, Y. Chen, S. Y. Chou, and J. Zhu. 2014. Incorporating health outcomes in Pennsylvania hospital efficiency: An additive super-efficiency DEA approach. Annals of Operations Research 221 (1):161–72. doi:10.1007/s10479-011-0838-y.
- Fabrigar, L. R, and D. T. Wegener. 2012. Exploratory factor analysis. Oxford, UK: Oxford University Press.
- Fishbein, D., S. Nambiar, K. McKenzie, M. Mayorga, K. Miller, K. Tran, L. Schubel, J. Agor, T. Kim, and M. Capan. 2019. Objective measures of workload in healthcare: A narrative review. International Journal of Health Care Quality Assurance 33 (1):1–17. doi:10.1108/IJHCQA-12-2018-0288.
- Fragkiadakis, G., M. Doumpos, C. Zopounidis, and C. Germain. 2016. Operational and economic efficiency analysis of public hospitals in Greece. Annals of Operations Research 247 (2):787–806.
- Ferreira, D. C, and R. C. Marques. 2021. Public-private partnerships in health care services: Do they outperform public hospitals regarding quality and access? Evidence from Portugal. Socio-Economic Planning Sciences 73:100798. doi:10.1016/j.seps.2020.100798.
- Ebrahimnejad, A, and S. Ziari. 2019. New model for improving discrimination power in DEA based on dispersion of weights. International Journal of Mathematics in Operational Research 14 (3):433–50. doi:10.1504/IJMOR.2019.099388.
- Erickson, B., S. Outland, B. Joy, J. Rockwern, R. D. Serchen, J. M. Mire, and Goldman, S. M. 2020. Envisioning a Better US Health Care System for All: Health Care Delivery and Payment System Reforms. Annals of Internal Medicine 172 (2_Supplement):S33–S49. doi:10.7326/M19-2407.
- Giménez, V., J. R. Keith, and D. Prior. 2019. Do healthcare financing systems influence hospital efficiency? A metafrontier approach for the case of Mexico. Health Care Management Science 22 (3):549–59. doi:10.1007/s10729-019-9467-9.
- Golany, B., and Y. Roll. 1989. An application procedure for DEA. Omega 17 (3):237–50.
- Gómez-Chaparro, M., J. García-Sanz-Calcedo, and J. Aunión-Villa. 2020. Maintenance in hospitals with less than 200 beds: Efficiency indicators. Building Research & Information 48 (5):526–37. doi:10.1080/09613218.2019.1678007.
- Hajiagha, S. H. R., S. S. Hashemi, H. A. Mahdiraji, and J. Azaddel. 2015. Multi-period data envelopment analysis based on Chebyshev inequality bounds. Expert Systems with Applications 42 (21):7759–67. doi:10.1016/j.eswa.2015.06.008.
- Hajiagha, S. H. R., H. A. Mahdiraji, E. K. Zavadskas, and S. S. Hashemi. 2013. A fuzzy data envelopment analysis approach based on parametric programming. International Journal of Computers Communications & Control 8 (4):594–607. doi:10.15837/ijccc.2013.4.580.
- Hajiagha, S. H. R., H. A. Mahdiraji, and M. Tavana. 2019. A new bi-level data envelopment analysis model for efficiency measurement and target setting. Measurement 147:106877. doi:10.1016/j.measurement.2019.106877.
- Hajiagha, S. H. R., H. A. Mahdiraji, M. Tavana, and S. S. Hashemi. 2018. A novel common set of weights method for multi-period efficiency measurement using mean-variance criteria. Measurement 129:569–81. doi:10.1016/j.measurement.2018.07.061.
- Härdle, W, and L. Simar. 2012. Applied multivariate statistical analysis. 3rd ed., vol. 22007. Berlin: Springer.
- Harrison, J. S., J. B. Barney, R. E. Freeman, and R. A. Phillips, eds. 2019. The Cambridge handbook of stakeholder theory. Cambridge, UK: Cambridge University Press.
- Hu, J. L., Y. Li, and H. J. Tung. 2017. Operational efficiency of ASEAN airlines: Based on DEA and bootstrapping approaches. Management Decision 55 (5):957–86. doi:10.1108/MD-07-2016-0489.
- İlgün, G., S. Sönmez, M. Konca, and B. Yetim. 2021. Measuring the efficiency of Turkish maternal and child health hospitals: A two-stage data envelopment analysis. Evaluation and Program Planning 102023. doi:10.1016/j.evalprogplan.2021.102023.
- Kakemam, E, and H. Dargahi. 2019. The health sector evolution plan and the technical efficiency of public hospitals in Iran. Iranian Journal of Public Health 48 (9):1681.
- Khosravi, S., M. Barouni, R. Khajouei, and N. Fakhrzad. 2020. Evaluating the efficiency of health information technology departments of Iranian medical universities using data envelopment analysis during 2011. Interdisciplinary Journal of Virtual Learning in Medical Sciences 5 (1):26–32.
- Khushalani, J, and Y. A. Ozcan. 2017. Are hospitals producing quality care efficiently? An analysis using Dynamic Network Data Envelopment Analysis (DEA). Socio-Economic Planning Sciences 60:15–23. doi:10.1016/j.seps.2017.01.009.
- Kočišová, K, and J. Sopko. 2020. The efficiency of public health and medical care systems in EU countries: Dynamic network data envelopment analysis. Acta Universitatis Agriculturae et Silviculturae Mendelianae Brunensis 68 (2):383–94. doi:10.11118/actaun202068020383.
- Kohl, S., J. Schoenfelder, A. Fügener, and J. O. Brunner. 2019. The use of Data Envelopment Analysis (DEA) in healthcare with a focus on hospitals. Health Care Management Science 22 (2):245–86. doi:10.1007/s10729-018-9436-8.
- Limleamthong, P, and G. Guillén-Gosálbez. 2018. Mixed-integer programming approach for dimensionality reduction in data envelopment analysis: Application to the sustainability assessment of technologies and solvents. Industrial & Engineering Chemistry Research 57 (30):9866–78. doi:10.1021/acs.iecr.7b05284.
- Liu, J., B. He, X. Xu, L. Zhou, J. Li, G. Wang, and Y. Chen. 2019. Determinants of efficiency growth of county-level public hospitals-evidence from Chongqing, China. BMC Health Services Research 19 (1):858. doi:10.1186/s12913-019-4609-9.
- Mardani, A., E. K. Zavadskas, D. Streimikiene, A. Jusoh, and M. Khoshnoudi. 2017. A comprehensive review of data envelopment analysis (DEA) approach in energy efficiency. Renewable and Sustainable Energy Reviews 70:1298–322. doi:10.1016/j.rser.2016.12.030.
- Marins, F. A. S., A. F. da Silva, R. de Carvalho Miranda, and J. A. B. Montevechi. 2020. A new approach using fuzzy DEA models to reduce search space and eliminate replications in simulation optimization problems. Expert Systems with Applications 144:113137. doi:10.1016/j.eswa.2019.113137.
- Meng, W., D. Zhang, L. Qi, and W. Liu. 2008. Two-level DEA approaches in research evaluation. Omega 36 (6):950–7. doi:10.1016/j.omega.2007.12.005.
- Mirmozaffari, M., E. Shadkam, S. M. Khalili, and M. Yazdani. 2021. Developing a novel integrated generalised data envelopment analysis (DEA) to evaluate hospitals providing stroke care services. Bioengineering 8 (12):207–18. doi:10.3390/bioengineering8120207.
- Mirmozaffari, M., R. Yazdani, E. Shadkam, S. M. Khalili, M. Mahjoob, and A. Boskabadi. 2022a. An integrated artificial intelligence model for efficiency assessment in pharmaceutical companies during the COVID-19 pandemic. Sustainable Operations and Computers 3:156–67. doi:10.1016/j.susoc.2022.01.003.
- Mirmozaffari, M., R. Yazdani, E. Shadkam, S. M. Khalili, L. S. Tavassoli, and A. Boskabadi. 2022b. A novel hybrid parametric and non-parametric optimisation model for average technical efficiency assessment in public hospitals during and post-COVID-19 pandemic. Bioengineering 9 (1):7. doi:10.3390/bioengineering9010007.
- Moncayo–Martínez, L. A., A. Ramírez–Nafarrate, and M. G. Hernández–Balderrama. 2020. Evaluation of public HEI on teaching, research, and knowledge dissemination by Data Envelopment Analysis. Socio-Economic Planning Sciences 69:100718. doi:10.1016/j.seps.2019.06.003.
- Montalto, M., P. McElduff, and K. Hardy. 2020. Home ward bound: Features of hospital in the home use by major Australian hospitals", 2011–2017. Medical Journal of Australia 213 (1):22–7. doi:10.5694/mja2.50599.
- Mozaffari, M. M., M. Taghizadeh-Yazdi, S. Nazari-Shirkouhi, and S. M. Asadzadeh. 2021. Measuring traffic safety culture toward achieving road safety performance: A DEA approach with undesirable inputs-outputs. Cybernetics and Systems 52 (7):601–24. doi:10.1080/01969722.2021.1914947.
- Nataraja, N. R, and A. L. Johnson. 2011. Guidelines for using variable selection techniques in data envelopment analysis. European Journal of Operational Research 215 (3):662–9. doi:10.1016/j.ejor.2011.06.045.
- Omrani, H., A. Alizadeh, A. Emrouznejad, and T. Teplova. 2022. A robust credibility DEA model with fuzzy perturbation degree: An application to hospitals performance. Expert Systems with Applications 189:116021. doi:10.1016/j.eswa.2021.116021.
- Omrani, H., K. Shafaat, and A. Emrouznejad. 2018. An integrated fuzzy clustering cooperative game data envelopment analysis model with application in hospital efficiency. Expert Systems with Applications 114:615–28. doi:10.1016/j.eswa.2018.07.074.
- Pereira, M. A., D. C. Ferreira, J. R. Figueira, and R. C. Marques. 2021. Measuring the efficiency of the Portuguese public hospitals: A value modelled network data envelopment analysis with simulation. Expert Systems with Applications 181:115169–14. doi:10.1016/j.eswa.2021.115169.
- Plaza-Úbeda, J. A., J. de Burgos-Jiménez, and E. Carmona-Moreno. 2010. Measuring stakeholder integration: Knowledge, interaction and adaptational behavior dimensions. Journal of Business Ethics 93 (3):419–42. doi:10.1007/s10551-009-0231-9.
- Ramanathan, R, and U. Ramanathan. 2010. A qualitative perspective to deriving weights from pairwise comparison matrices. Omega 38 (3–4):228–32. doi:10.1016/j.omega.2009.09.002.
- Ravaghi, H., M. Afshari, P. Isfahani, and V. D. Bélorgeot. 2019. A systematic review on hospital inefficiency in the Eastern Mediterranean Region: sources and solutions. BMC Health Services Research 19 (1):1–20.
- Razavi Hajiagha, S. H., S. S. Hashemi, and H. Amoozad Mahdiraji. 2014. DEA common set of weights based on a multi objective fractional programming. International Journal of Industrial Engineering and Production Research 25 (3):207–14.
- Rezaee, M. J., S. Yousefi, M. Eshkevari, M. Valipour, and M. Saberi. 2020. Risk analysis of health, safety and environment in chemical industry integrating linguistic FMEA, fuzzy inference system and fuzzy DEA. Stochastic Environmental Research and Risk Assessment 34 (1):201–18. doi:10.1007/s00477-019-01754-3.
- Şahin, B, and G. İlgün. 2019. Assessment of the impact of public hospital associations (PHAs) on the efficiency of hospitals under the ministry of health in Turkey with data envelopment analysis. Health Care Management Science 22 (3):437–446. doi:10.1007/s10729-018-9463-5.
- See, K. F., N. M. Hamzah, and M. M. Yu. 2021. Metafrontier efficiency analysis for hospital pharmacy services using dynamic network DEA framework. Socio-Economic Planning Sciences 78:101044. doi:10.1016/j.seps.2021.101044.
- Teuben, M., N. Löhr, K. O. Jensen, M. Brüesch, S. Müller, R. Pfeifer, L. Mica, H. C. Pape, and K. Sprengel. 2020. Improved pre-hospital care efficiency due to the implementation of pre-hospital trauma life support (PHTLS®) algorithms. European Journal of Trauma and Emergency Surgery 46 (6):1321–5. doi:10.1007/s00068-019-01141-1.
- Wang, D. D. 2020. Ranking multiple-input and multiple-output units: A comparative study of data envelopment analysis and rank aggregation. Expert Systems with Applications 160:113687. doi:10.1016/j.eswa.2020.113687.
- Watkins, M. W. 2021. A step-by-step guide to exploratory factor analysis with SPSS. Oxfordshire: Routledge.
- Yazdi, M. R. T., M. M. Mozaffari, S. Nazari-Shirkouhi, and S. M. Asadzadeh. 2018. Integrated fuzzy DEA-ANFIS to measure the success effect of human resource spirituality. Cybernetics and Systems 49 (3):151–69. doi:10.1080/01969722.2018.1448221.
- Yeşilyurt, M. E., E. Şahin, M. D. Elbi, A. Kızılkaya, M. U. Koyuncuoğlu, and F. Akbaş-Yeşilyurt. 2021. A novel method for computing single output for DEA with application in hospital efficiency. Socio-Economic Planning Sciences 76:100995.
- Yitbarek, K., A. Adamu, G. Tsega, Y. Siraneh, B. Erchafo, D. Yewhalaw, F. Tekle, and M. Woldie. 2019. Technical efficiency of maternal and reproductive health services in public hospitals of Oromia regional state, Ethiopia. Health Services Insights 12:1178632919837630. doi:10.1177/1178632919837630.
- Yousefi, S., R. F. Saen, and S. S. S. Hosseininia. 2019. Developing an inverse range directional measure model to deal with positive and negative values. Management Decision 57 (9):2520–40. doi:10.1108/MD-11-2017-1089.
- Zare, H., M. Tavana, A. Mardani, S. Masoudian, and M. K. Saraji. 2019. A hybrid data envelopment analysis and game theory model for performance measurement in healthcare. Health Care Management Science 22 (3):475–88. doi:10.1007/s10729-018-9456-4.