
 ?Mathematical formulae have been encoded as MathML and are displayed in this HTML version using MathJax in order to improve their display. Uncheck the box to turn MathJax off. This feature requires Javascript. Click on a formula to zoom.
ABSTRACT
The mechanical response of an embedded acrylic-based paint was analyzed using quasi-static and dynamic nano-indentation. The aim of this study was to propose and evaluate a methodology for selecting indentation test parameters for characterizing the mechanical properties of cross-sectional paint samples, particularly with respect to the inherent issues of embedding materials. The experimental methodology measured the reduced modulus (Er), dynamic reduced storage modulus (), and creep (CIT) of cross-sectional paint samples and compared the results with those obtained for a reference free-film paint sample. Although nano-indentation testing on cross-sectional paint samples has been conducted previously, a systematic approach focusing on the effects of sample size and compliance of the embedding material has yet to be introduced to the conservation field. Nano-indentation was performed on two cross-sectional samples of TiO2 acrylic paint of varying size to demonstrate the practical application and constraints of the technique.
RÉSUMÉ
La réponse mécanique d’une coupe transversale d’un film de peinture acrylique monté dans une résine a été analysée à l’aide de la nanoindentation quasi statique et dynamique. L’objectif de cette étude était de proposer et d’évaluer une méthodologie de sélection des paramètres d’essai d’indentation afin de caractériser les propriétés mécaniques de coupes transversales d’échantillons de peinture, en particulier en ce qui concerne les questions inhérentes aux matériaux dans lesquels les échantillons sont montés. Pour la méthodologie expérimentale, on a mesuré le module réduit (Er), le module de conservation réduit en mode dynamique () et le fluage (CIT) de coupes transversales d’échantillons de peinture, et on a comparé les résultats avec ceux obtenus pour un échantillon témoin d’un film de peinture non monté. Bien que des essais de nanoindentation sur des coupes transversales d’échantillons de peinture aient été effectués dans le passé, une approche systématique, axée sur les effets de la taille de l’échantillon et la conformité du matériel de montage, n’a pas encore été mise en œuvre dans le domaine de la conservation. La nanoindentation a été réalisée sur deux coupes transversales d’échantillons de peinture acrylique au blanc de titane (TiO2) de taille différente pour démontrer l’application pratique et les contraintes de cette technique. Traduit par Élisabeth Forest.
RESUMO
A resposta mecânica de uma tinta à base de acrílico incorporada foi analisada usando nanoindentação dinâmica e quase-estática. O objetivo deste estudo foi propor e avaliar uma metodologia para a seleção de parâmetros de teste de indentação para a caracterização das propriedades mecânicas de amostras de tintas de seções transversais, particularmente no que diz respeito às questões inerentes à incorporação de materiais. A metodologia experimental mediu o módulo reduzido (E
r), módulo de armazenamento dinâmico reduzido () e fluência (CIT) de amostras de seções transversais de tintas e comparou os resultados com os obtidos de uma amostra de tinta de referência sem película. Embora os testes de nanoindentação em amostras de seções transversais de tintas tenham sido realizados anteriormente, uma abordagem sistemática com foco nos efeitos do tamanho da amostra e na conformidade do material incorporado ainda não foi introduzida no campo de conservação. Nanoindentação foi realizada em duas amostras de seções transversais de tinta acrílica de TiO2 de tamanho variável para demonstrar a aplicação prática e as restrições da técnica. Traduzido por Millar Schisler.
RESUMEN
La respuesta mecánica de una pintura con base acrílica incrustada se analizó mediante nano-indentación cuasi-estática y dinámica. El objetivo de este estudio fue proponer y evaluar una metodología para seleccionar los parámetros de prueba de indentación para caracterizar las propiedades mecánicas de las muestras de pintura de sección transversal, en particular con respecto a los problemas inherentes a la inclusión de materiales. La metodología experimental midió el módulo reducido (E
r), el módulo de almacenamiento dinámico reducido () y la fluencia (CIT) de muestras de pintura de sección transversal y comparó los resultados con los obtenidos para una muestra de pintura de película de referencia libre. Aunque las pruebas de nano-indentación en muestras de pintura de sección transversal se han realizado anteriormente, aún no se ha introducido en el campo de la conservación un enfoque sistemático que se centre en los efectos del tamaño de la muestra y el cumplimiento del material de incrustación. La nano-indentación se realizó en dos muestras transversales de pintura acrílica TiO2 de tamaño variable para demostrar la aplicación práctica y las limitaciones de la técnica. Traducción Amparo Rueda.
1. Introduction
1.1. Indentation
Instrumented indentation testing (IIT), which is derived from the traditional hardness test, is routinely used to measure the mechanical properties of a material. The standard indentation test consists of pressing a probe with a well-defined geometry (e.g. Vickers, Berkovich) into a sample surface, with the resulting force-penetration depth (or load-displacement) curve serving as the “mechanical fingerprint” of the material. Extrapolated from these curves are quantitative mechanical properties of the material, such as stiffness and reduced modulus. Nano-indentation employs this technique at smaller scales and has become an established method for the mechanical characterization and quality control of materials (Hay and Pharr Citation2000; VanLandingham Citation2003), while being well suited for applications where physical samples are predominately small.
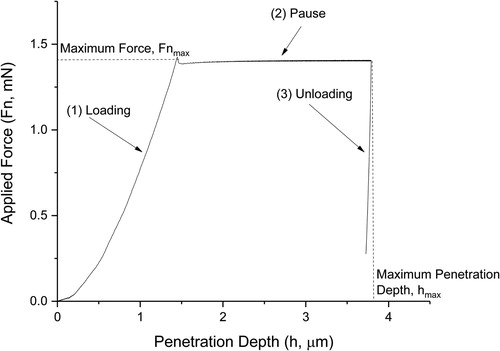
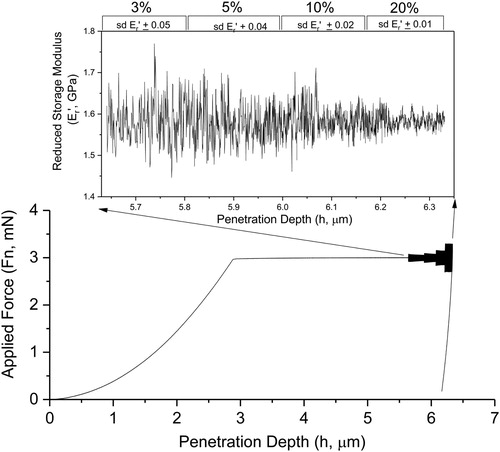
Indentation schemas allow one to adapt to the material type and the characterization aim. The mode of indentation may enable force control or penetration depth control. The general process carried out in this paper (and depicted in ) is comprised of three stages: (1) quasi-static loading (a slowly applied force), (2) pause, and (3) unloading. For materials exhibiting creep, a pause period is used to lessen any adverse effects on the slope of the unloading curve, from which the stiffness of the material is determined. When viscoelastic behavior is negligible, the pause segment may be omitted. In addition, a sinusoidal force variation (at a selected frequency) may be superimposed on the quasi-static loading process – this dynamic indentation technique can aid in characterizing the viscoelastic response of a material by establishing the reduced storage and loss moduli as a function of penetration depth. The method of post-processing the resulting force-penetration depth curves to obtain mechanical properties is described in the Appendix.
Figure 1. A typical force-penetration depth curve illustrating the three segments of indentation carried out during this study: (1) loading, (2) pause, and (3) unloading. The contact stiffness (S) of the material can be extrapolated from the slope of the unloading curve.
1.2. Application in the cultural heritage field
Nano-scale IIT has been successfully applied in the characterization of historic painting materials, demonstrating its capacity to produce consistent measurements of sub-millimeter paint samples (Salvant, Barthel, and Menu Citation2011; Salvant Citation2012; Wright et al. Citation2014) and investigate local inhomogenities in the pictorial layer near existing cracks (Giorgiutti-Dauphiné and Pauchard Citation2016). These results signal the potential for nano-indentation to mechanically characterize a wider subset of artists’ materials, which would support and further conservation and restoration practice by studying the effect of cleaning treatment or the softening caused by water sorption.
Sectioning of painted surfaces or paint films is often undertaken to examine the stratigraphy of a painting (e.g. degradation products, conservation treatments) or an artist’s working process (e.g. wet on wet painting, pentimenti, preferred pigments). Allowing for local chemical and optical assessments, cross-sectional samples can also be used for mechanical characterization, resulting in a more complete physicochemical assessment of these works. Though unsuitable for testing by conventional macro-scale methods, sub-millimeter samples taken from original artworks may be characterized mechanically by nano-indentation.
However, the successful adaptation of micro- and nano-indentation methods to measure pre-existing cross-sectional paint samples requires further investigation of fundamental issues. It is of crucial importance to understand the influence of sample preparation on the measured results, especially since historic samples are often unique and cannot be freely modified to accommodate the measurement technique. In addition, the variety and inhomogeneity of artistic materials make it difficult to establish common measuring protocols. Existing indentation standards and guidelines also focus on hard materials with limited discussion of the relatively soft and viscous materials employed by artists.
To address these concerns, a systematic approach is proposed for determining the appropriate nano-indentation test parameters, resulting in a measurement schema that can produce statistically relevant results. Particular attention was given to determining the edge effect of an embedded sample and the resulting distance from the sample/resin interface at which mechanical properties can be appropriately evaluated. This phenomenon may limit the applicability of nano-indentation for some cross-sectional samples of historic materials. The present study demonstrates how measured material properties can be influenced by unique features of a sample itself, and proposes a methodology to avoid, or at least estimate, potential inaccuracies.
2. Experimental design
2.1. Method
Material characterization was conducted at ambient conditions (22°C and 50%RH) using an Ultra Nano-indentation Tester (UNHT; Anton Paar) equipped with a modified Berkovich diamond indenter (three-sided pyramidal, half angle: 65.3° ± 0.3°, β: 1.034). The UNHT is capable of performing indentations with a force up to 100 mN and a penetration depth up to 100 µm at a nanoscale resolution. The nano-indentation module is affixed to a high stiffness frame alongside a Micro Combi Tester (micro indentation/scratch; MCT; Anton Paar), an atomic force microscope (Nanosurf Nanite B) and an optical microscope (Olympic). The various modules are paired with a sample stage controlled by an XYZ stepping motor, allowing for automated and accurate positioning between the testing module and imaging units. The frame and stage are also attached to a vibration isolating table to lessen the influence from vibration and noise. The indenter calibration procedure was carried out on a fused silica standard.
2.2. Materials
The materials selected for this study were a titanium white (TiO2) acrylic-based paint and a single component acrylic-based embedding resin. Commonly used by modern and contemporary artists, acrylic paints are composed of aqueous emulsions of acrylic polymers and a variety of fillers. The success and widespread usage of these materials is due to a suite of advantageous working and physicochemical properties: fast drying time, flexibility, mechanical stability under light exposure, high resistance to chemicals, durability, and an ability to be thinned with water (Jablonski et al. Citation2003; Learner Citation2004; Ormsby, Hodgkins, and von Aderkas Citation2012). Acrylic-based paints can behave elastically or viscoelastically, depending on pigment-volume concentrations (PVC) and environmental conditions. Thus, this class of material represents a challenging case study for mechanical properties characterization.
To characterize the effects of embedding and the inherent complications of sample size, the testing materials were prepared as free-films and cross-sectional samples. Test samples were prepared using Golden Artist Colors’ Heavy Body titanium white (PW6) acrylic-based paint which consists of poly n-butyl methacrylate/methyl methacrylate (p(nBA/ MMA)) (Ormsby et al. Citation2007) with a PVC of 0.33 (Ormsby et al. Citation2008) and a particle diameter of ∼ 300 nm (Hagan et al. Citation2009). Typically, a Poisson’s ratio between 0.35 (glassy state) and 0.5 (rubbery state) is used to describe polymers (Tschoegl, Knauss, and Emri Citation2002; Hagan et al. Citation2011). This paint was cast on Mylar sheets and allowed to dry in ambient conditions for at least 40 days, resulting in an average dry thickness of 0.24 mm. The casted paint was removed from the Mylar and served as the reference free-film sample for indentation.
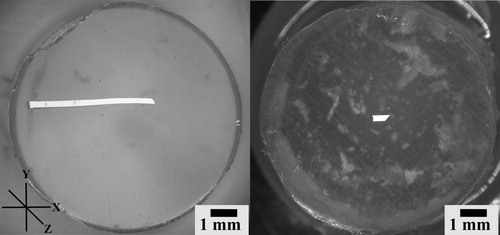
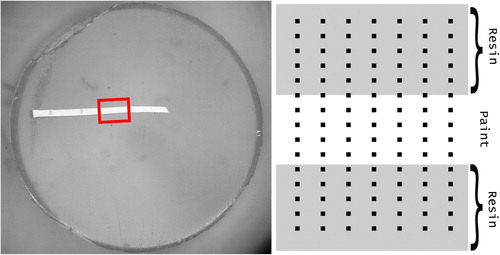
Two cross-sectional paint samples were prepared by embedding a sub-millimeter sample (in terms of thickness and height) of the free-film in a blue light-curing one component acrylic-based resin (Technovit 2000 LC; Heraeus Kulzer, Germany). Based on monofunctional and difunctional methacrylate, Technovit 2000 LC resin was chosen as the embedding resin due to its high transparency, fast curing time (about 40 min), and ability to cure at low temperatures. After hardening of the resin, the cross-sectional samples were progressively hand polished using Micro-Mesh cloths (Scientific Instrument Services, Inc.) with particle sizes ranging from 30 to 2 microns and fixed to microscope slides using a hot melt adhesive. Images of the two cross-sectional samples showing the thickness of samples were captured using a Keyence VHX-6000 with 0° tilt (). The large cross-sectional sample, has a thickness ranging from 242 to 246 µm (which is represented as the y-axis in ), while the smaller sample, which tapers at one end, has a thickness ranging from 3 to 244 µm (y-axis). As the overall dimensions of the embedded paint slivers were of importance, a micro computed tomography (µ-CT) scan was used to capture the shape and, more specifically, the height (z-axis) of the sample, which was not visible with the optical microscope. The two cross-sectional paint samples differed in size: the larger sample had an average length of 5.2 mm and a height ranging from 263 to 270 µm, while the smaller sample had a mean length of 0.6 mm with height ranging from 6 to 200 µm (Zeiss Xradia µ-CT; Dragonfly Pro software). The intrinsic tackiness of the underside of the free-film sample allowed it to self-adhere to a glass slide, after which hand polishing was carried out in a manner similar to that applied to the cross-sectional sample (ensuring that any changes caused by the polishing method would be present in all samples).
Figure 2. Image of cross-sectional samples showing the thickness (y-axis) and length (x-axis) of TiO2 acrylic-based paint (white sliver) embedded in Technovit 2000 LC resin at 20x magnification (Keyence VHX-6000; 0° tilt). The left and right images show the large (length: ∼5.2 mm) and small (length: ∼0.6 mm) cross-sectional samples, respectively. Note the height of the sample cannot be observed in these images.
2.3. The selection and optimization of the measuring protocol
Acrylic-based materials exhibit viscoelastic behavior (i.e. mechanical properties of both elastic solids and viscous fluids) and, as such, their mechanical properties can be dependent on the experimental conditions (e.g. strain rate and temperature). In this study, the main criteria of the nano-indentation scheme was to develop a protocol for a specific material type in which the results were weakly dependent on the test parameters. To achieve this goal, preliminary quasi-static and dynamic indentation tests were performed on the free-film sample, with the results used to develop a measurement protocol for the paint and resin surfaces of the embedded samples. In addition, the effects of the embedding process on the measured mechanical properties of acrylic-based paint samples were examined. Initial test development focused on defining three essential measurement parameters: depth of penetration, frequency of force modulation, and amplitude of force oscillation.
2.3.1. Establishing penetration depth using quasi-static indentation
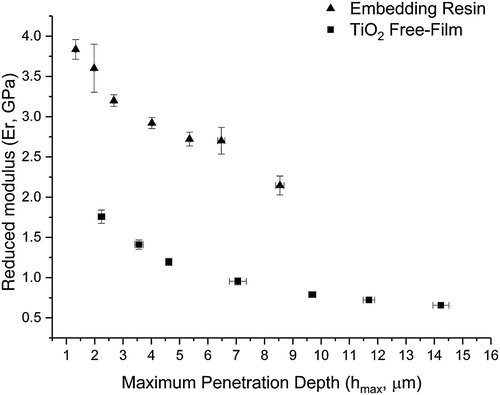
For indentation testing, the selection of a maximum indentation depth (hmax) presents the user with conflicting requirements. While shallow indents with a small diameter maximize the surface area that can be tested, deeper indents with a larger diameter may be needed to avoid errors due to sample surface roughness and surface size effect (e.g. when material properties are a function of penetration depth) (Han, Sanei, and Alisafaei Citation2016), thereby reducing the available testing area. To optimize hmax, one can identify the penetration depth value above which reduced moduli (Er) do not change significantly.
Operating the nano-indenter by depth control – the instrument controls penetration depth and the resulting force is measured – the free-film paint and resin samples were loaded at a constant strain rate of 0.4 s–1 until reaching the desired penetration depth, after which the force was held constant for 120 s. The fast loading rate limits the extent of creep that can occur during the initial loading stage, while the extended pause period provides sufficient time for creep to terminate (asymptotic response) or stabilize (constant rate). Following the pause, the sample was unloaded at the maximum available speed of 300 mN/min. To check reproducibility, seven indents spaced 50 µm apart were performed on the resin and free-film paint. shows the influence of penetration depth on the Er value, with the free-film value nearing an apparent asymptote beyond a depth of 6 µm.
Figure 3. The reduced modulus (Er) measured at different maximum penetration depths (hmax) for the embedding resin and the free-film, during depth-controlled nano-indentation. The free-film modulus becomes less dependent on hmax for values larger than 6 µm.
2.3.2. Establishing frequency for dynamic indentation
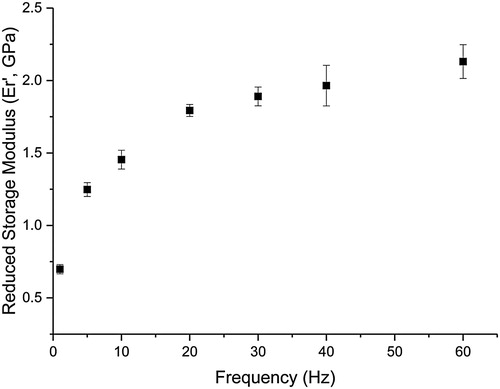
Dynamic nano-indentation was performed on a free-film sample using a frequency sweep test, ranging from 1 to 60 Hz with a loading rate of 0.4 s−1, while holding constant a maximum force of 3 mN and a force amplitude of 10% (of maximum force). The protocol for determining the optimum frequency examined the average reduced storage modulus for different oscillation frequencies at hmax values of 6 µm or deeper (). Since frequency tests were carried out in load control, not all indents reached the desired depth, as slightly stiffer areas in the sample resulted in shallower indents. Focusing on indents with penetration depths deeper than 6 µm, illustrates an increase in modulus and signal noise with higher frequencies, indicating that harmonic frequency is a critical test parameter for dynamic nano-indentation of this sample. Exposure of acrylic-based material to higher frequencies suppresses the time dependent behavior, resulting in increased stiffness. While frequencies above 30 Hz display higher signal noise, the reduced moduli measured at 20 Hz and above display comparable results. From these findings, 20 Hz was selected as the force modulation frequency for dynamic nano-indentation of TiO2 acrylic-based paint, as at this frequency, the modulus becomes weakly dependent on oscillation frequency and signal noise remains relatively small. In addition, since the range of
measured at 20 Hz falls within the standard deviation of the moduli measured at 30 and 40 Hz, it can be assumed that the measured stiffness and
is representative of the elastic properties of material.
Figure 4. The average reduced storage modulus measured for a free-film sample of TiO2 paint as a function of oscillation frequency. This measurement protocol holds constant maximum load (3 mN), loading rate (0.4 s−1), and force amplitude (10%).
2.3.3. Establishing amplitude for dynamic indentation
A systematic force-controlled test was also performed on the free-film sample to analyze the influence of the amplitude of force oscillation on the measured modulus value. Applied at the end of the pause segment, increasing amplitudes (3, 5, 10 and 20% of the maximum force) of force oscillations at 20 Hz were superimposed on the quasi-static loading process (). While the measured force amplitude has very little effect on the average value at penetration depths around 6 µm, the increase in amplitude results in a reduction of measurement uncertainty. In turn, higher oscillation amplitudes limit the possibility to perform dynamic indentation tests at shallower depths, which may be important when analyzing surface phenomena. As a compromise, “10% of the max force” was selected as a reasonable value of force amplitude for dynamic nano-indentation.
Figure 5. Testing of varying amplitudes (3, 5, 10 and 20% of maximum force) of a 20 Hz force oscillation applied to a free-film paint sample near the end of the pause segment. The measured reduced storage modulus and its standard deviation during these amplitude variations is presented in the upper plot.
3. Results
Using the optimized parameter values described in the previous section, the mechanical properties of cross-sectional and free-film TiO2 acrylic-based paint samples were measured using nano-indentation. At the nanoscale, the free-film sample offers a virtually unlimited surface area, while the test area of a cross-sectional paint sample is restricted. Further, the mechanical properties of the embedded paint sample may be influenced by the embedding process – measurements taken in close proximity to the resin-paint interface can be impacted by edge effects (i.e. boundaries between phases, dependence of mechanical properties on distance from an edge) or the infiltration of the embedding resin into the free-film sample.
The following sections focus on two studies of these embedding effects. A series of measurements, at varying distances from the resin-paint interface, were performed on the large embedded paint sample and compared to results obtained for the reference free-film. The effect of sample size was then examined by drawing comparisons between the mechanical response of the small and large cross-sectional samples using the same indentation protocol.
3.1. Examining the dynamic and quasi-static response of TiO2 acrylic-based paint
Dynamic indentation measurements for the cross-sectional and free-film samples were obtained using parameters described in the previous section: a constant strain loading rate of 0.4 s−1, an unloading rate of 300 mN/min, and a sinusoidal force with an amplitude of 10% of the maximum force and a frequency of 20 Hz superimposed on the primary loading history. For the large cross-sectional sample, indents were conducted across two resin-paint interfaces, with adjacent indents separated by 50 µm – the testing area and indentation array is shown in .
Figure 6. Large cross-sectional sample of TiO2 acrylic-based paint (sample thickness of 244 µm). Left: the red rectangle denotes the area where nano-indentation measurements were performed. Right: a geometrical representation of the indentation array, with 50 µm spacing between adjacent indents.
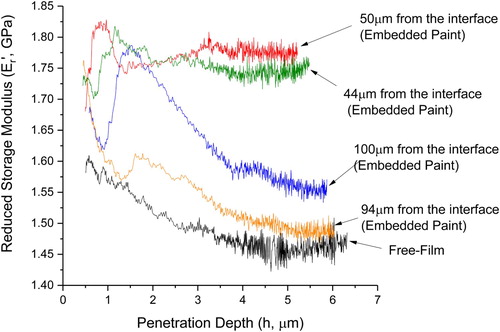
The reduced storage modulus () was calculated throughout the loading and pause segments of the embedded paint and free-film analyses. Each curve shown in represents the average of seven measurements performed at the same distance from the paint–resin interface. At the maximum penetration depth (hmax: ∼ 6 µm),
values determined near the middle of the embedded paint (blue and orange lines) are roughly comparable to those of the free-film (black line). The dependence of storage modulus on penetration depth is also evident in the changing
values particularly at shallower indentation depths.
Figure 7. Average reduced storage modulus obtained for the free-film and the large cross-sectional paint sample, the latter of which was measured at varying distances from the closest resin-paint interface. Nano-indentation tests were conducted at 20 Hz with a strain rate of 0.4 s–1 and a dynamic amplitude of 10% of the max force.
Subsequent analyses plotted the mechanical response across the embedded sample (resin and paint) as a function of distance from the resin-paint interface. shows the reduced storage modulus and reduced modulus at the maximum penetration depth, while presents percent creep and maximum penetration depth. In both figures, each data point represents the average value from seven nano-indentation tests, with error bars representing the standard deviation. Dashed lines are also used to depict reference values (middle) and their uncertainty (top and bottom) measured for the free-film paint sample and resin.
Figure 8. Mean (a) reduced storage modulus and (b) reduced modulus at hmax of embedded paint and embedding resin as a function of the distance from the paint-resin interface. The paint-resin interfaces are located at 0 and 244 µm. Dotted lines represents the reference moduli and its standard deviation obtained for free-film paint and resin.
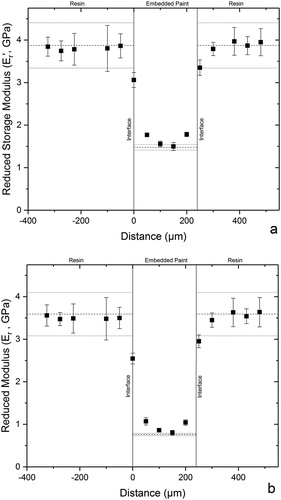
Figure 9. Mean (a) creep and (b) max penetration depth of the paint and resin as a function of the distance from the paint-resin interface. The paint-resin interfaces are located at 0 and 244 µm. Dotted lines represent reference values for (a) indentation creep and (b) penetration depth, and its corresponding standard deviation obtained for free-film paint and resin.
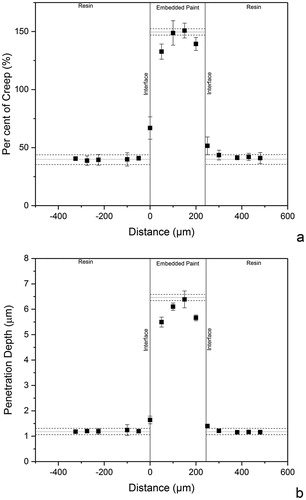
Comparison of the reference values for the free-film paint and embedding resin in and show that the paint is mechanically more compliant (three times smaller modulus) and exhibits more time-dependent deformation (three times higher creep) than the resin. Also, there is a pronounced dependency of the measured properties on the distance from the resin-paint interface. At the interface, the proximity of stiffer resin to the softer paint strongly influences the indentation process on the embedded paint, resulting in a higher stiffness, and reduced creep and penetration depth than observed for the free-film. This effect is asymmetric (Zhao and Ovaert Citation2010; Armitage and Oyen Citation2017) with the resin showing much less influence than the paint from its proximity to the paint-resin interface.
The difference between the measured modulus values at the paint-resin interface and the reference values can also be influenced by infiltration of resin into the paint structure during the embedding process, with the degree of infiltration dependent on the sample and the choice of embedding resin. Analysis of such a phenomenon requires further examination of samples using a range of embedding materials and procedures, and conducting tests with varying maximum indentation depths.
3.2. Examining the influence of size effect on cultural heritage cross-sectional samples
The effect of sample size was investigated by comparing the at the maximum penetration depth of the large and small cross-sectional samples. For the larger cross-sectional sample, indents were performed in the middle of the embedded paint sliver. In contrast, the size of the small cross-sectional sample allowed one to employ an indentation matrix spanning the entirety of the sample (). For both samples, adjacent indents were separated by at least 50 µm.
Figure 10. Profile image of cross-sectional samples of TiO2 acrylic-based paint embedded in Technovit 2000 LC resin with corresponding contour plots of the reduced storage modulus at the maximum penetration depth. To emphasize sample depth (dark regions of embedded material), images were captured using a Keyence microscope with 30° tilt (VHX-6000). The left image was captured at 100x, while the right image was captured at 300x. The black outline and dots on the contour plots denote the paint-resin interface and the nano-indentation locations, respectively.
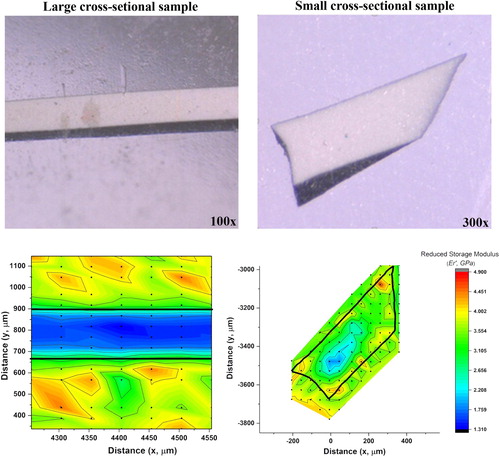
A comparison of the reduced storage modulus contour plots for the large and small cross-sectional samples, shown in , offers deeper insight into the effect of sample preparation and the sample material itself. For the small cross-sectional sample, the Er’ approaches the moduli of the free-film paint sample (1.5 ± 0.1 GPa) in a limited region near the middle of the sample. The larger cross-sectional sample, however, has a much broader area (at least 80 µm from the paint-resin interface) in which the reduced storage modulus matches that of the free-film paint sample. This inherent difference in material properties between the two cross-sectional samples, taken from the same casted TiO2 acrylic-based paint, is due to the three dimensional shape of the embedded paint. shows the cross-sectional samples captured using the Keyence Microscope at a 30° tilt, emphasizing sample depth (denoted by dark areas of the embedded material). In addition to its much shorter length (small sample: 0.6 mm, large sample: 5.2 mm, ), the wide height range of the small sample (6–200 µm) compared to that of the large sample (263–270 µm) indicates that the mechanical properties for the majority of the small sample will be impacted by close proximity to the resin-paint interface ().
These indentation maps show the limitations of using nano-indentation for characterizing exceedingly small cultural heritage materials and exemplifies the challenges of preparing cross-sectional samples which are small enough to not detract from the aesthetics of the artwork, but of a sufficient size to allow for meaningful analyses. Additional research is needed to explore the individual and combined roles of resin infiltration and edge effects upon the mechanical properties of embedded samples.
4. Conclusions
Due to its ability to conduct IIT on a small-scale, nano-indentation is well suited to an investigation of the viscoelastic mechanical properties of embedded artists’ materials. Experiments conducted on reference free-film samples and cross-sectional samples of TiO2 acrylic-based paint (Golden Artist Colors’ Heavy Body titanium white) show that reliable measurements of embedded cross-sections are possible, as values of reduced storage modulus and reduced modulus near the middle of the embedded sample correspond to those obtained from the reference free-film sample. However, an appropriate nano-indentation protocol must be elaborated and the geometrical effects of the sample taken into consideration. Current results suggest that the restrictions of using nano-indentation for historic paint cross-sections originates from the inherent properties of the sample (e.g. material type, embedding method, surface polishing), rather than limitations of the analytical technique itself.
The issue of distance from the sample edge at which the mechanical properties of material can be appropriately evaluated is particularly important, as this may limit the applicability of nano-indentation for small cross-sectional samples. Further tests of artists’ paints exhibiting varied creep behavior, as well as the use of a range of embedding materials and protocols, are planned to help untangle this issue. Subsequent research will also extend the measurement program to investigate correlations between the nano-, micro- and macro-scale mechanical properties for specific classes of artistic materials. Establishing such a multi-scale relationship would further the use of nano-indentation data within existing predictive models of material behavior and support the development of new predictive tools for the conservation field.
Acknowledgments
The authors would like to acknowledge the support of The Getty Conservation Institute’s Managing Collections Environments Initiative.
Disclosure statement
No potential conflict of interest was reported by the authors.
Additional information
Notes on contributors
Ashley Freeman
Ashley Freeman is currently working on her PhD at the Norwegian University of Science and Technology (NTNU-Trondheim). Her research is part of the Sustainable Management of heritage Buildings in a Long-term perspective (SyMBoL) project and focuses on the physical behavior of distemper paint from Norwegian stave churches. Prior to her studies at NTNU, Freeman was the research lab associate (2016–2018) and graduate intern (2015–2016) for the Managing Collection Environments Initiative, at the Getty Conservation Institute. She holds a MAC in Conservation Science from Queen's University, a study certificate for restoration and conservation from the Lorenzo de’ Medici, and a MS in Chemistry from Loyola University Chicago. Address: The Getty Conservation Institute, 1200 Getty Center Drive, Suite 700, Los Angeles, CA 90049-1684, USA. Email: [email protected]
Michal Łukomski
Michal Łukomski is head of Preventive Conservation research, which assesses the effects of environmental conditions and lighting on museum objects. He received his PhD in physics from the Jagiellonian University in Krakow, Poland, in 2003 and completed his postdoctorate fellowship at the University of Windsor in Canada. For the last several years, he has worked on describing quantitatively the response of hygroscopic materials relevant to collections of fine and decorative art, in particular wood, textiles, animal glue, gesso and paints to variations of climate conditions, using several scientific methods. His current area of research focuses on the mechanical characterization of historic materials and their response to changes of environmental parameters, as well as investigation of painted surfaces by advanced optical techniques. Address: As for Freeman. Email: [email protected]
Vincent Beltran
Vincent Beltran joined GCI Science in 2002. He has been an active participant in a range of projects including the mechanical characterization of historic materials, evaluations of packing case performance during transport, the advancement of microfading tester practice in the conservation field, and assessments of environmental management systems in hot and humid climates. He is also a co-author of Environmental Management for Collections: Alternative Conservation Strategies for Hot and Humid Climates. He holds a BS in General Chemistry from the University of California, Los Angeles and an MS in Oceanography (Geochemistry) from the University of Hawaii at Manoa. Address: As for Freeman. Email: [email protected]
References
- Armitage, Oliver E., and Michelle L. Oyen. 2017. “Indentation Across Interfaces Between Stiff and Compliant Tissues.” Acta Biomaterialia 56 (Supplement C): 36–43. doi:10.1016/j.actbio.2016.12.036.
- Giorgiutti-Dauphiné, Frédérique, and Ludovic Pauchard. 2016. “Painting Cracks: A Way to Investigate the Pictorial Matter.” Journal of Applied Physics 120 (6). doi:10.1063/1.4960438.
- Hagan, Eric W. S., Maria N. Charalambides, Christina T. Young, Thomas J. S. Learner, and Stephen Hackney. 2009. “Tensile Properties of Latex Paint Films with TiO2 Pigment.” Mechanics of Time-Dependent Materials 13 (2): 149–161. doi:10.1007/s11043-009-9076-y.
- Hagan, Eric W. S., Maria N. Charalambides, Christina R. T. Young, Thomas J. S. Learner, and Stephen Hackney. 2011. “Influence of the Inorganic Phase Concentration and Geometry on the Viscoelastic Properties of Latex Coatings through the Glass-Transition.” Polymer 52: 1662–1673. doi: 10.1016/j.polymer.2011.01.060
- Han, Chung-Souk, Seyed H. R. Sanei, and Farid Alisafaei. 2016. “On the Origin of Indentation Size Effects and Depth Dependent Mechanical Properties of Elastic Polymers.” Journal of Polymer Engineering 36 (1): 103–111. doi: 10.1515/polyeng-2015-0030
- Hay, Jennifer L., and George M. Pharr. 2000. Instrumented Indentation Testing. Materials Park, OH: ASM International, 232–243.
- Jablonski, Elizabeth, Thomas J. S. Learner, James Hayes, and Mark Golden. 2003. “Conservation Concerns for Acrylic Emulsion Paints.” Reviews in Conservation 4: 1–10.
- Learner, Thomas J. S. 2004. Analysis of Modern Paints. Los Angeles: Getty Publications.
- Oliver, Warren Carl, and George Mathews Pharr. 1992. “An Improved Technique for Determining Hardness and Elastic Modulus Using Load and Displacement Sensing Indentation Experiments.” Journal of Materials Research 7 (6): 1564–1583. doi: 10.1557/JMR.1992.1564
- Oliver, Warren Carl, and George Mathews Pharr. 2004. “Measurement of Hardness and Elastic Modulus by Instrumented Indentation: Advances in Understanding and Refinements to Methodology.” Journal of Materials Research 19 (1): 3–20. doi:10.1557/jmr.2004.19.1.3.
- Ormsby, Bronwyn, G. Foster, Thomas J. S. Learner, S. Ritchie, and Michael Schilling. 2007. “Improved Controlled Relative Humidity Dynamic Mechanical Analysis of Artists’ Acrylic Emulsion Paints. Part II. General Properties and Accelerated Ageing.” Journal of Thermal Analysis and Calorimetry 90 (2): 503–508. doi: 10.1007/s10973-006-7725-9
- Ormsby, Bronwyn, Eric Hagan, Patricia Smithen, and Thomas J. S. Learner. 2008. “Comparing Contemporary Titanium-White Based Acrylic Emulsion Grounds and Paints: Characterisation, Properties and Conservation.” In Preparation for Painting: The Artists’ Choice and Its Consequences, edited by J. H. Townsend, T. Doherty, G. Heydenreich, and J. Ridge, 163–171. London: Archetype.
- Ormsby, Bronwyn, Robyn Hodgkins, and Nelly von Aderkas. 2012. “Preliminary Investigations into Two New Acrylic Emulsion Paint Formulations: W&N Artists’ Acrylic Colours and Golden Open Acrylics.” E- Preservation Science: Scientific Research for the Preservation of Cultural Heritage 9: 9–16.
- Salvant, Johanna. 2012. “Characterizations of Chemical Properties of Van Gogh's Painting Materials: White Paints.” Université Pierre et Marie Curie – Paris VI (2012PA066052).
- Salvant, Johanna, Etienne Barthel, and Michel Menu. 2011. “Nanoindentation and the Micromechanics of Van Gogh Oil Paints.” Applied Physics A: Materials Science & Processing 104 (2): 509–515. doi: 10.1007/s00339-011-6486-x
- Tschoegl, N. W., Wolfgang G. Knauss, and Igor Emri. 2002. “Poisson's Ratio in Linear Viscoelasticity – A Critical Review.” Mechanics of Time-Dependent Materials 6 (1): 3–51. doi:10.1023/A:1014411503170.
- VanLandingham, Mark R. 2003. “Review of Instrumented Indentation.” Journal of Research of the National Institute of Standards and Technology 108 (4): 249–265. doi:10.6028/jres.108.024.
- Wright, Madeleine S., Maggie Hudson, Maria Kokkori, Kim Muir, Francesca Casadio, Katherine T. Faber, and Kenneth R. Shull. 2014. “Quantifying the Mechanical Properties of Artists’ Paints with Nanoindentation.” Proceedings of the 2014 Annual Meeting of the Adhesion Society, San Diego, CA.
- Zhao, Y., and T. C. Ovaert. 2010. “Error Estimation of Nanoindentation Mechanical Properties Near a Dissimilar Interface via Finite Element Analysis and Analytical Solution Methods.” Journal of Materials Research 25 (12): 2308–2316. doi: 10.1557/jmr.2010.0295
Appendix. Post-processing of force-penetration depth curves
Post-processing models are used to extrapolate mechanical properties from force-penetration depth (or load-displacement) curves obtained with indentation. The Oliver-Pharr method, originally designed to analyze homogeneous, and isotropic (uniform physical properties) materials, has been applied here to materials displaying viscoelastic behavior. The method is based on the assumption that the unloading history (segment 3 in ) is purely elastic and uses the initial slope of the unloading curve to determine mechanical parameters such as stiffness (S) and reduced modulus (Er).
Using the Oliver-Pharr method (Citation1992), Er (GPa) is expressed by:(A1)
(A1) where β is a geometric factor of the indenter tip, S is the contact stiffness (mN/nm), and Ap is the projected contact area (µm2). The Young’s modulus of the test sample (Es, GPa) can then be determined using:
(A2)
(A2) where ν is Poisson’s ratio and E is Young’s modulus (GPa), with subscripts s and i referring to the test material and indenter, respectively. Since Ei is several orders of magnitude larger than that of Es, the second term in the denominator of Equation (A2) can be omitted, reducing the equation to
(A3)
(A3) If the Poisson’s ratio of the sample (νs) is known, the Young’s modulus of the test material can be determined. However in this paper, Er (Equation A1), rather than Es (Equation A3), will be reported, as to avoid selecting a specific, and unknown, Poisson’s ratio from the range cited in Section 2.2.
The time-dependent creep behavior (CIT) of a sample examines the relative change in indentation depth under constant force, and can be assessed using the following equation:(A4)
(A4) where h1 and h2 are the indentation depths (µm) at the beginning and end of the pause, respectively.
Dynamic instrumental indentation – or continuous stiffness measurement (CSM) (Oliver and Pharr Citation2004) – consists of superimposing a sinusoidal variation on a quasi-static loading process. It allows for the continuous monitoring of the complex stiffness as a function of penetration depth. The complex stiffness is used to determine the complex modulus (Ec), which consists of its storage or in-phase component () and its loss or out-of-phase component (
).
(A5)
(A5) The ratio of the loss to the storage component of the dynamically obtained reduced modulus is referred to as tan δ, which quantifies a material’s ability to absorb or disperse energy due to sinusoidal deformation:
(A6)
(A6) For dynamic force-controlled indentation tests, the resulting displacement amplitude and response delay are measured. In the limit of linear viscoelasticity, dynamic reduced storage (
) and loss (
) moduli can be calculated using the following equations:
(A7)
(A7)
(A8)
(A8) where δ is the phase shift or lag between the applied force and resulting deformation (δ is 0 or 90° for a purely elastic or viscous material, respectively, whereas a viscoelastic material would have an intermediate value), P0 is the amplitude of harmonic load, and h0 is the amplitude of harmonic displacement.