
ABSTRACT
This study proposes a method for the classification of lithic raw materials by means of hyperspectral imaging, a non-destructive fast analytical technique. The information potential of this approach was tested on a dwelling site dated to mid-late Mesolithic (7200–5800 BP) at Lillsjön, Ångermanland, Sweden. A dataset of lithic tools and flakes (2612 objects) made of quartz and quartzite, was analyzed using a shortwave infrared hyperspectral imaging system. The classification of the raw materials was performed applying multivariate statistical models. A random test set of 55 artefacts was selected, classified according to spectral signature and divided into categories corresponding to different geological materials. The same test set was analyzed with Energy Dispersive X-Ray Fluorescence (ED XRF) to validate the classification. The entire dataset of lithics collected on the site was then classified applying a SIMCA model. The distribution of items on the site was visualized in a 3D GIS platform according to their geological characteristics to highlight patterns that could indicate different use of the space and dynamics of raw materials supply over time.
Introduction
In this contribution, we explore methods for performing a fast non-destructive screening on a large dataset of lithics in order to identify classes of raw materials. The protocol is based on the use of Hyperspectral imaging systems to obtain spectral and chemical information that can be used for characterization of raw materials types. This kind of analysis, based on materials’ spectral fingerprints, is carried out by means of multivariate statistical modeling. The approach is outlined to be adopted for diverse typologies of finds by archaeologists with scarce or no knowledge of geology and could be achieved as starting point and preliminary scrutiny before completing an exhaustive study of the material. The novelty of this procedure consists of the possibility of operating a systematized classification of molecular characteristics of rock types based on a quick non-destructive method: hyperspectral images can be collected on the entire dataset, without selecting samples, the extraction of geochemical information is done semi-automatically and the algorithm for classification of stone types is selected considering the variability of the materials themselves. Such a data-driven screening can supply archaeologists with a standardized set of observations on lithics, granting a spectral dataset representative of all the artefacts that can be adopted as unbiased documentation.
Characterization and description of lithic finds generally requires the assistance of specialists, able to determine rock types by time-consuming microscopic observation. Although being widely spread, this approach is prone to subjective bias, particularly when applied on large datasets of items very similar to each other. Information derived from hyperspectral imaging is more standardized and supplies an overall representation of objects’ geochemical composition. This meticulous description of raw materials could also be useful for selecting samples for further examinations. In fact, materials’ provenience information is usually acquired by means of elemental analysis or microscopic petrography which are often expensive and mostly carried out with destructive methods. Researchers must count on a reliable screening and characterization of the materials in order to select the most relevant samples to analyze.
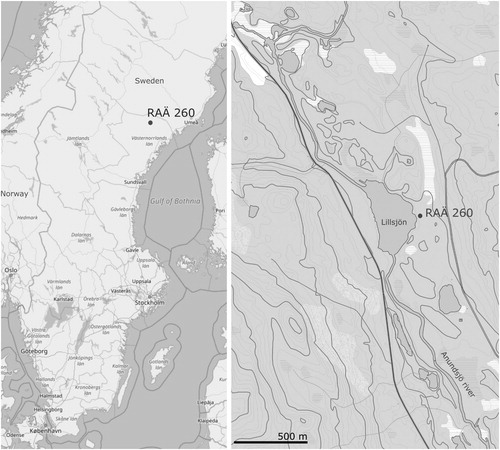
Moreover, hyperspectral imaging-based classification allows recognition of raw materials’ categories; information that can be valuable for understanding materials supply, transmission of knowledge and settlement dynamics. This is argued by the presentation of a case study, a Mesolithic semi-subterranean dwelling situated in Northern Sweden (), where a set of 2612 lithic fragments was gathered during the excavation. The classification was targeted at the differentiation of artefacts made of different types of local materials, quartz and quartzite, to highlight diachronic dynamics of raw material supply on the site. The information collected about different geological types was merged to the spatial distribution of the artefacts, the data obtained was hereafter visualized through the database collecting the excavation data linked to a 3D GIS. The tridimensional platform is used to show a detailed map of raw material clusters, digitally repositioned in the excavated record, displaying a detailed topography of lithic finds.
Figure 1. Location of the site RAÄ 260, a Mesolithic semi-subterranean dwelling in northern Sweden. Map Sweden ©OpenStreeMap, OpenStreetMap contributors (Citation2018); Detail of the lake ©Lantmäteriet.
Raw materials in northern Sweden
The study of raw materials on a site (including their use and distribution) plays a fundamental role in understanding occupation dynamics, representing a proxy to read the links between ancient settlers and available resources in the surrounding territory. Several research projects have pinpointed the importance of provenience studies on a large scale to disclose different levels of knowledge about supply strategies, trades and cultural transmission (Andrefsky, Citation1994; Binford, Citation1979; Ericson & Purdy, Citation1984; Frahm, Citation2014; Malainey, Citation2010; Pereira, Terradas, & Bicho, Citation2017; Price & Burton, Citation2011; Waelkens, Herz, & Moens, Citation1992). The choice of a peculiar stone material is related to technical factors such as the degree of workability and availability in the environment, together with circumstances linked to subsistence like trades, mobility and foraging strategy (Andrefsky, Citation1994; Hertell & Tallavaara, Citation2011; Kuhn, Citation1991). The definition of supply procedures is particularly relevant when studying dynamics of pioneer groups’ settlement in northern Scandinavia, considering the exploitation of geological resources as a significant mean for outlining adaptation of human groups in a new environment. Moreover, preceding research have shown the relationship between the use of raw materials, movements of Scandinavian prehistoric population and the diversification of technologies (Forsberg, Citation1996; Knutsson, Knutsson, Molin, & Zetterlund, Citation2016; Manninen & Knutsson, Citation2014). In the Northern Swedish landscape, dominated by magmatic, metamorphic bedrocks and moraine deposits, low-workability materials like vein quartz and quartzite are largely available, while better quality materials, like flint, are imported from the southern and eastern regions (notably Scania and Karelia; Olofsson & Rodushkin, Citation2011). In northern prehistoric sites, lithics made of local materials are abundant, but the identification of exact supply sources and their geographical distribution is almost impossible due to the high variability of geological formations.
This study aims to demonstrate how geological characterization of raw materials can be a valid support for interpretation of intra-site patterns even when the link to the sources is missing. Combining the complete study of raw materials to the spatial distribution of artefacts and features on a site level, we can disclose information about the lithic practice during a settlement’s life. Geological determination of knapped tools integrated with topographical and chronological information constitutes a multi-layered geography combining objects, materials properties and cultural patterns.
Furthermore, characterization of artefacts and distribution of raw materials facilitates additional investigation in tracing steps of the chaîne opératoire, documenting use wear traces and outlining record’s depositional processes (Gramly, Citation1980; Holdaway, McPherron, & Roth, Citation1996; Kuhn, Citation1991; Straus, Citation1980). In fact, the distinction in geological types assists archaeologists browsing sets of artefacts, making it easier to identify specific items within a reduced cluster and accelerating the typological study. For example, examining geochemical characteristics of big datasets of lithics opens new possibilities for mass analysis of flake debris (Bradbury & Franklin, Citation2000) allowing the focus on the characterization of a large quantity of material instead of a few selected pieces.
Materials and methods
Mesolithic semi-subterranean dwellings in Northern Ångermanland
The site chosen as the case study, Lillsjön (RAÄ 260 in the Swedish Heritage Board classification system), Ångermanland, Sweden, is situated approximately 100 km west of the shoreline of the Bothnian Gulf, along the Solberg/Anundsjö River (). It appears to have been an elliptical dwelling feature characterized by an inner depression of about 7 × 3 m, surrounded by a circular mound 3 m width used as base for an enclosure, probably built of wooden posts.
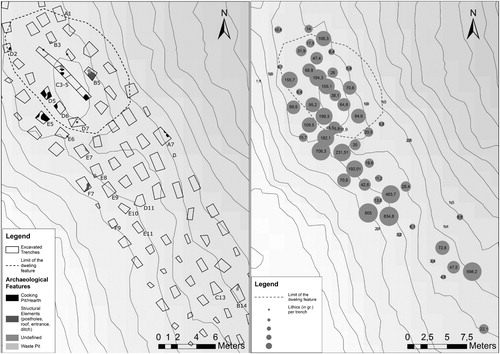
Figure 2. The RAÄ 260 site. On the left, the excavated trenches, the dwelling structure and the features documented during the excavation. On the right, layout of the embankment and total amount of lithic artefacts found in the excavated trenches.
Semi-subterranean houses are a dwelling phenomenon largely investigated in northern Scandinavia (Baudou & Selinge, Citation1977; Bergman, Olofsson, Hörnberg, Zackrisson, & Hellberg, Citation2004; Halén, Citation1994; Lundberg, Citation1997; Olofsson, Citation2003). These features are often visible on the ground and characterized by a circular or elliptical excavated pit encircled by an embankment. Although these features are relatively known in northern Sweden, few extensive excavations have been carried out so the use of space and living dynamics on the site-scale are still partially undefined.
The Mesolithic period of the Ångermanland region is marked by the use of stone tools made mainly from local, poorly workable raw materials such as quartz and quartzite, with slate occurring at a smaller rate (Manninen & Knutsson, Citation2014; Molin, Pettersson, & Wikell, Citation2011; Sørensen et al., Citation2013).
The largest part of the items collected during the excavation were made of raw materials available in the direct surroundings of the dwelling, the site is located on the Bothnia-Skellefteå lithotectonic unit, on bedrock of granitoid and subordinate gabbro. In a 500 m radius from the site, it is possible to find bedrock of metagraywacke, mica schist, graphite – and/or sulphide-bearing schist, paragneiss, migmatite, quartzite, amphibolite; in a 5 km radius granite, pegmatite, granodiorite, syenitoid and quartz monzodiorite (SGU, Sveriges geologiska undersökning, karta 1:50,000). The landscape is dominated by moraines and exposed bedrock and characterized by glacial river deposits (sands and eskers).
In such a scenery, raw materials for tools are locally available. Quartz and quartzite pebbles are easily accessible in moraine deposits whilst bigger crystals and nodules of the same materials can be extracted from exposed metamorphic bedrocks. Flint is not present in this area, nevertheless few artefacts (four) made of this kind of material were found on RAÄ 260. Flint nodules or tools were probably introduced from Scania and Karelia by the settlers and are characteristic of the early phase of Mesolithic settlements in northern Sweden (Forsberg & Knutsson, Citation1999; Olofsson & Rodushkin, Citation2011).
Scandinavian archaeological sites are affected by soil formation processes that alter traces of human activities after deposition, in the Ångermanland region and in many other areas of Northern Sweden, podzols have slowly developed through the Holocene on the archaeological record. In this district sedimentation rate is quite low and erosion uncommon, these conditions favored the preservation of site’s morphology while the acidic soil condition caused the decay of most organic matter (Callum, Citation1995). This surely represents an opportunity for identifying and recording prehistoric sites (still visible on the surface), but is also the cause of alteration of cultural remains as post-depositional processes are transforming the archaeological evidence. Among these transformation is the translocation of Fe and Al oxides, with secondary mineral formations which might interact with lithic materials leaving coating and stains on their surface (Callum, Citation1995; Linderholm, Citation2010).
The site RAÄ 260 was documented for the first time in 2008 and a rescue excavation took place between the years 2010–2012, in order to evaluate the archaeological record after a forest ploughing was conducted in the area and across the site. The action of a traction engine produced regular rectangular cuts, of about 1–2 m2, damaging the upper part of the archaeological layers that occupied the topmost part of the sedimentary sequence. The rescue excavation followed the deterioration, on a sector including the dwelling feature and the immediate surroundings, covering an area of approximately 100 m2 and 77 rectangular trenches. The documentation of the record was carried out on spit levels of 5 cm depth, used as reference units for collecting finds, soil samples and materials for dating.
14C-dated burned bone materials from features indicate that the occupation of the settlement is marked by an early phase and covered a large chronological time span ( and ).
Figure 3. Plot 14C dates, @OxCal v4.3.2.
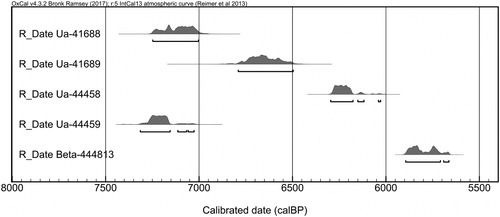
Table 1. 14C dates for the RAÄ 260 site.
An area with a concentration of fire-related features was found to be located within the structure and another one on the surrounding circular embankment (). Several postholes were also documented on the embankment and interpreted as evidence for the wooden structure while outside the dwelling, on the south side, were other features relative to waste management and drainage. During the excavation, a substantial concentration of lithic artefacts was found to be close to these features, while the biggest cluster of lithics was situated in the central part of the site, further south from the outer ring of the embankment (trenches E8, E9, E10, E11, D11 and F9). Another relevant accumulation of materials was in the southern portion of the investigated sector in proximity to the trenches C13 and B14. The clusters may be associated with the activities of tools knapping or dumping waste, which seem to have been well delimited and probably functional to the general organization of the site.
During the excavation, a total of 2612 stone artefacts were collected. From a preliminary typological study on the entire dataset, 39 items were identified as finished or unfinished tools, while the remaining finds are flakes. Among the tools, there are several scrapers made of quartz, as well as bipolar cores and one arrow point; the quartzite tools identified are only two while three scrapers and one bipolar core appear to be made of allochthonous materials, such as flint. The flakes seem to be either quartz or quartzite and the disproportion between finished tools and scrap corresponds to general trends of waste observed in reduction processes of poorly workable materials of quartz lithic industries (Amick & Mauldin, Citation1997; Knutsson, Citation1988).
Hyperspectral imaging and XRF
Hyperspectral imaging is an analytical method based on the acquisition of images in various spectral bands. In a hyperspectral image, each pixel is represented by a whole spectrum, in our case near infrared (NIR). NIR spectroscopy can be used to analyze a large range of organic and inorganic materials. Infrared bands of the electromagnetic spectrum relate to different geologic information: for example iron minerals can be identified in the visible/near infrared (VNIR), the Short Wave Infrared region (SWIR) is marked by spectral features of hydroxyls, carbonates and water molecules, while the long wave (or thermal) infrared region (LWIR) is sensitive to silicates and carbonates (Gupta, Citation2003; Kruse, Citation2012). Near-infrared spectra can be used as fingerprints: a combination of diverse data proxies that are descriptive of the material itself such as color, texture and molecular composition.
Hyperspectral images contain multiple data dimensions: spatial and spectral. The chemical information is combined with spatial data through the creation of imaging hypercubes, in which every pixel has as many dimensions as spectral bands (Grahn & Geladi, Citation2007). The image data matrix can be explored through multivariate statistics, applied in order to identify clusters of pixels with similar chemical signatures. These calculations, generally called Multivariate Image Analysis (MIA), help classifying items according to relevant spectral features.
Hyperspectral imaging in the infrared region of the electromagnetic spectrum is widely applied in geology for mapping mineralogical features and geological formations from satellite images. Hyperspectral imaging has various applications in the mining industry (Greenberger et al., Citation2015; Kruse, Citation2015; Kurz, Buckley, & Howell, Citation2012), and its use in archaeology has proved promising on various scales (Linderholm & Geladi, Citation2012; Linderholm, Pierna, Vincke, Dardenne, & Baeten, Citation2013; Marini, Tomassetti, Piacentini, Campanella, & Flamini, Citation2016).
In a previous paper (Sciuto, Linderholm, & Geladi, Citation2017), it was shown how Near Infrared (NIR) Hyperspectral Imaging can be used to characterize the geochemical signature of lithic artefacts, based on specific spectral features. The preliminary study was conducted on a few artefacts made of quartz, quartzite, flint and slate from the site presented here, RAÄ 260. The same approach was applied to perform a complete screening analysis on the finds from the excavation by means of a SisuChema Pushbroom short wave infrared hyperspectral (HSI) imaging system (wavelengths range 935–2547 nm), which produces images composed of 288 spectral bands for each pixel. The camera is calibrated with a white reference (spectralon) plus a dark reference and diffuse reflectance values are transformed into absorbance. The scanning procedure is fast and does not require any sample preparation; objects are disposed on the conveyor belt and the camera records instant spectral images. This technique allowed us to obtain hyperspectral images of the lithic finds from the excavation, scanned according to the site topography (location/trench number and depth/spit level). The procedure resulted in a series of 311 images capturing the finds, arranged and catalogued by trench/level.
A test set of 55 quartz and quartzite objects was randomly selected to evaluate the dataset and perform additional analysis through Energy dispersive X-ray fluorescence (ED-XRF). The analyses were accomplished with the goal of comparing datasets obtained through Hyperspectral imaging and portable XRF (chosen as a non-destructive method, portable and relatively fast).
X-ray spectra were collected in two randomly sampled spots for each item using a Niton XL3t energy dispersive XRF analyzer (Thermo Scientific Niton, Billerica, MA, USA) positioned on a stationary test stand. The instrument is equipped with a 50 kV X-ray tube, an Ag target and a Si-PIN detector with a resolution of 175 eV at Mn Kα (5.895 keV). Acquisition time was 120 s for all ED-XRF spectra. Each measurement was divided into 40-s intervals where three different filters and X-ray tube settings were used. The light filter mode, designed for measuring light elements (for example Si and P), used no filter and a tube voltage of 6.2 kV. The low and main filter modes used filters with tube voltages of 20 and 40 kV, respectively. ED-XRF spectra were collected in 0.015 keV intervals (bins) from 0 to 60 keV, resulting in a 4000 data point spectrum. The spectral size was then reduced by removing bins with no, or low signals resulting in light, low and main filter sizes of 0–2.8, 2.8–7.0 and 7.0–19.0 keV, respectively. The spectra were then normalized to the X-ray tube current by dividing each spectral value (counts/second) with the corresponding tube current value obtained from the instrument parameter file. The mean value of the double measurements for each sample was calculated and the variables after 22 KeV were removed because of excessive noise.
Data classification
Hyperspectral imaging allows the collection of large datasets, increasing the number of measurements and reducing the sampling bias. Image recording is quite easy, fast and data processing procedures can be automatized to obtain a clean dataset in few steps. Multivariate statistical models are applied to reduce dimensions of information and highlight important patterns without losing in complexity.
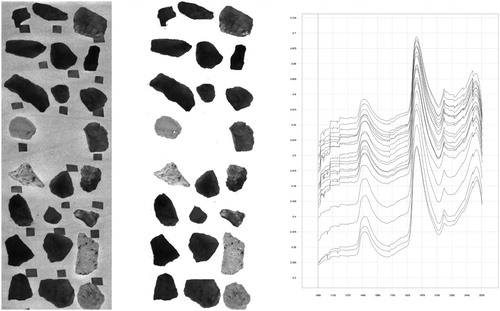
The images obtained with the camera were treated using the software Evince by Prediktera (http://prediktera.se/), which allows spectral analysis and image mapping. Every image constitutes a data matrix that needs to be refined in order to eliminate the noisiest wavelengths and the unimportant data (like the background of the plastic tray the artefacts were placed on). The wavelengths below 1000 nm were removed in order to eliminate noisier parts of the spectrum (for a total of 253 remaining bands for each spectrum); the measurements were treated statistically through mean centering and the Savitsky-Golay algorithm was applied for the reduction of interferences (Rinnan, Van Den Berg, & Engelsen, Citation2009). The wavelengths were then defined as variables to perform a Principal Component Analysis (PCA) on the images, considered as data matrices. Single pixel values were visualized on a scatter plot so the values corresponding to the background could be removed and the images could be reduced to the artefacts only. An algorithm for object identification, based on a threshold of 200 pixels, was applied to automatically identify each stone fragment and calculate single average spectra for every item. All the spectra were exported as single measurement/fingerprints resulting in a dataset in which every artefact was associated with a unique spectral feature obtained from the average of all pixel values on the object surface (the procedure for processing images and obtaining one spectrum for each item is described in ).
Figure 4. Hyperspectral Images processing steps. From the left: image as recorded by the hyperspectral camera, with the items positioned on a conveyor belt; the image cleaned from the background (the conveyor belt and the labels); the spectra averaged for each item (every curve represents one lithic tool in the image).
The complete set of 2612 artefacts was scanned and the image information reduced (through few steps) to a data matrix of 2612 spectral fingerprints. Each spectrum represents one artefact, containing information about particles size and shape, color, and mineralogical composition. The obtained dataset was too large and contained too many variables to be directly classified with unsupervised methods. An additional intermediary step was implemented to evaluate the geological variability of the artefacts and distinguish categories of raw materials on a reduced test set. Fifty-five items were randomly selected and a PCA based classification, often applied to hyperspectral data as an unsupervised method to distinguish clusters on the base of spectral features, was conducted on the selected spectra in order to assign categories to identified clusters () (Chamundeeswari, Singh, & Singh, Citation2009; Deng, Wang, Deng, & Qi, Citation2008; Du & Yang, Citation2008; Eriksson, Byrne, Johansson, Trygg, & Vikström, Citation2013). According to spectral features defining the geologic types, we could distinguish two different types of quartz (Quartz 1, Quartz 2) and two distinct sorts of quartzite (Quartzite 1, Quartzite 2) (). The average spectra plotted for each category show peculiar absorption features associated with the presence of molecular water in the quartz, with co-occurring peaks around 1400 and 1900 nm (Gupta, Citation2003; Hunt, Citation1977), while the presence of iron oxides marked the spectra of quartzite.
Figure 5. PCA based classification of the selected test set analyzed with HSI. On the left, PCA model and clusters assigned to the categories. On the right, average NIR spectra for each category with spectral features that distinguish different raw material types.
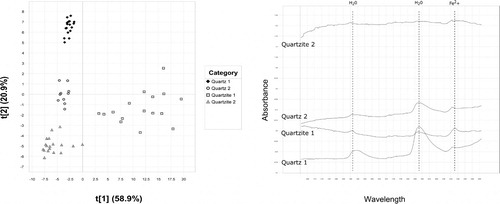
Quartzite is a metamorphic rock originated from a quartz sand deposit and therefore often presents a heterogeneous surface. Quartzite 1 is constituted of a coarse-grained sand that results in a light mottled surface while Quartzite 2 appears fine grained, more uniform and dark in color. The different composition of these two materials is reproduced in the PCA plot: the cluster of Quartzite 1 happens to be much more scattered than the other ones, while the measurements on Quartzite 2 appear to be more consistent. In the case of quartz, all the artefacts analyzed display an inhomogeneous white color with few inclusions. However, Quartz 1 seems to be more opaque and white colored, while Quartz 2 is slightly brighter and gray shaded. In the PCA model, the two quartz clusters seem to be well delimited and tighter than the Quartzite, testifying the more homogeneous composition of the quartz nodules.
The distinction of these types of raw materials would be difficult without any analytical support and would probably result in misclassification of fragments within a large amount of items, especially the small ones. HSI analysis makes the different molecular compositions of the four quartz and quartzite types visible, determining specific spectral features can be used as objective discriminant in a classification procedure.
The items included in the test set were also analyzed using the portable XRF. Measuring procedures were sometimes made more difficult by the dimension and shape of some of the items, sampling spots for recordings were hard to select for smaller artefacts and the irregular surface of the stone probably caused some radiation loss. Due to the sampling strategy adopted and the characteristics of the materials themselves, the dataset shows a very high internal variability. Nevertheless, the measurements highlighted the presence of Iron, Silicon, Potassium and other trace elements like Titanium and Zirconium.
The datasets of measurements acquired with the hyperspectral imaging system and the ED-XRF on the artefacts’ test set were then merged to perform an Orthogonal Partial Least squares model (O2PLS) (Eriksson et al., Citation2013; Trygg, Citation2002). This type of multivariate model is used for data fusion and it is suitable for evaluating the common variation in two orthogonal datasets. Performing the clustering on the base of both variable sets, this kind of model is effective for comparing the trends in data on the same samples but collected with different analytical techniques: if the variation is common, the trends observed in one datasets are confirmed. In our case, this model helped merging datasets collected with different methods and sampling strategies. Infrared spectra record molecular vibrations and are representative of the entire surface of the object while XRF measurements contain information about the elemental composition of the samples and are recorded in two single spots (). XRF data were pre-processed through mean centering and Pareto scaling, in order to reduce the influence of some variables and conserve the data structure.
Figure 6. O2PLS model for NIR and XRF spectra. The multivariate model allows the fusion of the two datasets enhancing grouping patterns of the 55 specimens included in the test set.
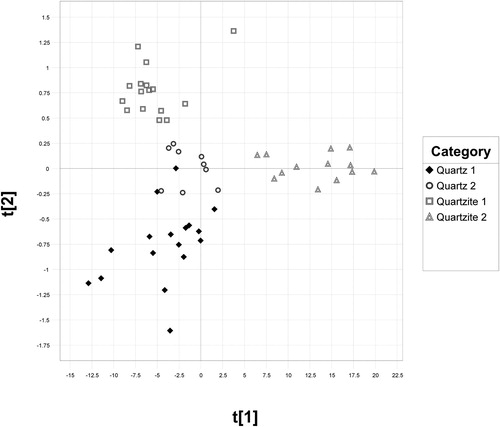
The O2PLS model showed a significant co-variation of the two datasets, demonstrating that the patterns identified in the spectral data were consistent. The categories identified with the PCA-based classification were verified in the orthogonal PLS, calculating the common variation on the entire sets of variables to be above 65%.
The four geological categories identified were used as a reference for prediction using a classification model adapted to handle scattered classes. Considering the high internal variability of the dataset containing the 2612 spectra, the best algorithm was advised to be Soft Independent Modeling of Class Analogy (SIMCA).
SIMCA is a classification model based on PCA and is suitable for distinguishing classes that may overlap, where the number of samples may vary considerably (http://blog.umetrics.com; Eriksson et al., Citation2013). SIMCA is based on disjoint class modeling with calculation of a critical distance (DModX) for each class used as discriminant for predicting unknown observations. A local SIMCA was calculated for each class of the test set predicting the corresponding items in the full dataset. According to the algorithm, predicted items were assigned to one of the four classes of quartz and quartzite, allowing the classification of 1587 artefacts. A PCA model of the dataset and the predicted categories shows the clusters belonging to different types of quartz and quartzite (PCA plot in , model diagnostics in ).
Figure 7. PCA model of the dataset comprehensive of the spectra of the 2612 artefacts. We can distinguish the clusters belonging to the categories predicted with the SIMCA model (t[3] 16.4%).
![Figure 7. PCA model of the dataset comprehensive of the spectra of the 2612 artefacts. We can distinguish the clusters belonging to the categories predicted with the SIMCA model (t[3] 16.4%).](/cms/asset/635fcbe3-2043-4d3b-ac34-9cd6d0d0b24b/ylit_a_1543105_f0007_ob.jpg)
Table 2. SIMCA model diagnostics for the four categories, indicating rate of predicted and unpredicted artefacts.
The rate of unclassified items resulting from the analysis was quite high; this outcome could be modified correcting the value of critical distance in the SIMCA and including more items in the classification but loosing accuracy in the prediction.
Results and discussion
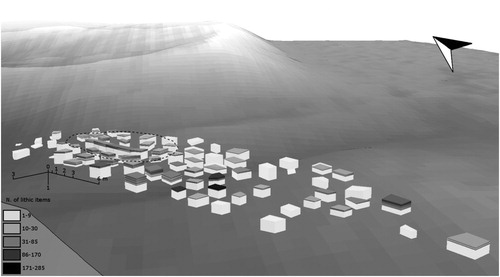
The approach adopted allowed the classification of lithic artefacts in four geological types/categories using a fast procedure for obtaining infrared fingerprint spectra for each item. Subsequent steps for cleaning and processing the information could be batched and partially automatized to obtain a dataset representative of all the finds collected. In order to demonstrate the relevance of lithic classification for the interpretation of intra site patterns, distribution of finds was visualized according to the raw material type. Data from the excavation of the RAÄ 260 site were implemented in a 3D GIS platform and the excavated volume of the trenches was recreated in ArcScene in order to reconstruct, visualize and interpret the archaeological evidence. Lithic finds were linked to the spit layer levels, displaying horizontal and vertical patterns of distribution. The total amount of lithic finds was visualized using gray scale intensity, as shown in , to illustrate the tridimensional patterns of artefacts’ concentration previously described in .
Figure 8. Tridimensional distribution of lithic fragments. The total amount shown in is here visualized according to the depth of the findings.
The same database was adopted for visualizing the distribution of lithics belonging to each of the four classes of lithic materials (). The dispersion of different geological types of quartz and quartzite could be compared to observe clusters of materials and their correlation with archaeological features (for location and type of features documented during the excavation see ).
Figure 9. Distribution of lithic artefacts for each category visualized in a 3D outline of the excavated trenches.
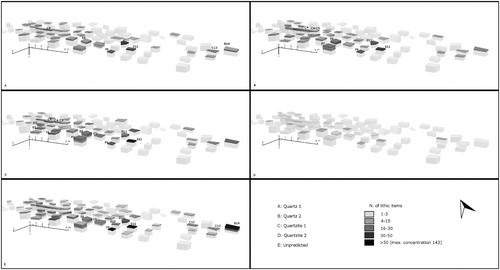
The group of artefacts classified as Quartz 1 was located inside the structure, concentrated in the proximity of the heat-related feature (trench C4), Quartz 1 can be found in deeper levels in the trench E8 (to the depth of 25 cm) and in E9, E10. Quartz 1 is also well represented in the superficial levels of the trenches D11, E11, and F9. Some fragments can be also identified in the southern part of the site in the trenches C13 and B14.
Quartz 2 is preponderant inside the dwelling feature, concentrated in the superficial levels of C4 and C4–C5. Quartz 2 can also be found in the upper levels of D11, E11, F9 and F7 and it is largely represented in the cluster of lithics of trench E8 until 30 cm depth. Lithic fragments belonging to the category of Quartzite 1 were found in correspondence to the heat-related features in the southwest portion of the circular mound surrounding the house (hearts and cooking pits, in the trenches E5 and D5) and inside the dwelling feature itself (trenches C4 and C4–C5). In the central portion of the site this type of quartzite was recorded in superficial levels (0–5 cm depth). Fragments were also found more in depth in the trenches D11, F11, F9 (down to 15 cm) and until a depth of 35 cm in E8.
The distribution trend of Quartzite 2 follows the one of Quartzite 1. Few fragments made of Quartzite 2 were found inside the dwelling feature and southwest sector of the embankment. This raw material type is the least represented on the site and mostly documented in superficial levels.
According to 14C-dated samples (), the lithic materials distinctive of the oldest phase of the settlement seem to be Quartz 2 and Quartzite 1, presenting similar distribution patterns. Substantial clusters of Quartzite 1 and Quartz 2 can be observed in the in the area of the trenches D5, D6 and E5 and in the inner part of the structure, inside the embankment. Southwestern area of the mound seems to be dedicated to fire-related activities marked by the superposition of several features over a long time span, up until abandonment of the dwelling. Lithics associated to the later phase of occupation belong to the raw materials types of Quartzite 1 and Quartz 2.
The distribution of raw materials, visualized through the 3D GIS, shows a consistent use of quartz and quartzite through the life of the site but while the early phase of the settlement is characterized by the presence of lithic tools made of bright gray-shaded quartz and light colored coarse-grained quartzite the later phase is marked by white opaque quartz and dark fine-grained quartzite.
The ratio of quartz and quartzite is more even in the early phase while quartzite is scarce in the later period. This trend reflects the general observations of use of raw materials in Mesolithic sites in Northern Sweden conducted by Forsberg and Knutsson (Citation1999; Forsberg, Citation1997) on 40 sites in Northern Sweden with a chronology ranging from 7600 to 4500 BC. From these studies, it emerges that the early Mesolithic is marked by and even distribution of quartz and quartzite and presence of “exotic” materials, while the middle phase is characterized by a predominance of quartzite and quartz is the prevailing raw material used during the late Mesolithic.
A specific discussion is reserved to unclassified fragments: the lithics presenting spectral characteristics that cannot be clearly assimilated to any category. A rather high value of unclassified items resulted from the statistical procedure and should be accounted to demonstrate the uncertainty that comes with classification of lithic finds, which are inhomogeneous by definition. A number of geological processes can modify an artefact’s surface, this must be taken into account when classifying raw materials with visual or analytical methods.
Fragments belonging to the same raw material category can, in some parts, present inclusions or alterations that are part of the geological formation, furthermore, weathering and secondary mineral formations in soil might alter the surface composition. In this case, quartz and quartzite nodules have probably been collected from moraine deposits or exposed bedrocks and carried surface alteration due to the long exposition to atmospheric agents. Additionally, podzol formation might have affected some artefacts’ surface and resulted in specific features in their spectral signatures.
Unclassified items are spread through all the raw materials types and most likely express the distribution of surface alteration occurring on the artefacts. Looking at the PCA model of the entire dataset represented in , it is possible to observe that the unclassified items are spread all over the multivariate space. As shown in , the unpredicted finds are spread evenly over the site, following the general trends () except a cluster in the southern area located in the trenches B14, C13 and C12.
Conclusions
This study shows how a systematic classification of raw materials in a large dataset of lithic artefacts could be accomplished using HSI. This remote sensing method is reliable for performing a screening of stone artefacts and distinguish materials on the base of their absorption bands.
The protocol for acquiring and processing geochemical data is quite fast and can be applied to other case studies. Spectra in the near infrared region represent fingerprints that can be analyzed and correlated at different scales: object or pixel level (Van Der Meer, Citation2006). Compared to elemental or petrographic analysis, more accurate but often expensive and time-consuming, near-infrared imaging systems can be used extensively as a screening method providing a detailed overview of the physical-chemical composition of the materials. Multivariate statistics and chemometrics, such as data mining methods, are applied for classification and prediction of items according to particular features of known minerals. This approach allows the sorting and quantifying of materials with a good level of accuracy, nevertheless, the study highlighted interesting aspects of the relation between materials and site formation processes, certainly suggestions for additional research. The association of classified items and their spatial distribution supported the interpretation of site occupation dynamics illustrating a diachronic trend in the use of raw materials. The concentration of a certain type of quartz or quartzite could be linked to different supply strategies or transformations in the custom of Mesolithic Scandinavian settlers. Only the acquisition of systematic information about usage of raw materials in Mesolithic dwellings will help understanding large-scale dynamics of adaptation to natural resources available in the northern regions. The same approach can be adopted in different case studies with the aim of describing the intricate relationship between ancient societies and geologic deposits.
Acknowledgements
Thanks to the Marcus and Amalia Wallenberg foundation for financially supporting this project. Map data copyrighted OpenStreetMap contributors, available from https://www.openstreetmap.org. Thanks to the anonymous reviewers for their valuable comments that helped us to improve this article.
Disclosure statement
No potential conflict of interest was reported by the authors.
Notes on contributors
Claudia Sciuto is a PhD candidate working on NIR imaging applications for the study of stones artefacts and building materials in archaeology. Her interest relies in provenance studies of stone artefacts as proxies for past trade networks, economical systems and development of societies in their environment.
Paul Geladi has a PhD in Analytical Chemistry of the University of Antwerp. He is Emeritus Professor of Chemometrics at the Swedish University of Agricultural Sciences, Forestry Faculty. His main topics of research and teaching are experimental design, multivariate data analysis, near-infrared spectroscopy and hyperspectral image analysis. He has co-authored three books, one on multiway analysis and two on hyperspectral image analysis and written a number of highly cited papers.
Lorenza La Rosa is a PhD candidate studying the production of pottery terra sigillata italica and tardo italica in the area of Pisa (Tuscany, Italy) as case study to assess the environmental impact of large-scale manufactures during the Roman Times. She works on the production cycle together with environmental analysis, combining the study of ancient sources and materials, with archaeobotanic, palinological and archaeometrical analyses. During the study presented in this paper, she developed the 3D GIS Database.
Johan Linderholm has a background in Archaeology and Chemistry and a PhD in Archaeology with specialization in Environmental Archaeology from Umeå University. He has been working at the Environmental Archaeology Laboratory as of the early 1990ies, both with research and contract archaeology consultancy. His main interests in Archaeology lie in soils and sediments and how we can make use of these as sources of information for understanding spatial and temporal dimensions of human behavior.
Mikael Thyrel received his PhD in biomass technology at the Swedish University of Agricultural Sciences in Umeå working with fast spectroscopic techniques for measuring organic and inorganic components in primarily biobased materials. His main research interest lies in using fast characterization methods, primarily spectroscopy combined with multivariate statistics, for measuring valuable components and fingerprinting materials for tailoring industrial processes. He also has extensive experience in using synchrotron-based X-ray techniques for more fundamental research.
ORCID
C. Sciuto http://orcid.org/0000-0003-0880-644X
References
- Amick, D. S., & Mauldin, R. P. (1997). Effects of raw material on flake breakage patterns. Lithic Technology, 22(1), 18–32. doi: 10.1080/01977261.1997.11754531
- Andrefsky, W. (1994). Raw-material availability and the organization of technology. American Antiquity, 59(1), 21–34. doi: 10.2307/3085499
- Baudou, E., & Selinge, K. G. (1977). Västernorrlands förhistoria. Västernorrlands läns landsting.
- Bergman, I., Olofsson, A., Hörnberg, G., Zackrisson, O., & Hellberg, E. (2004). Deglaciation and colonization: Pioneer settlements in northern Fennoscandia. Journal of World Prehistory, 18(2), 155–177. doi: 10.1007/s10963-004-2880-z
- Binford, L. R. (1979). Organization and formation processes: Looking at curated technologies. Journal of Anthropological Research, 35(3), 255–273. doi: 10.1086/jar.35.3.3629902
- Bradbury, A. P., & Franklin, J. D. (2000). Raw material variability, package size, and mass analysis. Lithic Technology, 25(1), 42–58. doi: 10.1080/01977261.2000.11720960
- Callum, K. E. (1995). Archaeology in a region of Spodosols, Part 2. In Pedological Perspectives in Archaeological Research (Vol. 44, pp. 81–94). SSSA Special Publication.
- Chamundeeswari, V. V., Singh, D., & Singh, K. (2009). An analysis of texture measures in PCA-based unsupervised classification of SAR images. IEEE Geoscience and Remote Sensing Letters, 6(2), 214–218. doi: 10.1109/LGRS.2008.2009954
- Deng, J. S., Wang, K., Deng, Y. H., & Qi, G. J. (2008). Pca-based land-use change detection and analysis using multitemporal and multisensor satellite data. International Journal of Remote Sensing, 29(August), 4823–4838. doi: 10.1080/01431160801950162
- Du, Q., & Yang, H. (2008). Similarity-Based unsupervised band selection for hyperspectral image analysis. IEEE Geoscience and Remote Sensing Letters, 5(4), 564–568. doi: 10.1109/LGRS.2008.2000619
- Ericson, J. E., & Purdy, B. A. (1984). Prehistoric quarries and lithic production. Cambridge, UK: Cambridge University Press.
- Eriksson, L., Byrne, T., Johansson, E., Trygg, J., & Vikström, C. (2013). Multi-and megavariate data analysis basic principles and applications. Malmö: Umetrics Academy.
- Forsberg, L. (1996). The earliest settlement of northern Sweden: Problems and perspectives. Acta Archaeologica Lundensia. Series in, 8(24), 241–250.
- Forsberg, L. (1997). Site variability and settlement patterns: An analysis of the hunter-gatherer settlement system in the Lule River Valley, 1500 BC-BC/AD. Umeå: Umeå University.
- Forsberg, L., & Knutsson, K. (1999). Converging conclusions from different archaeological perspectives. The Early Settlement of Northern Sweden. In Proceedings of the fifth Mesolithic conference in Grenoble.
- Frahm, E. (2014). Characterizing obsidian sources with portable XRF: Accuracy, reproducibility, and field relationships in a case study from Armenia. Journal of Archaeological Science, 49, 105–125. doi: 10.1016/j.jas.2014.05.003
- Grahn, H., & Geladi, P. (eds.). (2007). Techniques and applications of hyperspectral image analysis. Chichester: Wiley.
- Gramly, R. M. (1980). Raw materials source areas and “curated” tool assemblages. American Antiquity, 45(4), 823–833. doi: 10.2307/280152
- Greenberger, R. N., Mustard, J. F., Ehlmann, B. L., Blaney, D. L., Cloutis, E. A., Wilson, J. H., … Fraeman, A. A. (2015). Imaging spectroscopy of geological samples and outcrops: Novel insights from microns to meters. GSA Today, 25(12), 4–10. doi: 10.1130/GSATG252A.1
- Gupta, R. P. (2003). Remote sensing geology (2nd ed.). Berlin: Springer Science & Business Media.
- Halén, O. (1994). Sedentariness during the stone age of northern Sweden. Acta Archaeologica Lundensia, 20, 1–163.
- Hertell, E., & Tallavaara, M. (2011). Hunter–gatherer mobility and the organisation of core technology in the Mesolithic North-Eastern Europe. Tuija Rankama (ed.) Mesolithic Interfaces. Variability in Lithic Technologies in Eastern Fennoscandia. Monographs of the Archaeological Society of Finland, 1, 94–111.
- Holdaway, S., McPherron, S., & Roth, B. (1996). Notched tool reuse and raw material availability in French Middle Paleolithic sites. American Antiquity, 61, 377–387. doi: 10.2307/282432
- Hunt, G. R. (1977). Spectral signatures of particulate minerals in the visible and near infrared. Geophysics, 42(3), 501–513. doi: 10.1190/1.1440721
- Knutsson, K. (1988). Patterns of tool use: Scanning electron microscopy of experimental quartz tools. Uppsala: Societas Archaeologica Upsaliensis.
- Knutsson, H., Knutsson, K., Molin, F., & Zetterlund, P. (2016). From flint to quartz: Organization of lithic technology in relation to raw material availability during the pioneer process of Scandinavia. Quaternary International, 424, 32–57. doi: 10.1016/j.quaint.2015.10.062
- Kruse, F. A. (2012). Mapping surface mineralogy using imaging spectrometry. Geomorphology, 137(1), 41–56. doi: 10.1016/j.geomorph.2010.09.032
- Kruse, F. A. (2015). Integrated visible and near-infrared, shortwave infrared, and longwave infrared full-range hyperspectral data analysis for geologic mapping. Journal of Applied Remote Sensing, 9(1), 096005. doi: 10.1117/1.JRS.9.096005
- Kuhn, S. L. (1991). “Unpacking” reduction: Lithic raw material economy in the Mousterian of west-central Italy. Journal of Anthropological Archaeology, 10(1), 76–106. doi: 10.1016/0278-4165(91)90022-P
- Kurz, T. H., Buckley, S. J., & Howell, J. A. (2012). Close range hyperspectral imaging integrated with terrestrial LiDAR scanning applied to rock characterization at centimeter scale. ISPRS – International Archives of the Photogrammetry, Remote Sensing and Spatial Information Sciences, XXXIX-B5(5), 417–422. doi: 10.5194/isprsarchives-XXXIX-B5-417-2012
- Linderholm, J. (2010). The soil as a source material in archaeology: Theoretical considerations and pragmatic applications (Doctoral thesis). Umeå University, Department of Historical, Philosophical and Religious Studies, Umeå.
- Linderholm, J., & Geladi, P. (2012). Classification of archaeological soil and sediment samples using near infrared techniques. NIR News, 23(7), 6–9. doi: 10.1255/nirn.1329
- Linderholm, J., Pierna, J. A. F., Vincke, D., Dardenne, P., & Baeten, V. (2013). Identification of fragmented bones and their state of preservation using near infrared hyperspectral image analysis. Journal of Near Infrared Spectroscopy, 21(6), 459–466. doi: 10.1255/jnirs.1082
- Lundberg, Å. (1997). Vinterbyar: ett bandsamhälles territorier i Norrlands inland, 4500-2500 f. Kr (Doctoral dissertation). Umeå universitet, Umeå.
- Malainey, M. E. (2010). A consumer’s guide to archaeological science: Analytical techniques. New York: Springer Science & Business Media.
- Manninen, M. A., & Knutsson, K. (2014). Lithic raw material diversification as an adaptive strategy – technology, mobility, and site structure in late Mesolithic northernmost Europe. Journal of Anthropological Archaeology, 33, 84–98. doi: 10.1016/j.jaa.2013.12.001
- Marini, F., Tomassetti, M., Piacentini, M., Campanella, L., & Flamini, P. (2016). Application of near infrared spectroscopy (NIR), X-ray fluorescence (XRF) and chemometrics to the differentiation of marmora samples from the Mediterranean basin. Natural Product Research, 7, 1–9. doi: 10.1080/14786419.2016.1190717
- Molin, F., Pettersson, M., & Wikell, R. (2011). Mesolithic quartz knapping in eastern middle Sweden. Lithic Technology, 36(2), 153–164. doi: 10.1179/lit.2011.36.2.153
- Olofsson, A. (2003). Pioneer settlement in the Mesolithic of northern Sweden (Doctoral dissertation). Retrieved from www.diva-portal.org.
- Olofsson, A., & Rodushkin, I. (2011). Provenancing flint artefacts with ICP–MS using REE signatures and Pb isotopes as discriminants: Preliminary results of a case study from northern Sweden. Archaeometry, 53(6), 1142–1170. doi: 10.1111/j.1475-4754.2011.00605.x
- OpenStreetMap contributors. (2018). Planet dump [Data file from https://planet.osm.org/]. Retrieved from https://planet.openstreetmap.org.
- Pereira, T., Terradas, X., & Bicho, N.2017). The exploitation of raw materials in prehistory: Sourcing, processing and distribution. Newcastle: Cambridge Scholars Publishing.
- Price, T. D., & Burton, J. H. (2011). An introduction to archaeological chemistry. New York, NY: Springer.
- Reimer, P. J., Bard, E., Bayliss, A., Beck, J. W., Blackwell, P. G., Ramsey, C. B., … Friedrich, M. (2013). Intcal13 and Marine13 radiocarbon age calibration curves 0–50,000 years Cal BP. Radiocarbon, 55(4), 1869–1887. doi: 10.2458/azu_js_rc.55.16947
- Rinnan, Å, Van Den Berg, F., & Engelsen, S. B. (2009). Review of the most common pre-processing techniques for near-infrared spectra. TrAC Trends in Analytical Chemistry, 28(10), 1201–1222. doi: 10.1016/j.trac.2009.07.007
- Sciuto, C., Linderholm, J., & Geladi, P. (2017). Near infrared imaging spectroscopy for Raw materials characterization: The example of a Mesolithic dwelling site in northern Sweden. In T. Pereira, X. Terradas, & N. Bicho (Eds.), The exploitation of Raw materials in prehistory: Sourcing, processing and distribution (pp. 113–120). Newcastle: Cambridge Scholars Publishing.
- Sørensen, M., Rankama, T., Kankaanpää, J., Knutsson, K., Knutsson, H., Melvold, S., & Glørstad, H. (2013). The first eastern migrations of people and knowledge into Scandinavia: Evidence from studies of Mesolithic technology, 9th–8th millennium BC. Norwegian Archaeological Review, 46(1), 19–56. doi: 10.1080/00293652.2013.770416
- Straus, L. G. (1980). The role of raw materials in lithic assemblage variability. Lithic Technology, 9(3), 68–72. doi: 10.1080/01977261.1980.11754476
- Trygg, J. (2002). O2-PLS for qualitative and quantitative analysis in multivariate calibration. Journal of Chemometrics, 16(6), 283–293. doi.org/10.1002/cem.724
- Van Der Meer, F. (2006). The effectiveness of spectral similarity measures for the analysis of hyperspectral imagery. International Journal of Applied Earth Observation and Geoinformation, 8(1), 3–17. doi: 10.1016/j.jag.2005.06.001
- Waelkens, M., Herz, N., & Moens, L. (eds.). (1992). Ancient stones: Quarrying, trade and provenance: Interdisciplinary studies on stones and stone technology in Europe and near east from the prehistoric to the early Christian period (No. 4). Leuven: Leuven University Press.