
 ?Mathematical formulae have been encoded as MathML and are displayed in this HTML version using MathJax in order to improve their display. Uncheck the box to turn MathJax off. This feature requires Javascript. Click on a formula to zoom.
ABSTRACT
This paper aims to investigate the possible explanatory effect of geopolitical risks on the oil price changes from February 1986 to December 2019 by employing the nonlinear bivariate Granger causality test and frequency domain Granger causality test based on the geopolitical risk index. The results suggest that there exists a nonlinear causality from geopolitical risks to crude oil prices. Moreover, geopolitical risks have a short-term impact on oil prices, less than 12 months. Actual geopolitical events have a smaller and less lasting impact on oil prices than pure geopolitical risks.
1. Introduction
Due to its financial and political characteristics, crude oil is viewed as a strategic resource with tight ties to daily life, the economy, and national security, and its price and output play a significant role in the global economy (Su et al., Citation2021; Sweidan, Citation2021). Therefore, it has been a popular subject of research for so many years (Cunado et al., Citation2020). As an internationally traded commodity, crude oil is comparable to other commodities whose prices are affected by supply-side and demand-side factors (Kilian & Park, Citation2009; Kilian, Citation2009). According to British Petroleum (B.P.) data, crude oil accounted for one-third of the world’s energy consumption in 2016. Understanding the causes of oil price fluctuations is crucial, as the price of oil has a significant impact on economic output (Hamilton, Citation1996), inflation (Chen, Citation2009; Darby, Citation1982), stock markets (Kilian, Citation2009; Narayan & Narayan, Citation2010; Park & Ratti, Citation2008; Wen et al., Citation2019), exchange rate markets (Basher et al., Citation2016; Mensi et al., Citation2017), money market (Su et al., Citation2021), industrial production fluctuation (Kisswani, Citation2021) and fundamental industries (Jiao et al., Citation2012; Li et al., Citation2017). In addition, non-fundamental factors such as economic policy uncertainty, market speculation, investor interest, and political risk tend to have a significant impact on the crude oil price (He et al., Citation2019; Narayan et al., Citation2017; Yao et al., Citation2017; Zhang, Citation2013). Consequently, ensuring the availability of oil in the arteries of industrialised nations has become a crucial concern (Sweidan, Citation2021). In recent years, however, due to its financial and political characteristics (Su et al., Citation2021), the Geopolitical Risk Index (GPR) is frequently cited as the deciding factor in investment decisions by commercial investors, financial journalists, and central bank governors (Caldara & Iacoviello, Citation2019). In addition to economic and policy uncertainty, GPR is also a form of uncertainty (Gkillas et al., Citation2022; Olanipekun & Alola, Citation2020). Consequently, the relationship between oil and GPR has attracted the attention of numerous researchers from the perspective of international space and national political patterns.
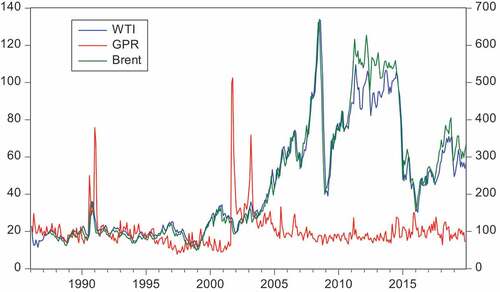
Huge fluctuations in crude oil prices have been correlated with a shifting and unpredictable worldwide landscape, which has been marked by significant geopolitical events. The oil market is closely related to the global political landscape, particularly when dealing with the evolving GPR; oil exporting countries will also be constrained by investment options and should consider taking some reflective measures (Olanipekun & Alola, Citation2020); and the relationship between the two affects national interests and global development (Su et al., Citation2021). Due to the scarcity of oil and spatial heterogeneity, a number of conflicts and wars broke out, including the Libyan War (Ji & Guo, Citation2015), the Gulf War, and the Gulf War (Lieber, Citation1992). These conflicts have had a substantial effect on oil prices. The escalation of geopolitical and economic tensions is currently the greatest worldwide threat (Selmi et al., Citation2020). As the proxy of geopolitical risk, shows the GPR index surges around major events like the Gulf War, 9/11, the 2003 Iraq invasion, the Arab Spring, the Russia-Ukraine crisis of 2014, and the Paris terrorist attacks of 2015. The emergence of GPR effectively characterises geopolitical risks (Alqahtani & Klein, Citation2021; Smales, Citation2021). During periods of high geopolitical risk, the corresponding international crude oil prices have risen or declined substantially; namely, geopolitical risks are connected with the price of crude oil (see ). Specifically, we estimate the Spearman rank correlation coefficient between the GPR index and Brent oil price is 0.215, demonstrating a statistically significant association between geopolitical risk and international crude oil. For instance, in April 1986, after a U.S. air assault in Libya, the price of oil dropped significantly. After the 2015 terrorist events in Paris, the oil price also dropped significantly. Particularly, isolationist and protectionist beliefs and behaviours in some nations have resulted in penalties and damage to numerous economies (such as U.S. sanctions against Venezuela and Iran) and have even impeded the trend of globalisation (Selmi et al., Citation2020). All of these events contributed to a period of unstable crude oil prices, which continue to undermine the economic stability of oil-producing and oil-consuming countries. How do geopolitical threats affect oil prices under these conditions, and how long do these effects last? Answering these questions is crucial for risk management, hedging, and investment decision-making.
Figure 1. The benchmark GPR index and the real WTI and Brent oil price changes (1986:01-2019:12).
In light of the dominance of GPR in significant global risk shocks and the significance of oil as an asset, recent research has begun to examine the relationship between the two (Gkillas et al., Citation2022; Salisu et al., Citation2021; Wang et al., Citation2021). However, the literature that emphasises the impact of GPR on the analysis of dynamic changes in oil prices is scarce at this time (Alqahtani & Klein, Citation2021; Bouoiyour et al., Citation2019), especially GPR may have a huge global impact on investor sentiment and energy and financial markets (Selmi et al., Citation2020); At the same time, the existing research on the relationship between GPR and oil price fluctuations yields a mixed result (Gkillas et al., Citation2022).
To achieve this, this study uses the GPR index developed by Caldara and Iacoviello (Citation2017) as a proxy for geopolitical risk. On the basis of this information, both nonlinear causality tests and a Granger causality test in the frequency domain were conducted to determine whether geopolitical risks have a substantial predictive effect on the movement of real crude oil prices. We find that geopolitical risks have a solid nonlinear predictive effect on oil prices, but this effect is only relevant over the short run. In addition, pure geopolitical risks, such as nuclear tensions, war threats, and terrorist threats, have a greater and longer-lasting impact on oil prices than actual bad geopolitical events.
The following are the key contributions of this paper: First, this study employs nonlinear Granger causality tests to assess the existence of a nonlinear causal link between global geopolitical risks and oil prices, indicating that big political events have had a strong nonlinear effect on oil price fluctuations. This is the first study to explore nonlinearities in the relationship between global geopolitical risks and oil prices, as far as we know. Second, using the Granger causality test in the frequency domain, this study examines whether the explanatory role of geopolitical risks on oil prices differs under different time-frequency conditions (such as in the short or long term). The weighted sum of sinusoidal components can describe a stationary process with a specific frequency. Instead of calculating a single Granger causality measure for the entire relationship, the frequency domain Granger causality test model calculates the Granger causality of each frequency component separately. This makes it possible to determine whether the predictive effect of geopolitical risks is short- or long-term. Third, we distinguish the effect of real geopolitical events from pure geopolitical risks on changes in oil prices. By adopting the GPR estimated by Caldara and Iacoviello (Citation2017), in contrast to existing literature such as Caldara and Iacoviello (Citation2017), whose focus on the difference of impact magnitude between GPT (pure geopolitical risks) and GPA (actual geopolitical events) on the real activity, we discover that GPT has a higher and more permanent impact on oil prices than GPA.
The remaining sections of the paper are structured as follows: Section 2 briefly reviews the relevant studies in the existing literature. Section 3 presents the data and the methodology. Section 4 contains the empirical results. In Section 5, the conclusion and policy recommendations are provided.
2. Relevant literature review
In recent decades, numerous scholars have conducted extensive research on the causes of oil price fluctuations (Chu et al., Citation2022; Ngoma, Citation2022). Due to the importance of oil prices to the financial system (Hamilton, Citation1996), some studies have conducted extensive research on the relationship between macroeconomic variables and oil prices (Lee et al., Citation2021), the most prominent of which is an investigation into the relationship between the stock market and oil price (Alamgir & Amin, Citation2021; Apergis & Miller, Citation2009; Bashir, Citation2022; Dutta, Citation2017; Fasanya et al., Citation2021; Hwang & Kim, Citation2021; Tian et al., Citation2021). For example, using smooth transition vector autoregression, Hwang and Kim (Citation2021) examined the response of U.S. stock market returns to oil price shocks and the degree of asymmetry in their performance at different periods of the business cycle. The findings indicate that the response of U.S. stock returns to categorisation shocks is uneven over the whole business cycle, but the impact of demand-driven shocks on U.S. stock returns is stronger and more enduring. In recent years, several researchers have also begun to focus on the correlation between oil prices and bond yields, which represents a significant new development (Azhgaliyeva et al., Citation2021; Chen et al., Citation2022; Demirer et al., Citation2019; Kang et al., Citation2014; Lee et al., Citation2021, Citation2022; Morrison, Citation2019; Su et al., Citation2022; Tule et al., Citation2017). For instance, Morrison (Citation2019) examined the impact of oil price innovations on emerging market sovereign total bond returns and confirmed that oil prices have a statistically significant impact on the total sovereign bond returns of investment portfolios of key oil exporting and importing nations around the globe. Through the structural vector autoregression method, Lee et al. (Citation2022) examined the link between oil shocks, geopolitical uncertainty, and green bond returns. The results indicate that specific oil demand has a substantial effect on geopolitical risks and the dynamics of green bonds, and that positive changes in geopolitical risks are accompanied by a fall in oil prices and an increase in the return on green bonds. Geopolitical behaviour has a negative effect on oil prices, whereas geopolitical threats have a substantial positive impact on the return on green bonds.
Since the onset of the COVID-19 pandemic, oil prices have generally decreased and uncertainty has increased. Several studies have begun investigating the relationship between COVID-19 and oil prices to inform macroeconomic policymaking (Khalfaoui et al., Citation2022). In the past two years, research on the impact of COVID-19 on oil prices has become an active subject of study (e.g. Benlagha & El Omari, Citation2022; Bourghelle et al., Citation2021; Gil-Alana & Monge, Citation2020; Jia et al., Citation2021; Khalfaoui et al., Citation2022; Ren et al., Citation2021; Sharif et al., Citation2020). Using the coherence wavelet method and the wavelet-based Granger causality tests, Sharif et al. (Citation2020) analysed the correlation between the recent spread of COVID-19 in the United States, the impact of oil price fluctuations, the stock market, geopolitical risks, and the uncertainty of U.S. economic policy within the time-frequency framework. The findings indicate that the effect of COVID-19 on geopolitical risk is significantly greater than its effect on economic uncertainty in the United States.
In light of the substantial impact of GPR on the global economy (Antonakakis et al., Citation2017) and the significance of the oil price market (Selmi et al., Citation2020), many recent studies are analysed in terms of the relationship between GPRs and oil prices (Dey et al., Citation2020; Ivanovski & Hailemariam, Citation2022; Li et al., Citation2020; Qian et al., Citation2022; Su et al., Citation2021). Using the autoregressive Markov region switching model, Qian et al. (Citation2022) studied the predictability of GPR to the volatility of the oil market and confirmed that GPR could lead to high volatility of the oil market, GPR has useful information to predict the volatility of the oil market, and GPR is effective in the long-term prediction range. In recent years, it has been prevalent to utilise dummy variables in econometric models to examine the impact of GPRs on oil prices (Ewing & Malik, Citation2017; Lee et al., Citation2010). For example, Ewing and Malik (Citation2017) employed the GARCH model with dummy variables to estimate breakpoints and found that bad and good news affect the volatility of crude oil prices. Others have suggested time-frequency decomposition methods (Martina et al., Citation2011; Zhang et al., Citation2008, Citation2009), such as wavelet decomposition and Empirical Mode Decomposition (EMD). For instance, Using the EMD model, Zhang et al. (Citation2009) assessed the effect of political events on crude oil price volatility and found that severe events had a considerable impact on oil price fluctuations. Early research often focused on the fluctuations in crude oil prices preceding and following important political events (Kesicki, Citation2010; Monge et al., Citation2017). However, the time-frequency decomposition method depends primarily on oil price data and cannot properly quantify the effect of political risk variables on crude oil prices (Chen et al., Citation2016). Therefore, some scholars propose the use of multi-dimensional variables to construct a comprehensive index to reflect the effect of political risk on oil price changes. Hammoudeh et al. (Citation2013) built an index system that incorporated risk ratings, stock market data, and crude oil prices to explore the nexus in BRICS countries, arguing that the oil price is more sensitive to economic than financial risk. Chen et al. (Citation2016) and Lee et al. (Citation2017) estimated the impact of political risk on oil price fluctuations using the International Country Risk Guide (ICRG) index as a proxy for political risk. Noting that the ICRG index is restricted to regional or individual countries, it cannot be utilised to distinguish between the direct effect of actual global geopolitical events and global pure geopolitical risks on oil prices.
Although a wealth of evidence addresses the relationship between political issues and oil prices, major study routes have not yet been investigated under the empirical framework. First, the existing literature concentrates on political risk in specific regions rather than global geopolitical risks, but the risk created by political events, particularly threats that have not yet materialised, may have a different effect on crude oil prices. Second, early empirical research is founded on the premise of linearity and frequently employs linear models. However, economic events and regime change could result in structural modifications to the pattern of oil prices and the relationship between geopolitical risks and oil prices (Lee et al., Citation2010; Noguera, Citation2013). Moreover, the political risk may have a nonlinear effect on oil prices, and investment returns based on a nonlinear relationship are likely to be higher. Third, if causation is restricted to a single data frequency, it is impossible to evaluate long-term components (low frequencies) and short-term components (high frequencies) independently (Lemmens et al., Citation2008). Therefore, it is impossible to determine if the explanatory effect of geopolitical risks on oil prices has a short-term or long-term time horizon. It is usually assumed that high-frequency components are more susceptible to structural break and nonlinear forces, indicating that the conventional linear model is inadequate (Geng et al., Citation2017). Therefore, investors must alter their investment plan by elucidating the time horizon of geopolitical risks’ impact on the price of crude oil.
To circumvent the limitations above, we employ the GPR as a proxy for geopolitical risk in our models, which has proven to be an accurate representation of global geopolitical risk with strong explanatory power in terms of economic output and stock market outcomes (Apergis et al., Citation2017). By generating two indices, the index may distinguish between the direct effect of adverse geopolitical events and the effect of pure geopolitical risks. In particular, Geopolitical Acts (GPA) and Geopolitical Threats (GPT) are GPR components that can be used to isolate the influence of pure geopolitical risks (Caldara & Iacoviello, Citation2018; Dissanayakea et al., Citation2018; Qian et al., Citation2022). GPA refers to the occurrence of adverse geopolitical events, such as the Paris bombing attack in November 2015 and the start of the Iraq war in 2003, which is constructed by the groups directly mentioning adverse events, capturing the beginning and actual unfolding of the war and other events; GPT is constructed by the groups directly mentioning risks, focusing on capturing various GPT, such as nuclear threats, war threats, and terrorist threats, ref. Moreover, the two indices are highly interdependent and correlated (Caldara, Iacoviello, Citation2022; Caldara, Conlisk, Citation2022; Gong & Xu, Citation2022). Therefore, GPT captures the potential for geopolitical action, whereas GPA represents the existing state of geopolitical events, and the influence of GPA has a smaller effect on actual activities than the impact of GPT (Baur & Smales, Citation2018; Gu et al., Citation2021). In terms of the energy price study, Gu et al. (Citation2021) found that GPA and GPT shocks have differing effects on the oil market, although both have a smaller influence on the oil market than the EPU shock. In addition, Qian et al. (Citation2022) discovered that GPT is more useful than GPA for predicting oil. Neither GPT nor GPA can fully represent swings in oil prices during expansion, and GPT improves more than GPA during the recession.
In contrast, Mei et al. (Citation2020) revealed that GPA contributes more to long-term oil output forecasting than GPT. In addition, Liu et al. (Citation2021) discovered that, in contrast to the negligible effect of GPA on energy fluctuations, GPT actively encourages energy fluctuations; that is, the effect of GPR on energy fluctuations is more likely to be conveyed via GPT. In terms of commodity market study, Gong and Xu (Citation2022) demonstrated that GPA reveals more than GPT the influence of GPR on the connectivity effects between commodity markets. In addition, Yang et al. (Citation2022) discovered that GPT and GPA had positive and negative effects on the global commodity market, time variability and substantial short-term effects. In terms of digital currency price research, Colon et al. (Citation2021) discovered that the cryptocurrency market could be used as a safe haven against GPT during bull markets but against GPA during extreme bear markets.
In conclusion, with the expansion of data on geopolitical risks in recent years, more literature has begun empirically examining the influence of geopolitical risk on the international crude oil market, which provides a good reference for our research. However, most literature focused on the linear relationship between geopolitical risks and global crude oil prices. Few studies explored the nonlinear impact of geopolitical risks on global crude oil prices, particularly the heterogeneity of causality at various time frequencies. This research employs the nonlinear bivariate Granger causality (G.C.) test and the frequency domain Granger causality test to evaluate the potential explanatory effect of geopolitical risks on global crude oil price fluctuations.
3. Data and method
3.1. Data
The GPR index consists of monthly data from February 1986 through December 2019, according to Caldara and Iacoviello (Citation2017).Footnote1 It is determined by tallying the number of geopolitical tension-related articles published in 11 top international newspapers each month (as a share of the total number of news articles). The search discovers papers whose citations contain six-word groups (). As previously stated, the GPR index is separated into the GPA and GPT index based on groups of search terms.
Table 1. Specifications of the GPR.
The Energy Information Administration (EIA) of the USAFootnote2 provides the spot price of Brent crude oil from May 1987 to December 2019 and the spot price of WTI crude oil from February 1986 to December 2019. Real crude oil price is Brent and WTI crude oil prices deflated by the U.S. consumer price index (CPI). We calculate real oil price changes by , where
is the real oil price at time t, deflated by the CPI available from the Bureau of Labour Statistics.Footnote3
3.2. Econometric modelling framework
To determine if geopolitical risks and crude oil prices have a nonlinear causal relationship, we first investigate the effect of geopolitical risks on oil prices using the nonlinear Granger causality test (Diks & Panchenko, Citation2006; Hiemstra & Jones, Citation1994). On this premise, the Granger causality test in the frequency domain established by Lemmens et al. (Citation2008) is utilised to determine whether the predictive effect of geopolitical risks on the oil price is short-term or long-term.
3.2.1. Nonlinear Granger causality test
Diks and Panchenko (Citation2006) provide a new nonparametric test (hereafter, D&P test) for Granger causality based on the study of Hiemstra and Jones (Citation1994) (hereafter, H&J test). The null hypothesis is that does not contain additional information about
:
where and
respectively denote the lag length of
and
. The null hypothesis becomes a statement about the invariant distribution of the
dimensional vector,
,
, the conditional distribution of
given
is the same as that of
given
under the null hypothesis. Further, Eq. (1) can be restated in terms of ratios of joint distributions. Specifically, the joint probability density function
and its marginal density function should satisfy:
This states that and
are independent conditionally on
for each fixed value of
. Re-specify the null hypothesis of no nonlinear Granger causality as:
where is the sample size, and
is a local density estimator of a
-variate random vector
at
denoted by
, which is based on indicator functions
, with
the indicator function and bandwidth
. A natural estimator
based on indicator functions is
For , if
and
. The test statistic in Eq.(4) satisfies:
where denotes convergence in distribution and
is an estimator of the asymptotic variance of
. The critical value of the test statistic is 1.28, which rejects the null hypothesis at the 10% level of significance and supports evidence in favour of a nonlinear Granger causality among variables.
3.2.2. Frequency domain Granger causality test
The frequency domain Granger causality test over the spectrum is proposed by Lemmens et al. (Citation2008). Given and
are two stationary time series with length T. The goal is to test whether
Granger-causes
at a given frequency
. Measuring for G.C. in the frequency domain is performed on the univariate innovations series,
and
, derived from filtering the
and
as univariate ARMA processes, which are white-noise processes with zero means, possibly correlated with each other at different leads and lags. Let
and
be the spectral density function of
and
at a frequency
, defined by:
where and
represent the autocovariances of
and
at a lag
. The idea of spectral representation is that each time series may be decomposed into a sum of uncorrelated components, each related to a particular frequency
. Let
be the cross-spectrum between
and
series, which defined as:
where the called spectrum and quadrature spectrum
are respectively the real and imaginary parts of the cross-spectrum and
. Here
represents the cross-covariance of
and
at lag
. The spectrum
between the two series
and
at a frequency
can be interpreted as the covariance between the two series
and
that is attributable to cycles with frequency
. The cross-spectrum can be estimated non-parametrically by:
with the empirical cross-covariances and window weights
, for
. Equationequation (9)
(9)
(9) is called the weighted covariance estimator, and the weights
are selected as the Bartlett weighting scheme i.e.
. The constant
determines the maximum lag order considered. The spectra of Equationequations (6)
(6)
(6) and (Equation7
(7)
(7) ) are estimated in a similar way. This cross-spectrum allows us to compute the coefficient of coherence
defined as
.
Under the null hypothesis , the estimated squared coefficient of coherence at the frequency
, with
when appropriately rescaled, converges to a chi-squared distribution with 2 degrees of freedom, denoted by
.
where stands for convergence in distribution,
. The null hypothesis
versus
is then rejected if
,
with being the
quantile of the chi-squared distribution with 2 degrees of freedom. Then decompose the cross-spectrum (Eq. (6)) into three parts: (i)
, the instantaneous relationship between
and
; (ii)
, the directional relationship between
and lagged values of
; and (iii)
, the directional relationship between
and lagged values of
, i.e.
The proposed spectral measure of G.C. is based on the key property that does not Granger-cause
if and only if
for all
. The goal is to test the predictive content of
relative
to which is given by the second part of Eq. (11), that is:
. The Granger coefficient of coherence is then given by
. Therefore, in the absence of G.C.,
for every
in
. The Granger coefficient of coherence takes values between zero and one. Granger coefficient of coherence at a frequency
is estimated by
with as in Equationequation (9)
(9)
(9) , but with all weights
, for
. The distribution of the estimator of the Granger coefficient of coherence is derived from the distribution of the coefficient of coherence (Equationequation (10)
(10)
(10) ). Under the null hypothesis of
, the distribution of the squared estimated Granger coefficient of coherence at a frequency
, with
is given by
, where
is now replaced by
. Since the weights
, with a positive index k, are set equal to zero when computing
, in effect only the
with negative indices are considered. The null hypothesis
versus
is rejected if
.
4. Empirical results
4.1. The preparative work of empirical estimation
Before employing the nonlinear bivariate Granger causality test and frequency domain Granger causality test to investigate the potential explanatory effect of geopolitical risks on oil price fluctuations, more preparatory work was required.
4.1.1. Presentation of statistical results
To demonstrate why WTI and Brent are together used as proxy variables for worldwide crude oil prices, we present descriptive data on oil prices and geopolitical risks (). The mean for the change in Brent crude oil price is bigger than that of WTI price, and the variance of Brent price is greater than that of WTI price, confirming that there is a substantial difference between the two crude oil markets in North America and Europe.
Table 2. Descriptive statistics.
According to Hiemstra and Jones (Citation1994), Diks and Panchenko (Citation2006), and Lemmens et al. (Citation2008), all variables must be stationary for the models of nonlinear G.C and frequency domain G.C. employed in this paper. The unit root and stationary test results are shown in . Note that both the Augmented Dicky-Fuller (ADF) test (Citation1979) and Philip’s Peron (P.P.) test (Citation1988) reject the null hypothesis of a unit root in all time-series variables at a significance level of 1%, suggesting that all variables that satisfy the condition for constructing the nonlinear G.C. are stationary.
Table 3. Unit root and stationary test.
Using a simple unit root test without structural breaks is likely to diminish the test’s size and explanatory power, leading to erroneous empirical results. For this reason, Carrion-I-Silvestre et al. (Citation2009)‘s unit root test is utilised to avoid such problems. The empirical unit root results of Carrion-I-Silvestre et al. (Citation2009) are presented in , which includes various structural breaks for each series. The results of the tests reveal that all variables are also stationary.
Table 4. Unit root and stationary test with multiple breaks (GLS-based unit root test).
4.1.2. BDS test
If two-time series and their relationships have considerable nonlinear properties, it is inappropriate to employ linear models to fit the nexus (Balcilar et al., Citation2017). To demonstrate the applicability of our models, the second stage entails determining if the relationship between GPR and crude oil price is nonlinear. Similar to Wang and Wu (Citation2012), we use the BDS test (Broock et al., Citation1996) to examine the probability of nonlinearity for oil price changes, geopolitical risks, and the oil price changes equation in the VAR model incorporating geopolitical risks. As one of the most popular tests for nonlinearity, the BDS test examines whether data series increments are independent and identically distributed (i.i.d.). The BDS test results are presented in . As demonstrated in panel 1, the null of i.i.d. at various embedding dimensions (m) for each geopolitical risk index and oil price change series is rejected firmly at the 1% significance level. These findings prove the nonlinear features for real oil price fluctuations and geopolitical risks. In addition, the residuals of the oil price fluctuations equation in the VAR model containing (relative) geopolitical risks pass the BDS test at the 1% significance level, as shown in panels 2, 3, and 4. It suggests that the relationship between the GPR and oil price is nonlinear and that the conventional Granger causality tests based on a linear framework are likely to be misspecified.
Table 5. BDS tests.
4.1.3. Structural break tests
Following Balcilar et al. (Citation2017), since the linear Granger causality test cannot be considered robust and reliable, we turn to the Bai and Perron test (Bai & Perron, Citation1998, Citation2003) for providing strong evidence of nonlinearity and structural break in the relationship between geopolitical risks (including GPR, GPT, and GPA) and the movement of real oil prices (including WTI oil prices and Brent oil prices). According to , there are structural breaks in the relationship between geopolitical risks and real oil prices, which suggests that Granger causality tests based on a linear framework are likely to be misspecified. In particular, the Bai and Perron tests reveal five structural breaks with the dates for the GPR – WTI real oil price equation namely 1990M06, 1996M11, 2002M03, 2008M09, 2015M04, and the GPA – WTI real oil price equation and GPT – WTI equation have five breaks as well. These dates overlap with several significant oil market events. In 1991, for instance, the Gulf war persisted, and the price of crude oil surged dramatically during this time. However, according to the geopolitical risks – Brent real oil price equation, there are five different structural breaks between geopolitical risks and the Brent oil price, with 1994M11, 2000M04, 2005M09, 2010M10 and 2015M12 being the dates for geopolitical risks (GPR). The international price of crude oil changed significantly during the period covered by the preceding events. As with the BDS test, Bai and Perron test has identified nonlinearity, structural breaks in the link between geopolitical risks and the movement of real oil prices suggest that Granger causality tests based on a linear framework are likely to be misspecified. We now focus on the nonlinear Granger causality tests in light of the substantial evidence of either nonlinearity.
Table 6. Bai and Perron test for the geopolitical risks – WTI real oil price equation: and the geopolitical risks-Brent real oil price equation:
, where
denotes the variables of geopolitical risks (lnGPR, lnGPT, lnGPA). We build an AR (4) model based on the S.C. criterion.
4.2. Nonlinear Granger causality tests
Nonlinear causality between geopolitical risks and oil price fluctuations are investigated using the nonlinear Granger causality test developed by Hiemstra and Jones (Citation1994) and the nonlinear Granger causality test developed by Diks and Panchenko (Citation2006), respectively, to ensure the reliability of the results. The empirical results of the nonlinear Granger causality test are presented in . Panel 1 of displays the findings for the GPR index, while Panels 2 and 3 provide the results for the GPT index and GPA index, respectively. The null hypothesis of no nonlinear causality from geopolitical risks, including the GPR, GPT, and GPA, to oil price fluctuations (WTI and Brent) is rejected at a significance level of 5% for the lag length from the first lag to the fifth lag. Therefore, sufficient statistical evidence supports the notion that geopolitical risks have a strong nonlinear predictive effect on the variations in the worldwide oil price. It demonstrates that the recent turbulence in the Middle East and Russia–Ukraine war have played a significant nonlinear role in oil price fluctuations. In addition, the test results for the nonlinear Granger causality indicates no substantial nonlinear Granger causality from oil prices to geopolitical risks.
Table 7. Nonlinear Granger causality tests.
4.3. Frequency domain Granger causality
It extends the nonlinear nexus to examine the causality between two variables at various time frequencies. By doing so, we may determine the duration of geopolitical risks’ impact on the price of crude oil and the severity of geopolitical risks’ effects at different time frequencies. We further investigate the nonlinear association between geopolitical risks and oil prices at low and high frequencies.
In , the estimated Granger coefficients of coherence are plotted versus the frequency . This coefficient assesses whether and to what extent the geopolitical risks Granger cause the oil price at that frequency. The higher the estimated Granger coefficient of coherence is, the stronger the Granger causality at that particular frequency. If the coefficient is higher than the 5% critical value, the geopolitical risks significantly ‘Granger causes’ the oil price at the frequency
. Note that the lag length
and the frequency can be translated into a cycle or periodicity of T months by
, where T is the period. In this paper, we distinguish between the long-term components (low frequencies) and the short-term components (high frequencies) of a time series. Numerous scholars, such as Wang et al. (Citation2014), define the short term as the period being less than 12 months; otherwise, it is long term. Therefore, we define the long-term components to have a cycle larger or equal to 12 months, which corresponds to the frequency
. The short-term components have a cycle smaller than 12 months, which corresponds to a frequency
.
Figure 2. Granger coefficients of coherence for G.C. test from geopolitical risk to WTI oil price and Brent oil prices, respectively. The horizontal dashed line represents the critical value, at the 5% level, for the test for the null hypothesis of no G.C. The vertical dashed line represents the cut-off point () between the short-term and long-term.
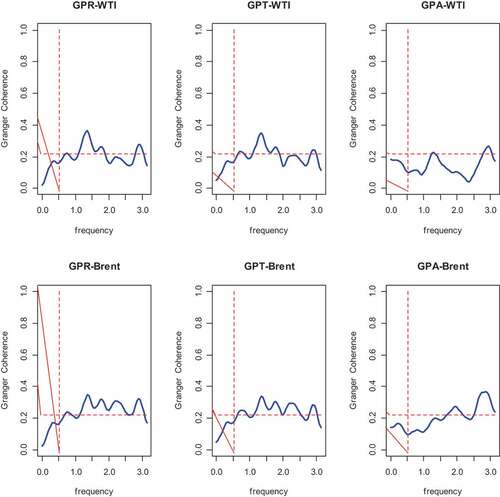
The top panel of shows Granger-causality results in the frequency domain from geopolitical risks to WTI oil prices. As can be seen, for GPR, GPT, and GPA, the null hypothesis of no causality cannot be rejected at the 5% significance level when the frequency (in the long term). It reveals that geopolitical risks cannot lead to WTI oil price changes in the long term. However, when the frequency
(in the short term), there always exists larger Granger coefficients of coherence in the range
to reject the null hypothesis of no causality. The result suggests a short-term predictive effect for geopolitical risks to WTI oil prices change. This finding is in line with Martina et al. (Citation2011), who proved that some major events had affected the short-term but not the long-term oil market complexity by using an entropy method. One explanation for this finding is that geopolitical risks lead to great volatility in the global economy and further greatly impact the balance of supply and demand in the crude oil market (Glick & Taylor, Citation2010). In recent years, wars in the Middle East happened frequently, and ISIS terrorist activities in oil-producing countries seriously affected the supply of global crude oil and caused turbulence in crude oil prices. Meanwhile, some terrorist attacks have also occurred in the U.S. and European countries, such as the 911 event in 2001 and the Paris bombing attack in November 2015, all of which have frustrated the confidence of the market participants and also have had a negative impact on the economy. Nevertheless, the predictive effect of geopolitical risks cannot play a role in the long term due to automatic adjustments in the market. This suggests that corresponding short-term measures should be acted on quickly to deal with the influence of geopolitical risks. Our findings are similar to what Chen et al. (Citation2016) found, notably that the political risk of OPEC countries has a significant and positive influence on Brent oil prices. It also supports the findings of Lee et al. (Citation2017).
A greater Granger coefficient of coherence exists in a high-frequency domain for geopolitical threats derived from GPT than for GPA. Pure geopolitical risks have a bigger and longer-lasting effect on WTI oil price fluctuations than actual adverse geopolitical events. This is because certain large events, such as threat events, cause investors’ future expectations to become more uncertain, affecting their trading behaviour and ultimately having a stronger impact on crude oil prices (Noguera-Santaella, Citation2016). Obviously, geopolitical events affect the price of crude oil, but they should not induce investors to anticipate excessive future instability. Consequently, compared to GPT, GPA cannot have a greater and more lasting impact on oil prices.
Since Brent crude oil is also the major benchmark for world crude oil pricing, we select Brent oil price as the international oil price and re-estimate the frequency domain Granger causality test model. This provides a robustness test. As shown in the bottom panel of , we obtain similar results with WTI oil prices. Overall, it confirms that geopolitical risks have only a short-term predictive effect on global oil price changes. Pure geopolitical risks have a larger and more persistent effect on oil prices than actual geopolitical events.
5. Concluding remarks
Using nonlinear causality tests and a Granger causality test in the frequency domain, this study investigated whether geopolitical risks have a significant predictive impact on the movement of real crude oil prices. According to the findings, geopolitical risks have a large nonlinear predictive effect on oil prices. The predictive effect of geopolitical risks, therefore, is only merely valid in the short term. Moreover, pure geopolitical risks have a bigger and longer-lasting impact on oil prices than actual adverse geopolitical events.
Our findings have important threefold implications for oil market participants. First, geopolitical risk information can predict oil prices in a nonlinear model but not in a linear model, indicating the necessity to optimise the estimated model from a nonlinear perspective that can better identify the role of geopolitical risk in the crude oil price formation mechanism. Second, market participants do not need to be unduly concerned about geopolitical risks, as they will only have a short-term (less than one year) impact on oil prices. This implies that when global geopolitical risks increase, the relevant ministries should undertake short-term stability policies in a timely manner to combat the volatility of oil prices. Finally, when devising various countermeasures, it is crucial to correctly differentiate between the impact of pure risk (such as war and terrorist attack threats) and actual political events on crude oil prices.
Our analysis reveals multiple avenues for future study. First, more research is needed to understand whether geopolitical risks emanating from certain nations affect oil prices differently. Second, whether there is a difference between the short- and long-term projections of geopolitical risks on oil prices can be investigated when the worldwide crude oil market is in various conditions (such as a bull market or a bear market). Third, the nonlinear G.C. from geopolitical risks to oil prices calls for a more fine-grained analysis of whether a threshold effect of geopolitical risks exists on oil prices.
Credit author statement
Yong Jiang: Conceptualisation, Methodology, Validation, Formal analysis, Investigation, Data curation, Supervision, Writing – original draft, Writing – review & editing, Software, Project administration, Funding acquisition. Yi-Shuai Ren: Conceptualisation, Methodology, Validation, Formal analysis, Investigation, Data curation, Writing – original draft, Writing – review & editing, Visualisation, Resources, Project administration, Funding acquisition. Xiao-Guang Yang: Resources, Review & editing, Visualisation, Funding acquisition. Chao-Qun Ma: Conceptualisation, Funding acquisition, Project administration, Funding acquisition. Olaf Weber: Review & editing. All authors read and approved the final manuscript.
Disclosure statement
No potential conflict of interest was reported by the author(s).
Additional information
Funding
Notes
References
- Alamgir, F., & Amin, S. B. (2021). The nexus between oil price and stock market: Evidence from South Asia. Energy Reports, 7, 693–703. https://doi.org/10.1016/j.egyr.2021.01.027
- Alqahtani, A., & Klein, T. (2021). Oil price changes, uncertainty, and geopolitical risks: On the resilience of GCC countries to global tensions. Energy, 236, 121541. https://doi.org/10.1016/j.energy.2021.121541
- Antonakakis, N., Gupta, R., Kollias, C., & Papadamou, S. (2017). Geopolitical risks and the oil-stock nexus over 1899–2016. Finance Research Letters, 23, 165–173. https://doi.org/10.1016/j.frl.2017.07.017
- Apergis, N., Bonato, M., Gupta, R., & Kyei, C. (2017). Does geopolitical risks predict stock returns and volatility of leading defense companies? Evidence from a nonparametric approach. Defence and Peace Economics, 1–13. https://doi.org/10.1080/10242694.2017.1292097
- Apergis, N., & Miller, S. M. (2009). Do structural oil-market shocks affect stock prices? Energy Economics, 31(4), 569–575. https://doi.org/10.1016/j.eneco.2009.03.001
- Azhgaliyeva, D., Mishra, R., & Kapsalyamova, Z. (2021). Oil price shocks and green bonds: A longitudinal multilevel model (No. 1278). ADBI Working Paper.
- Bai, J., & Perron, P. (1998). Estimating and testing linear models with multiple structural changes. Econometrica, 66(1), 47–78. https://doi.org/10.2307/2998540
- Bai, J., & Perron, P. (2003). Computation and analysis of multiple structural change models. Journal of Applied Econometrics, 18(1), 1–22. https://doi.org/10.1002/jae.659
- Balcilar, M., Cakan, E., & Gupta, R. (2017). Does U.S. news impact Asian emerging markets? Evidence from nonparametric causality-in-quantiles test. The North American Journal of Economics and Finance, 41, 32–43. https://doi.org/10.1016/j.najef.2017.03.009
- Basher, S. A., Haug, A. A., & Sadorsky, P. (2016). The impact of oil shocks on exchange rates: A Markov-switching approach. Energy Economics, 54, 11–23. https://doi.org/10.1016/j.eneco.2015.12.004
- Bashir, M. F. (2022). Oil price shocks, stock market returns, and volatility spillovers: A bibliometric analysis and its implications. Environmental Science and Pollution Research, 29(16), 1–20. https://doi.org/10.1007/s11356-021-18314-4
- Baur, D. G., & Smales, L. A. (2018). Gold and geopolitical risk. SSRN Electronic Journal. Available at SSRN 3109136. https://doi.org/10.2139/ssrn.3109136
- Benlagha, N., & El Omari, S. (2022). Connectedness of stock markets with gold and oil: New evidence from COVID-19 pandemic. Finance Research Letters, 46, 102373. https://doi.org/10.1016/j.frl.2021.102373
- Bouoiyour, J., Selmi, R., Hammoudeh, S., & Wohar, M. E. (2019). What are the categories of geopolitical risks that could drive oil prices higher? Acts or threats? Energy Economics, 84, 104523. https://doi.org/10.1016/j.eneco.2019.104523
- Bourghelle, D., Jawadi, F., & Rozin, P. (2021). Oil price volatility in the context of Covid-19. International Economics, 167, 39–49. https://doi.org/10.1016/j.inteco.2021.05.001
- Broock, W. A., Scheinkman, J. A., Dechert, W. D., & LeBaron, B. (1996). A test for independence based on the correlation dimension. Econometric Reviews, 15(3), 197–235. https://doi.org/10.1080/07474939608800353
- Caldara, D., Conlisk, S., Iacoviello, M., & Penn, M. (2022). The effect of the war in Ukraine on global activity and inflation. https://www.federalreserve.gov/econres/notes/feds-notes/the-effect-of-the-war-in-ukraine-on-global-activity-and-inflation-20220527.htm
- Caldara, D., & Iacoviello, M. (2017). Measuring geopolitical risk. Working Paper, Board of Governors of the Federal Reserve Board,
- Caldara, D., & Iacoviello, M. (2018). Measuring geopolitical risk. The Fed - International Finance Discussion Papers.
- Caldara, D., & Iacoviello, M. (2019). Measuring geopolitical risk. Working Paper, Board of Governors of the Federal Reserve Board.
- Caldara, D., & Iacoviello, M. (2022). Measuring geopolitical risk. The American Economic Review, 112(4), 1194–1225. https://doi.org/10.1257/aer.20191823
- Carrion-I-Silvestre, J. L., Kim, D., & Perron, P. (2009). GLS-based unit root tests with multiple structural breaks under both the null and the alternative hypotheses. Econometric Theory, 25(6), 1754–1792. https://doi.org/10.1017/S0266466609990326
- Chen, S. S. (2009). Oil price pass-through into inflation. Energy Economics, 31(1), 126–133. https://doi.org/10.1016/j.eneco.2008.08.006
- Chen, S. S., Huang, S., & Lin, T. Y. (2022). How do oil prices affect emerging market sovereign bond spreads? Journal of International Money and Finance, 128, 102700. https://doi.org/10.1016/j.jimonfin.2022.102700
- Chen, H., Liao, H., Tang, B. J., & Wei, Y. M. (2016). Impacts of OPEC’s political risk on the international crude oil prices: An empirical analysis based on the SVAR models. Energy Economics, 57, 42–49. https://doi.org/10.1016/j.eneco.2016.04.018
- Chu, P. K., Hoff, K., Molnár, P., & Olsvik, M. (2022). Crude oil: Does the futures price predict the spot price? Research in International Business and Finance, 60, 101611. https://doi.org/10.1016/j.ribaf.2021.101611
- Colon, F., Kim, C., Kim, H., & Kim, W. (2021). The effect of political and economic uncertainty on the cryptocurrency market. Finance Research Letters, 39, 101621. https://doi.org/10.1016/j.frl.2020.101621
- Cunado, J., Gupta, R., Lau, C. K. M., & Sheng, X. (2020). Time-varying impact of geopolitical risks on oil prices. Defence and Peace Economics, 31(6), 692–706. https://doi.org/10.1080/10242694.2018.1563854
- Darby, M. R. (1982). The price of oil and world inflation and recession. The American Economic Review, 72(4), 738–751.
- Demirer, R., Ferrer, R., & Shahzad, S. J. H. (2019). Oil price shocks and financial markets: A comparative analysis of stock and sovereign bond markets. Energy Economics, 88, 104771. https://doi.org/10.1016/j.eneco.2020.104771
- Dey, A. K., Edwards, A., & Das, K. P. (2020). Determinants of high crude oil price: A nonstationary extreme value approach. Journal of Statistical Theory and Practice, 14(1), 1–14. https://doi.org/10.1007/s42519-019-0070-7
- Dickey, D. A., & Fuller, W. A. (1979). Distribution of the estimators for autoregressive time series with a unit root. Journal of the American Statistical Association, 74(366a), 427–431. https://doi.org/10.1080/01621459.1979.10482531
- Diks, C., & Panchenko, V. (2006). A new statistic and practical guidelines for nonparametric Granger causality testing. Journal of Economic Dynamics & Control, 30(9–10), 1647–1669. https://doi.org/10.1016/j.jedc.2005.08.008
- Dissanayakea, R., Mehrotrab, V., & Wuc, Y. (2018). Geopolitical risk and corporate investment. https://www.federalreserve.gov/econres/ifdp/files/ifdp1222.pdf
- Dutta, A. (2017). Oil price uncertainty and clean energy stock returns: New evidence from crude oil volatility index. Journal of Cleaner Production, 164, 1157–1166. https://doi.org/10.1016/j.jclepro.2017.07.050
- Ewing, B. T., & Malik, F. (2017). Modelling asymmetric volatility in oil prices under structural breaks. Energy Economics, 63, 227–233. https://doi.org/10.1016/j.eneco.2017.03.001
- Fasanya, I. O., Oyewole, O. J., Adekoya, O. B., & Badaru, F. O. (2021). Oil price and stock market behaviour in GCC countries: Do asymmetries and structural breaks matter? Energy Strategy Reviews, 36, 100682. https://doi.org/10.1016/j.esr.2021.100682
- Geng, J. B., Ji, Q., & Fan, Y. (2017). The relationship between regional natural gas markets and crude oil markets from a multi-scale nonlinear Granger causality perspective. Energy Economics, 67, 98–110. https://doi.org/10.1016/j.eneco.2017.08.006
- Gil-Alana, L. A., & Monge, M. (2020). Crude oil prices and COVID-19: Persistence of the shock. Energy Research Letters, 1(1), 13200. https://doi.org/10.46557/001c.13200
- Gkillas, K., Manickavasagam, J., & Visalakshmi, S. (2022). Effects of fundamentals, geopolitical risk and expectations factors on crude oil prices. Resources Policy, 78, 102887. https://doi.org/10.1016/j.resourpol.2022.102887
- Glick, R., & Taylor, A. M. (2010). Collateral damage: Trade disruption and the economic impact of war. The Review of Economics and Statistics, 92(1), 102–127. https://doi.org/10.1162/rest.2009.12023
- Gong, X., & Xu, J. (2022). Geopolitical risk and dynamic connectedness between commodity markets. Energy Economics, 110, 106028. https://doi.org/10.1016/j.eneco.2022.106028
- Gu, X., Zhu, Z., & Yu, M. (2021). The macro effects of GPR and EPU indexes over the global oil market—are the two types of uncertainty shock alike? Energy Economics, 100, 105394. https://doi.org/10.1016/j.eneco.2021.105394
- Hamilton, J. D. (1996). This is what happened to the oil price-macroeconomy relationship. Journal of Monetary Economics, 38(2), 215–220. https://doi.org/10.1016/S0304-3932(96)01282-2
- Hammoudeh, S., Sari, R., Uzunkaya, M., & Liu, T. (2013). The dynamics of BRICS’s country risk ratings and domestic stock markets, U.S. stock market and oil price. Mathematics and Computers in Simulation, 94, 277–294. https://doi.org/10.1016/j.matcom.2012.01.002
- He, Z., Zhou, F., Xia, X., Wen, F., & Huang, Y. (2019). Interaction between oil price and investor sentiment: Nonlinear causality, time-varying influence, and asymmetric effect. Emerging Markets Finance and Trade, 55(12), 2756–2773. https://doi.org/10.1080/1540496X.2019.1635450
- Hiemstra, C., & Jones, J. D. (1994). Testing for linear and nonlinear Granger causality in the stock price‐volume relation. The Journal of Finance, 49(5), 1639–1664. https://doi.org/10.1111/j.1540-6261.1994.tb04776.x
- Hwang, I., & Kim, J. (2021). Oil price shocks and the US stock market: A nonlinear approach. Journal of Empirical Finance, 64, 23–36. https://doi.org/10.1016/j.jempfin.2021.08.004
- Ivanovski, K., & Hailemariam, A. (2022). Time-varying geopolitical risk and oil prices. International Review of Economics & Finance, 77, 206–221. https://doi.org/10.1016/j.iref.2021.10.001
- Jiao, J. L., Gan, H. H., & Wei, Y. M. (2012). The impact of oil price shocks on Chinese industries. Energy Sources, Part B: Economics, Planning, and Policy, 7(4), 348–356. https://doi.org/10.1080/15567249.2011.594852
- Jia, Z., Wen, S., & Lin, B. (2021). The effects and reacts of COVID-19 pandemic and international oil price on energy, economy, and environment in China. Applied Energy, 302, 117612. https://doi.org/10.1016/j.apenergy.2021.117612
- Ji, Q., & Guo, J. F. (2015). Oil price volatility and oil-related events: An internet concern study perspective. Applied Energy, 137, 256–264. https://doi.org/10.1016/j.apenergy.2014.10.002
- Kang, W., Ratti, R. A., & Yoon, K. H. (2014). The impact of oil price shocks on U.S. bond market returns. Energy Economics, 44, 248–258. https://doi.org/10.1016/j.eneco.2014.04.009
- Kesicki, F. (2010). The third oil price surge-what’s different this time? Energy Policy, 38(3), 1596–1606. https://doi.org/10.1016/j.enpol.2009.11.044
- Khalfaoui, R., Solarin, S. A., Al-Qadasi, A., & Ben Jabeur, S. (2022). Dynamic causality interplay from COVID-19 pandemic to oil price, stock market, and economic policy uncertainty: Evidence from oil-importing and oil-exporting countries. Annals of Operations Research, 313(1), 1–39. https://doi.org/10.1007/s10479-021-04446-w
- Kilian, L. (2009). Not all oil price shocks are alike: Disentangling demand and supply shocks in the crude oil market. The American Economic Review, 99(3), 1053–1069. https://doi.org/10.1257/aer.99.3.1053
- Kilian, L., & Park, C. (2009). The impact of oil price shocks on the U.S. stock market. International economic review, 50(4), 1267–1287. https://doi.org/10.1111/j.1468-2354.2009.00568.x
- Kisswani, K. M. (2021). (A) symmetric time-varying effects of uncertainty fluctuations on oil price volatility: A nonlinear ARDL investigation. Resources Policy, 73, 102210. https://doi.org/10.1016/j.resourpol.2021.102210
- Lee, Y. H., Hu, H. N., & Chiou, J. S. (2010). Jump dynamics with structural breaks for crude oil prices. Energy Economics, 32(2), 343–350. https://doi.org/10.1016/j.eneco.2009.08.006
- Lee, C. C., Lee, C. C., & Li, Y. Y. (2021). Oil price shocks, geopolitical risks, and green bond market dynamics. The North American Journal of Economics and Finance, 55, 101309. https://doi.org/10.1016/j.najef.2020.101309
- Lee, C. C., Lee, C. C., & Ning, S. L. (2017). Dynamic relationship of oil price shocks and country risks. Energy Economics, 66, 571–581. https://doi.org/10.1016/j.eneco.2017.01.028
- Lee, C. C., Tang, H., & Li, D. (2022). The roles of oil shocks and geopolitical uncertainties on China’s green bond returns. Economic Analysis and Policy, 74, 494–505. https://doi.org/10.1016/j.eap.2022.03.008
- Lemmens, A., Croux, C., & Dekimpe, M. G. (2008). Measuring and testing Granger causality over the spectrum: An application to European production expectation surveys. International Journal of Forecasting, 24(3), 414–431. https://doi.org/10.1016/j.ijforecast.2008.03.004
- Li, Q., Cheng, K., & Yang, X. (2017). Response pattern of stock returns to international oil price shocks: From the perspective of China’s oil industrial chain. Applied Energy, 185, 1821–1831. https://doi.org/10.1016/j.apenergy.2015.12.060
- Lieber, R. J. (1992). Oil and power after the gulf war. International Security, 17(1), 155–176. https://doi.org/10.2307/2539161
- Li, F., Huang, Z., Zhong, J., & Albitar, K. (2020). Do tense geopolitical factors drive crude oil prices? Energies, 13(16), 4277. https://doi.org/10.3390/en13164277
- Liu, Y., Han, L., & Xu, Y. (2021). The impact of geopolitical uncertainty on energy volatility. International Review of Financial Analysis, 75, 101743. https://doi.org/10.1016/j.irfa.2021.101743
- Martina, E., Rodriguez, E., Escarela-Perez, R., & Alvarez-Ramirez, J. (2011). Multiscale entropy analysis of crude oil price dynamics. Energy Economics, 33(5), 936–947. https://doi.org/10.1016/j.eneco.2011.03.012
- Mei, D., Ma, F., Liao, Y., & Wang, L. (2020). Geopolitical risk uncertainty and oil future volatility: Evidence from MIDAS models. Energy Economics, 86, 104624. https://doi.org/10.1016/j.eneco.2019.104624
- Mensi, W., Hammoudeh, S., Shahzad, S. J. H., Al-Yahyaee, K. H., & Shahbaz, M. (2017). Oil and foreign exchange market tail dependence and risk spillovers for MENA, emerging and developed countries: VMD decomposition based copulas. Energy Economics, 67, 476–495. https://doi.org/10.1016/j.eneco.2017.08.036
- Monge, M., Gil-Alana, L. A., & Gracia, F. P. D. (2017). Crude oil price behaviour before and after military conflicts and geopolitical events. Energy, 120, 79–91. https://doi.org/10.1016/j.energy.2016.12.102
- Morrison, E. J. (2019). Energy price implications for emerging market bond returns. Research in International Business and Finance, 50, 398–415. https://doi.org/10.1016/j.ribaf.2019.06.010
- Narayan, P. K., & Narayan, S. (2010). Modelling the impact of oil prices on Vietnam’s stock prices. Applied Energy, 87(1), 356–361. https://doi.org/10.1016/j.apenergy.2009.05.037
- Narayan, P. K., Ranjeeni, K., & Bannigidadmath, D. (2017). New evidence of psychological barrier from the oil market. Journal of Behavioral Finance, 18(4), 457–469. https://doi.org/10.1080/15427560.2017.1365235
- Ngoma, A. L. (2022). Does real exchange rate respond asymmetrically to changes in real oil price? Journal of Developing Areas, 56(2), 91–106. https://doi.org/10.1353/jda.2022.0037
- Noguera, J. (2013). Oil prices: Breaks and trends. Energy Economics, 37, 60–67. https://doi.org/10.1016/j.eneco.2012.12.008
- Noguera-Santaella, J. (2016). Geopolitics and the oil price. Economic modelling, 52, 301–309. https://doi.org/10.1016/j.econmod.2015.08.018
- Olanipekun, I. O., & Alola, A. A. (2020). Crude oil production in the Persian Gulf amidst geopolitical risk, cost of damage and resources rents: Is there asymmetric inference? Resources Policy, 69, 101873. https://doi.org/10.1016/j.resourpol.2020.101873
- Park, J., & Ratti, R. A. (2008). Oil price shocks and stock markets in the U.S. and 13 European countries. Energy Economics, 30(5), 2587–2608. https://doi.org/10.1016/j.eneco.2008.04.003
- Phillips, P. C., & Perron, P. (1988). Testing for a unit root in time series regression. Biometrika, 75(2), 335–346.
- Qian, L., Zeng, Q., & Li, T. (2022). Geopolitical risk and oil price volatility: Evidence from Markov-switching model. International Review of Economics & Finance, 81, 29–38. https://doi.org/10.1016/j.iref.2022.05.002
- Ren, Y. S., Narayan, S., & Ma, C. Q. (2021). Air quality, COVID-19, and the oil market: Evidence from China’s provinces. Economic Analysis and Policy, 72, 58–72. https://doi.org/10.1016/j.eap.2021.07.012
- Salisu, A. A., Pierdzioch, C., & Gupta, R. (2021). Geopolitical risk and forecastability of tail risk in the oil market: Evidence from over a century of monthly data. Energy, 235, 121333. https://doi.org/10.1016/j.energy.2021.121333
- Selmi, R., Bouoiyour, J., & Miftah, A. (2020). Oil price jumps and the uncertainty of oil supplies in a geopolitical perspective: The role of OPEC’s spare capacity. International Economics, 164, 18–35. https://doi.org/10.1016/j.inteco.2020.06.004
- Sharif, A., Aloui, C., & Yarovaya, L. (2020). COVID-19 pandemic, oil prices, stock market, geopolitical risk and policy uncertainty nexus in the US economy: Fresh evidence from the wavelet-based approach. International Review of Financial Analysis, 70, 101496. https://doi.org/10.1016/j.irfa.2020.101496
- Smales, L. A. (2021). Geopolitical risk and volatility spillovers in oil and stock markets. The Quarterly Review of Economics and Finance, 80, 358–366. https://doi.org/10.1016/j.qref.2021.03.008
- Su, C. W., Chen, Y., Hu, J., Chang, T., & Umar, M. (2022). Can the green bond market enter a new era under the fluctuation of oil price? Economic Research-Ekonomska Istraživanja, 1–26. https://doi.org/10.1080/1331677X.2022.2077794
- Su, C. W., Qin, M., Tao, R., & Moldovan, N. C. (2021). Is oil political? From the perspective of geopolitical risk. Defence and Peace Economics, 32(4), 451–467. https://doi.org/10.1080/10242694.2019.1708562
- Sweidan, O. D. (2021). The geopolitical risk effect on the U.S. renewable energy deployment. Journal of Cleaner Production, 293, 126189. https://doi.org/10.1016/j.jclepro.2021.126189
- Tian, M., Li, W., & Wen, F. (2021). The dynamic impact of oil price shocks on the stock market and the USD/RMB exchange rate: Evidence from implied volatility indices. The North American Journal of Economics and Finance, 55, 101310. https://doi.org/10.1016/j.najef.2020.101310
- Tule, M. K., Ndako, U. B., & Onipede, S. F. (2017). Oil price shocks and volatility spillovers in the Nigerian sovereign bond market. Review of Financial Economics, 35, 57–65. https://doi.org/10.1016/j.rfe.2017.03.003
- Wang, K. H., Su, C. W., & Umar, M. (2021). Geopolitical risk and crude oil security: A Chinese perspective. Energy, 219, 119555. https://doi.org/10.1016/j.energy.2020.119555
- Wang, Y., & Wu, C. (2012). Energy prices and exchange rates of the U.S. dollar: Further evidence from linear and nonlinear causality analysis. Economic modelling, 29(6), 2289–2297. https://doi.org/10.1016/j.econmod.2012.07.005
- Wang, Y., Wu, C., & Yang, L. (2014). Oil price shocks and agricultural commodity prices. Energy Economics, 44, 22–35. https://doi.org/10.1016/j.eneco.2014.03.016
- Wen, F., Xiao, J., Xia, X., Chen, B., Xiao, Z., & Li, J. (2019). Oil prices and Chinese stock market: Nonlinear causality and volatility persistence. Emerging Markets Finance and Trade, 55(6), 1247–1263. https://doi.org/10.1080/1540496X.2018.1496078
- Yang, C., Niu, Z., & Gao, W. (2022). The time-varying effects of trade policy uncertainty and geopolitical risks shocks on the commodity market prices: Evidence from the TVP-VAR-SV approach. Resources Policy, 76, 102600. https://doi.org/10.1016/j.resourpol.2022.102600
- Yao, T., Zhang, Y. J., & Ma, C. Q. (2017). How does investor attention affect international crude oil prices? Applied Energy, 205, 336–344. https://doi.org/10.1016/j.apenergy.2017.07.131
- Zhang, Y. J. (2013). Speculative trading and WTI crude oil futures price movement: An empirical analysis. Applied Energy, 107, 394–402. https://doi.org/10.1016/j.apenergy.2013.02.060
- Zhang, X., Lai, K. K., & Wang, S. Y. (2008). A new approach for crude oil price analysis based on empirical mode decomposition. Energy EconEnergy Economics, 30(3), 905–918. https://doi.org/10.1016/j.eneco.2007.02.012
- Zhang, X., Yu, L., Wang, S., & Lai, K. K. (2009). Estimating the impact of extreme events on crude oil price: An EMD-based event analysis method. Energy EconEnergy Economics, 31(5), 768–778. https://doi.org/10.1016/j.eneco.2009.04.003