
ABSTRACT
We combine satellite imagery, urban growth modelling, groundwater modelling and hydrogeological field expeditions to estimate the potential impacts in 2050 of rapid urbanization and climate change on groundwater in Arusha, Tanzania, and by extension similar areas in Sub-Saharan Africa. Our analysis suggests that a reduction of groundwater recharge by 30–44% will cause groundwater levels to drop by up to 75 m, mainly due to increased evapotranspiration and to an expansion in paved surface. If this scenario becomes reality, we predict that wells will run dry, creating health, social and environmental risks.
Introduction
There is a direct link between population growth, urbanization and water resources (Thomas & Zuberi, Citation2012). The growth of cities as a result of population growth and rural–urban migration is a global phenomenon (Kessides, Citation2006). In 2050, an expected 2.4 billion people will live in Africa, compared to 1.1 billion now. Assuming the urban population increases from 40% now to 55% in 2050 (UN/DESA, Citation2015), the urban population will grow from 440 million to 1320 million, a three-fold multiplication in only 35 years. With the exception of Asia, Africa will have more urban residents than any other continent in the world (Clark, Citation1998; Parnell & Walawege, Citation2011). Along with rapid growth in urban populations, there is a proportional rise in demand for potable water that typically exceeds the capacity of existing facilities (Taylor et al., Citation2004). Groundwater plays a fundamental but often unappreciated role in the economic and social well-being of urban areas (Taylor et al., Citation2009). More than 50% of the African population relies on groundwater for domestic, agricultural and industrial use (Carter & Parker, Citation2009). In many situations, without groundwater there would be a deficit in water supply. Groundwater is more readily available at or close to the demand point and is often potable at the source (Taylor & Barrett, Citation1999).
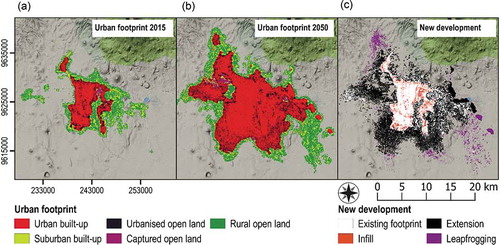
Figure 1. Urban area and new development between 2015 and 2050.
Besides the increase in water demand, urbanization also modifies the natural land cover. The long-term sustainability of urban groundwater relies on regular input of water to the subsurface as groundwater recharge (Taylor & Barrett, Citation1999). The amount of water that infiltrates into the aquifer during a precipitation event depends to a large extent on the land cover types. Land cover is frequently subjected to spatial and temporal change due to urbanization, and this alters the hydrological characteristics of the land surface, modifying infiltration rates and runoff processes (Foster et al., Citation1999; Mahmoud et al., Citation2015).
Where the city lacks good sanitation facilities, urban expansion often also leads to contamination of fresh groundwater (Foster et al., Citation1999). For example, the use of low-cost on-site sanitation facilities like pit latrines and septic tanks is very common in many countries in Sub-Saharan Africa (SSA). The subsurface is being used as containment for domestic and industrial waste, and sewerage systems and wastewater treatment plants are often not included in essential urban infrastructure because they are considered expensive. Therefore, the susceptibility of groundwater sources to contamination is very high in SSA (Taylor & Barrett, Citation1999). Yet, despite being a contamination source, on-site sanitation systems contribute to additional recharge to the aquifer (Morris et al., Citation2003).
Countries in SSA are among the most vulnerable to the impacts of climate change, which also threatens water availability (Case, Citation2006). Yet, climate conditions vary across Africa, and sub-regional climate change predictions are usually complicated (Christensen et al., Citation2007). While there is an agreement on temperature projections, projections of rainfall remain uncertain (Christensen et al., Citation2007; FCFA, Citation2017). Combined with the expected rapid socio-economic changes, predicting future water availability in SSA becomes a difficult exercise (Calow & Macdonald, Citation2009). The sustainability of turning to groundwater to ease the water scarcity brought by increased demand or climate change is therefore unclear, even though in many regions, urbanization is expected to have a much more profound impact on groundwater than climate change (Calow & Macdonald, Citation2009; Carter & Parker, Citation2009; Taylor et al., Citation2009).
Land use and land cover (LULC) change models, which attempt to extrapolate historical LULC transformations, provide a powerful lens for examining future urban development trends. Urban growth patterns are often determined by local geographic interactions, where neighbouring conditions determine the actual formation of urban land cover, instead of ‘top-down’ drivers (Batty, Citation2007). This is especially the case in rapidly growing urban areas in the developing world, where growth is predominantly uncontrolled. For climate change, the Intergovernmental Panel on Climate Change also provides documented reports for global and regional climate projections (Niang et al., Citation2014; Shukla et al., Citation2019). From a hydrogeological point of view, the results of urban and climate projections would be more relevant if their impacts on groundwater could be quantified. Fortunately, it is possible to assess the hydrogeological impacts of urbanization and climate change by integrating the outcomes of LULC change models and climate projections with a groundwater modelling approach in a multidisciplinary manner.
Studies assessing the combined impacts of urbanization and climate change on groundwater resources in rapidly growing and climate vulnerable SSA cities are rare. In this study, we combined knowledge of LULC classification, urban growth modelling and groundwater modelling to explore the combined quantitative impacts of urbanization and climate change on groundwater in SSA, with a special focus on the fast-growing city of Arusha, Tanzania. The outcomes provide an outlook on the state of future groundwater and should play a role in supporting local authorities to channel resources in the right direction.
Case study area
We used Arusha as an example city because it has characteristics similar to many typical SSA cities: principal reliance on groundwater; rapid urban growth; and location in a region with a large uncertainty in climate change predictions (FCFA, Citation2017). Arusha is the third-largest city in Tanzania, in the foothills of the volcanic plain of Mount Meru in the north-eastern part of the country. In 2012 it had a population of 416,000 (NBS and Office of Chief Statistician Zanzibar, Citation2013). More recent statistics are not available. Many of its residents are low and average income earners, living in many informal settlements scattered across the city. Elevations range from 1100 m in the south to 4566 m on the peak of Mount Meru. It is in a semi-arid zone, and its environmental and hydrological stability strongly depends on the evergreen forests of Mount Meru (Oikos, Citation2011). Rainfall distribution varies with altitude. The average annual rainfall is 794 mm, and potential evapotranspiration is 924 mm/y (GITEC, Citation2011). Temperature is highest in February, with an average of 25 °C, and 13 °C in the coolest month, July.
The landform is associated with the East African rift-related intrusive and extrusive event, which is responsible for the formation of Mount Meru, a young volcano of Pleistocene origin (Kashaigili, Citation2010). Several volcanic eruptions have developed a chronological interlayering of volcanic ashes, sands, gravels, tuffs and basalt. This has resulted in complex heterogeneous hydrogeological settings with varying permeability (Ghiglieri et al., Citation2008). The main aquifer occurs singularly in the volcanic alluvium or at times as a perched system with high permeability and an average thickness of 200 m (Ghiglieri et al., Citation2008). Hydraulic conductivity (k) varies from 0.5 to 5.9 m/day in different parts of the aquifer (Ong’or & Long-Cang, Citation2007).
Groundwater accounts for over 80% of the daily water supply in Arusha (EWURA, Citation2015). Recharge into the unconfined aquifer is mainly from infiltration of excess rainfall, with a significant amount coming from the slopes of Mount Meru (GITEC, Citation2011; Kashaigili, Citation2010). Climate variability threatens water availability in north-east Tanzania, as evidenced by dry spells in 2003 and 2005, for example (FCFA, Citation2017). The prolonged drought hurt farmers, causing severe livestock loss and repeated food crises. It resulted in water supply shortage and also affected the natural regeneration capacity of the forest (Oikos, Citation2011).
Arusha has demonstrated a great ‘urban pull’ effect, attracting internal migrants (Wenban-smith, Citation2015). In 2002, it became one of the largest regional capitals, after Dar es Salaam and Mwanza (NBC, Citation2014). The draw of this city for migrants is mainly due to its economic potential, driven by touristic and international presence. Much of the growth was unplanned, and only recently was a long-term development plan proposed, with a horizon of 2035. Yet, this proposed plan has never been evaluated to assess it potential impacts on water resources and future sustainability. The development between 1995 and 2015 was very rapid, and this had consequences for water supply and availability (Agwanda & Amani, Citation2014). The Arusha Urban Water and Sanitation Agency (AUWSSA), the local public water supply agency, has been unable to meet the growing demand of different sectors (EGIS, Citation2017). The infrastructural, social and developmental changes needed to dampen the effects of rapid urbanization and climate change are either not in place or happening at a very slow rate.
Methodology
Groundwater level mapping
From November 2015 to January 2016, we carried out fieldwork, including a well inventory, in the Osunyai, Unga, and Sombetini wards of Arusha. When possible, the depth from the surface to groundwater was manually measured in open shallow wells. We also mapped spring locations. Springs were used assuming that groundwater head equals surface elevation. In addition to the fieldwork, we obtained groundwater level information from AUWSSA wells. Using kriging, the data were used to construct a groundwater-level contour map, which was then used to arrive at an initial head distribution in the groundwater model (see below) and to calibrate the groundwater model.
Land use and land cover change model and analysis
Our estimates of future LULC changes were based on extrapolations of historic urban growth patterns, which were obtained by application of a dedicated LULC change model (Veerbeek et al., Citation2015). Using historic LULC maps as a training set, the model attempts to derive location-specific transition rules which explain LULC transitions (e.g. grassland to built-up area) as functions of the existence of specific spatial features (e.g. proximity to major roads). These weight-based rules are optimized using a machine learning algorithm that attempts to estimate the correct weight distribution to effectively produce a set of transition rules that mimic the observed LULC changes in the area of interest. Once sufficiently good fit was achieved between the projected LULC map and the observed LULC map of the area, the derived transition rules were used to develop a series of LULC projections for a given temporal horizon. The model was based on adaptation of the weights-of-evidence method (Agterberg & Bonham-Carter, Citation1990; Goodacre et al., Citation1993) for weight-based transition rules, while Veerbeek et al. (Citation2015) incorporated a memetic-algorithm-based auto-calibration method to enhance the model’s accuracy. Since its initial development in the early 2000s, the model has been applied to a broad range of projects (Rodrigues & Soares-Filho, Citation2018). The model’s accuracy and performance have been extensively compared to other LULC models (e.g. Mas et al., Citation2014; Yi et al., Citation2012).
For this study, LULC data were based on Landsat 5TM and Sentinel-2 multispectral data covering 1995 to 2015. LULC classification was performed by a multi-temporal maximum-likelihood classification (Congedo, Citation2017) at a resolution of 30 m. The classification scheme was based on an adapted version of the NLCD land cover class definitions (Homer et al., Citation2004), emphasizing classes for built-up areas. Projections of the greater Arusha area were developed for 2015–2050 at 5-year intervals. To obtain an expressive characterization of the trends in the growth projections, the maps were post-processed using a methodology developed by Angel et al. (Citation2007) in which the projected built-up areas and urban development were classified into meaningful components (e.g. infill, urban extension and leapfrogging development). This ensured consistency when delineating the urban footprint and the associated descriptive statistics.
Groundwater recharge and abstraction estimation
Spatially distributed groundwater recharge for 2015 and 2050 from direct rainfall infiltration was estimated using WetSpass-M, a distributed model which computes water balance components (evapotranspiration, surface runoff and groundwater recharge) at the raster cell level (Abdollahi et al., Citation2012). The model takes into account land use type, slope, soil, depth to groundwater, evapotranspiration and temperature to estimate surface–subsurface water balances (Batelaan & De Smedt, Citation2007). LULC fractions are used as criteria weighing factors for estimating the water balance (Abdollahi et al., Citation2017). This approach makes WetSpass-M very appropriate for this study to estimate recharge and recharge variations due to LULC changes, which were then later used as input for the groundwater model.
Soil information was obtained from the Harmonized World Soil Database. Rainfall and evapotranspiration reported by GITEC (Citation2011) were used. Røhr and Killingtveit (Citation2003) derived equations for correcting the altitudinal effect on precipitation for the slopes of Kilimanjaro, ca. 50 km from Arusha. These equations were applied to estimate rainfall on the slopes of Mount Meru, which is an important recharge zone. To accommodate the uncertainties in the region’s climate projections, groundwater recharge was estimated for two climate change scenarios: (A) 10% increase in precipitation by 2050; and (B) 11% decrease in precipitation by 2050. These were the extreme cases based on the projections for Tanzania with RCP 8.5, the worst emission pathway (FCFA, Citation2017). For both scenarios, a clear warming trend is noticeable: mean annual temperature is projected to increase by between 0.8°C and 1.8°C by 2050 (FCFA, Citation2017). Therefore, an average rise of 1.3 °C in temperature was used in estimating recharge for 2050 with the WetSpass-M model.
Groundwater abstraction was mainly from water supply agency boreholes and individual private wells. The average daily groundwater abstraction and location of boreholes were obtained from AUWSSA. Abstractions from private wells and groundwater return flows were estimated at the household level. Average household size, average daily groundwater abstraction and return from unlined pit latrines and septic tanks were estimated from data obtained from a household survey carried out during a field campaign in May 2017. To avoid overestimation, groundwater abstraction and return flow were only estimated for households within the urbanized areas of the aquifer boundary. The net groundwater abstraction from private wells estimated for 2015 and 2050 (see ‘Calculation of Characteristic values’ in the online supplemental data) was used as input for the steady-state groundwater model by evenly distributing the values over urbanized cells. Historically, limited resources have been directed to water infrastructure in Arusha, especially for groundwater development. This has encouraged the widespread construction of deep and shallow private wells, which were also perceived as a more reliable source of water than AUWSSA. We therefore assumed a worst-case scenario whereby AUWSSA would not expand its groundwater abstraction capacity and so would be unable to satisfy future water demand. Therefore, groundwater abstraction by the water agency between 2015 and 2050 remained unchanged.
Groundwater model setup and description
A steady-state MODFLOW (McDonald & Harbaugh, Citation1988) groundwater model was used to simulate the water balance for 2015 and 2050. The two years were then compared to assist in exploring spatial changes in groundwater levels as the combined effect of urbanization and climate change. Our steady-state approach is essentially incorrect, since a significant part of the abstracted groundwater in both years was probably derived from storage. However, to build a useful transient model, three main categories of data are required (Zhou & Li, Citation2011): static data to construct a detailed 3D hydrogeological framework, including aquifer storage parameters; dynamic data to assess groundwater recharges and discharges (e.g. river outflows, spring discharges); and temporal data or time series of groundwater levels in the aquifer system. In the Arusha region, most of these data were not available, so the construction of a transient model was not useful. In the apparent state of groundwater depletion the aquifer complex is in, we considered the results of the steady-state model to represent a worst-case scenario, whereby the transient effect of groundwater release from storage into the model, which reduces spatial groundwater level decline patterns compared to a no-storage steady-state model set-up, was absent.
The aquifer was considered a heterogeneous unconfined/semi-confined system (Ghiglieri et al., Citation2010), and, guided by the available geophysical survey reports, the model was divided into four layers (see Figures S1 and S2 in the online supplemental data for a conceptual aquifer cross section and map view of the model set-up) with different permeability fields. All AUWSSA boreholes were located in the lowest layer, and shallow private wells in the second layer. Several studies have established that inflow into the aquifer was mainly from rainfall infiltration and fluxes from Mount Meru (Ghiglieri et al., Citation2012; GITEC, Citation2011; Kashaigili, Citation2010; Ong’or & Long-Cang, Citation2007). Head-dependent flow boundaries (Cauchy conditions; general head boundary package in MODFLOW) were used to simulate a horizontal flux from the forest area of Mount Meru and outflow in the south-east part of the aquifer. Similarly, head-dependent flow boundaries were used to simulate the two main rivers: the Burka and Themi, both flowing throughout the year, were included in the model (river package in MODFLOW).
The surface elevation was derived from Aster GDEM (https://earthexplorer.usgs.gov) with a 30 m resolution, resampled to the groundwater model grid size of 250 m. Measured groundwater level data (see above) was used as initial groundwater head and to calibrate the 2015 model.
The Parameter ESTimation (PEST) package of MODFLOW was used to determine optimized aquifer parameters, whereby general head boundary conductance, riverbed conductance, and horizontal and vertical conductivity were optimized. Several different solutions were achieved during optimization of aquifer parameters. The combination of parameters that gave the best correlation between observed and calculated head was evaluated and used for scenario calculations.
Results
Groundwater level mapping
The groundwater head distribution pattern (Figure S2a in the online supplemental data) obtained from kriging measured groundwater levels from wells, springs and AUWSSA wells indicated that flow of groundwater was from north-east to south-west, whereby in the northern part of the area flow was directed more to the west, downhill from Mount Meru, and in the southern part, the flow was south to south-east. Measured groundwater level data only covered elevations between 1100 m and 1500 m, which mostly belong to the three wards, Osunyai, Unga and Sombetini. A spring at 1750 m elevation, which was captured by AUWSSA, was used to complement groundwater head observations.
LULC change model
Analyses of the derived LULC maps revealed that Arusha’s total urban footprint grew by 287% from about 37.2 km2 in 1995 to 144.2 km2 in 2015 (; ). This represented an annual growth rate of 7% during this period, which could be attributed to Arusha’s rapid development into a major city. Urban development during this period connected the two urban cores and extended urban built-up areas primarily towards the south. An additional urbanized ‘finger’ developed on the eastern side of Arusha, creating a strip of rural open land along the north-south axis ()).
Table 1. Estimated urban footprint area in 1995 and 2015 and new development.
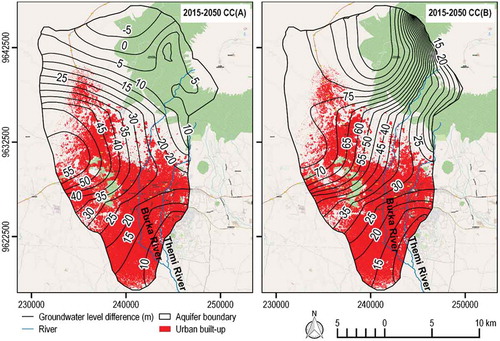
Figure 2. Combined impacts of predicted urban growth and projected climate change scenarios for 2050 on modelled groundwater level decline.
Extrapolation of the derived growth trends resulted in a projected 180% increase of the urban footprint in 2050 () compared to its 2015 size (), with an associated 23.2-year doubling period. This suggested that the urban development rate might be decreasing compared to the initial growth in the 1995–2015 interval, indicating a maturation of the initial rapid transition into the consolidation of Arusha’s growth into a regional urban hub. This was also exemplified by the projected transition of low-density suburban areas into higher-density urban built-up areas, which was expected to increase by over 300%, resulting in a vast urbanized area of approximately 208 km2 (). Pattern analysis ()) of the new development projected about 8% of urban infill and 14% of leapfrogging (disconnected growth). However, most of the new development (78%) consisted of growth along the western and southern fringes of the existing city (urban extension). Extension into a contiguous urbanized area seemed to be the result of a two-step development cycle initiated by uncontrolled leapfrogging, after which, over time, these areas connected to the existing urban core. This expansive growth behaviour often increases land fragmentation, giving rise to depreciation of land resources and declining population density, and it is an important attribute of a ‘sprawling’ city.
In Arusha, groundwater is the main water source, and on-site sanitation is very common. Leapfrogging will spatially increase the number of drilled wells and potential groundwater contamination sources, mostly pit latrines and septic tanks. The hillslopes of Mount Meru were predominantly agricultural land, and urban development initiated by leapfrogging might force agricultural lands to move further uphill to the forest areas. Since considerable recharge comes from this area (Figure S3, in the online supplemental data), displacing and forcing farmland uphill will have an effect on recharge and therefore on the development of groundwater systems below Arusha.
Recharge estimation
Groundwater recharge was estimated to be 107 mm/y (), close to the groundwater recharge estimate of 114 mm/y for the Arusha area by GITEC (Citation2011). The estimated recharge decreased by 23% in 2050 () due to LULC changes resulting from the predicted urban growth (business as usual, or without climate change; ). In climate change Scenario A (10% precipitation increase, 1.3 °C temperature increase) groundwater recharge further decreased by 30% of the 2015 value (), while in Scenario B (11% precipitation decrease, 1.3 °C temperature increase) groundwater recharge decreased 44% (). Irrespective of a predicted increase or decrease of precipitation (Figure S4, in the online supplemental data), increasing air temperature played a key role in reducing groundwater replenishment.
Table 2. Groundwater recharge from rainfall.
Groundwater model
Details on the groundwater model calibration and water balance results are given in the online supplemental data. The changes in groundwater levels between 2015 and 2050 were compared for scenarios including business as usual only, as well as combined scenarios of business as usual and climate change. The changes in groundwater levels between 2015 and 2050 in business as usual plus Scenarios A and B yielded a groundwater drawdown pattern, which increased towards the west part of the aquifer and elongated north–south (). The north–south elongation of the depression is due to the high difference in head gradient in the slopes of Mount Meru. For Scenario A, in which future rainfall increased by 10%, groundwater levels decreased by 10–55 m in the southern part of the area (). This decrease was larger than observed when only urbanization scenarios were considered (40–55 m; Figure S6 in the online supplemental data).
The southern part was dominated by dense urban clusters, and much of the predicted growth occurred there as well. Arusha largely relies on groundwater, and the predicted urban growth had a dual impact: more groundwater abstraction and less groundwater recharge, resulting from LULC changes. The increasing future temperature trend also limited the amount of rainfall infiltrating into groundwater, despite a 10% increase in rainfall. If the observed urban growth pattern persists and future rainfall shifts towards a positive side, this scenario might be the best case to expect for future groundwater in Arusha.
The opposing rainfall direction in Scenario B only further intensified the effects of urbanization on groundwater level drop. Due to the combined effects of urbanization and climate change Scenario B, groundwater levels dropped between 15 m and 75 m in the southern part of the aquifer (). This implies that the effects of urbanization might be exacerbated by those of future climate change and that more impacts will be felt if the climate shifts towards Scenario B.
Discussion
We find that between 2015 and 2050, Arusha will rapidly grow to 179% the size of its 2015 urban footprint. Due to the increased impervious surface area, groundwater recharge will be reduced by 23%, and groundwater levels in the modelled groundwater basin, which encompasses a large part of western and south-western urban Arusha and the surrounding area, are expected to drop 55 m at most. Considering climate change as well, groundwater recharge may fall 30–44% by 2050, causing groundwater levels to drop at most 75 m. Interestingly, this greater reduction (30–44% vs. 23%) was mainly due to a stronger warming trend in the Arusha region, giving rise to more evapotranspiration and less groundwater recharge.
The scenarios we considered were the extreme ones based on the projections for Tanzania under RCP 8.5, which is the worst emission pathway (FCFA, Citation2017). A clear warming trend is apparent in both scenarios, with mean annual temperatures expected to increase by between 0.8 °C and 1.8 °C by 2050 (FCFA, Citation2017). Other general circulation models (Christensen et al., Citation2007; Serdeczny et al., Citation2017) also show a clear warming trend in SSA. Similar and higher temperature increases were calculated for West Africa (FCFA, Citation2016), South Africa (Daron, Citation2014) all of Africa (Engelbrecht et al., Citation2015; Niang et al., Citation2014). Urbanization rates in SSA have been reported by UN/DESA (Citation2015) and Dos Santos et al. (Citation2017), among others, whereby usually present and future population numbers are estimated. In our case, we arrived at a modelled annual change of the urban footprint of 3% in 2015–2050 (). The average annual population growth of urban agglomerations in SSA is projected to vary between 4% and 5% in 2016–2030 (UN/DESA, Citation2015; Dos Santos et al., Citation2017). Although there is no linear relationship between urban population and urban footprint, we are confident that the modelled increase in footprint would produce figures that are comparable to the reported population growth.
Our results imply that by 2050, climate change will reduce groundwater recharge by 7–21%. But most (23%) of this reduction is caused by urbanization, due the transformation of vegetated area into impervious areas (roads, roofs and other paved surfaces). As a result, surface runoff and evapotranspiration increased, while groundwater recharge decreased. In reality, the conversion from vegetated to impervious area and associated changes in water balance terms is more complex, and the outcomes are not straightforward. On the one hand, because parts of the catchment’s surface will become impermeable to water, urban expansion will lower the total infiltration capacity of the soil surface in the catchment; but on the other hand the urbanized area also contains gardens and parks, which have a higher infiltration capacity (Poelmans et al., Citation2010). Furthermore, as was pointed out by Gwenzi and Nyamadzawo (Citation2014), in the urbanized area, utility trenches, tunnels and buried structures form a complex network resembling a shallow urban karst system, which may provide preferential flow pathways for groundwater recharge. Please note that here we discuss only changes in recharge from precipitation. As pointed out in the Methods section and in the online supplemental data, recharge from wastewater infiltration was taken into account in the abstraction term of the water balance. Furthermore, leakage from the water supply mains is likely to be substantial, but, due to the limited network in the modelled area, leakage was assumed to be insignificant.
The estimated lowering of groundwater levels by on the order of 50–75 m by 2050 as a result of urbanization and future climate change will likely have major consequences. If such a scenario becomes reality, we predict that springs will dry up, wells will run dry, wetlands and urban green areas will disappear, the price of water will increase, agricultural produce will become more expensive, and the number of cash crops will shrink. As a result, tensions will increase, and power struggles for water will intensify. We predict that the general economic, social and environmental situation in Arusha will worsen. It should also be noted that most of the shallow groundwater resources are in use by the poor part of the population, mostly living in informal areas scattered throughout Arusha and having limited access to basic services like water, sanitation and electricity. Furthermore, this shallow groundwater is contaminated due to the on-site infiltration of wastewater. Also, based on fieldwork we carried out in the region (Nastar et al., Citation2018), at present, the poor communities already pay more for water than richer communities.
As in any forecast or projection, the limitations of our study and the robustness of the outcomes rely heavily on data, modelling conceptualization and associated simplifications and assumptions. For instance, the LULC cover projections are largely dependent on the quality of the LULC maps. In turn, the interval between the base maps used to ‘train’ the model (1995 and 2015) determine the robustness of the growth projections. Veerbeek (Citation2017) provides a deeper discussion of these issues. Second, the outcomes of the entire groundwater modelling exercise depend heavily on the quality of the data inputs. In this regard, as mentioned in the Methodology section, the precipitation distribution we used was based on precipitation data for Mount Kilimanjaro, as these data were lacking for Mount Meru. In addition, as stated above, the conversion from vegetated to impervious area is a complex process (effect of increased paved surfaces, effect of increased infiltration capacity in gardens, parks, and small agricultural plots, effect of urban karst) for which there is no data. Furthermore, as mentioned in the Methods Section, the choice of a steady-state model in our work was conceptually incorrect, as some of the groundwater is abstracted from storage. However, as explained, due to data limitations, a transient model was not considered useful. Although the use of a steady-state model in this groundwater depletion situation could be considered a worst-case scenario, the results we obtained with the groundwater model merely indicate the order of magnitude of groundwater level decline.
As mentioned in the Introduction, groundwater reserves make cities or areas more robust to climate change. In Arusha, however, groundwater is over-consumed, with adverse effects, as described above. The question then is, how should Arusha adapt to and/or mitigate the changes? The ideal vehicle for both types of interventions seems to be the Arusha 2035 urban plan, but it makes no mention of how the future growth of the city should be supported in terms of satisfying future water demands, other than drilling more groundwater wells, and thus increasingly depleting the resource. In fact, the plan seems to be echoing the desire to leapfrog systematic transition to modernity (Lwasa et al., Citation2018), which will surely cause harm in terms of speeding up degradation of ecosystems, limiting economic opportunity, and accentuating social inequality. Such pathways will most certainly lead to a lock-in situation whereby increasing returns to adoption can lead to lock-in of incumbent technologies, which, on their turn, would eventually lead to a more sustainable, climate and change resilient future.
The situation observed in Arusha seems not to be unique. Many of the largest urban agglomerations in SSA (Dos Santos et al., Citation2017; UN/DESA, Citation2015) are in areas where groundwater is an important resource for a (large) part of the urban population, and more so by the urban poor. These agglomerations include Lagos, Nigeria (at present 13.6 million inhabitants), Dar es Salaam, Tanzania (5.4 million), Ouagadougou, Burkina Faso (2.8 million), Bamako, Mali (2.7 million), Abuja, Nigeria (2.5 million), Mogadishu, Somalia (2.3 million), Lusaka, Zambia (2.3 million), Kampala, Uganda (2.0 million), and N’Djamena, Chad (1.3 million), to name a few. All suffer from high to very high average annual rates of population growth, and in all of them rising temperatures are foreseen with climate change. We foresee that by 2050, the limited availability of groundwater will be another factor hampering the progress of urban Sub-Saharan Africa.
Supplemental Material
Download PDF (1,013.7 KB)Acknowledgments
This work was carried out in the framework of the T-GroUP project. T-GroUP was funded by the UK Department for International Development, the Economic and Social Research Council and the Natural Environment Research Council (NERC) under the UPGro Programme, NERC grant no. NE/M008045/1. We thank the people of Arusha for their support.
Disclosure statement
No potential conflict of interest was reported by the authors.
Supplementary material
Supplemental data for this article can be accessed at https://doi.org/10.1080/02508060.2020.1768724.
Additional information
Funding
References
- Abdollahi, K., Bashir, I., & Batelaan, O. (2012). WetSpaSS graphical user interface. Cartography of Higher Swiss Education. http://www.e-cartouche.ch/content_reg/cartouche/ui_access/en/html/UnitGUI_DefGUI.html
- Abdollahi, K., Bashir, I., Verbeiren, B., Harouna, M. R., Van Griensven, A., Huysmans, M., & Batelaan, O. (2017). A distributed monthly water balance model: Formulation and application on Black Volta Basin. Environmental Earth Sciences, 76(5). https://doi.org/10.1007/s12665-017-6512-1
- Agterberg, F. P., & Bonham-Carter, G. F. (1990, September). Deriving weights of evidence from geoscience contour maps for the prediction of discrete events. Proceedings of the 22nd APCOM Symposium, Berlin, Germany (Vol. 2, pp. 381–395).
- Agwanda, A., & Amani, H. (2014). Population growth, structure and momentum in Tanzania. Economic and Social Research Foundation. THDR 2014 ESRF discussion paper 61. Retrieved 26 July 2017 from http://www.thdr.or.tz/docs/THDR-BP-7.pdf
- Angel, S., Parent, J., & Civco, D. (2007). Urban sprawling metrics: An analysis of global urban expansion using GIS. Proceedings of ASPRS 2007 annual conference (pp. 1–12). Tampa, Florida.
- Batelaan, O., & De Smedt, F. (2007). GIS-based recharge estimation by coupling surface-subsurface water balances. Journal of Hydrology, 337(3–4), 337–355. https://doi.org/10.1016/j.jhydrol.2007.02.001
- Batty, M. (2007). Cities and complexity: Understanding cities with cellular automata, agent- based models, and fractals. MIT press.
- Calow, R., & Macdonald, A. (2009). What will climate change mean for groundwater supply in Africa? Overseas Development Institute. . https://www.odi.org/sites/odi.org.uk/files/odi-assets/publications-opinion-files/4120.pdf
- Carter, R. C., & Parker, A. (2009). Climate change, population trends and groundwater in Africa. Hydrological Sciences Journal, 54(4), 676–689. https://doi.org/10.1623/hysj.54.4.676
- Case, M. (2006). Climate change impacts on East Africa. Report. WWF-World Wide Fund for Nature. https://doi.org/10.1007/978-3-642-14776-0_36
- Christensen, J. H., Hewiston, B., Busuioc, A., Chen, A., Gao, X., Held, I., Jones, R., Kolli, R. K., Kwon, W. T., Laprise, R., Magana, R. V., Mearns, L., Menendez, C. G., Räisänen, J., Rinke, A., Sarr, A., & Whetton, P. (2007). Regional climate projections. In S. Solomon et al. (Eds.), Climate change 2007: The physical science basis. Contribution of Working Group I to the fourth assessment report of the Intergovernmental Panel on Climate Change. Cambridge University Press. https://doi.org/10.1080/07341510601092191
- Clark, D. (1998). Interdependent urbanization in an urban world: An historical overview. Geographical Journal, 164(1), 85–95. https://doi.org/10.2307/3060547
- Congedo, L. (2017). Semi-automatic classification plugin documentation. Release, 4(1), 29. https://doi.org/10.13140/RG.2.2.29474.02242/1.
- Daron, J. D. (2014). Regional climate messages for Southern Africa. Scientific report from the CARIAA Adaptation at Scale in Semi-Arid Regions (ASSAR) Project, 1–30. International Development Research Centre. http://www.assar.uct.ac.za/sites/default/files/image_tool/images/138/RDS_reports/climate_messages/Southern%20Africa%20Climate%20Messages%20-%20Version%201%20-%20Regional%20Level.pdf
- Dos Santos, S., Adams, E. A., Neville, G., Wada, Y., de Sherbinin, A., Mullin Bernhardt, E., & Adamo, S. B. (2017). Urban growth and water access in Sub-Saharan Africa: Progress, challenges, and emerging research directions. Science of the Total Environment, 607–608(2017), 497–508. https://doi.org/10.1016/j.scitotenv.2017.06.157
- EGIS. (2017). Consultancy service for additional water sources investigations (quantity and quality including treatment options) and study on lake Duluti. Final Study Report. Arusha Urban Water Supply and Sanitation Authority (AUWSA).
- Engelbrecht, F., Adegoke, J., Bopape, M. J., Naidoo, M., Garland, R., Thatcher, M., McGregor, J., Katzfey, J., Werner, M., Ichoku, C., & Gatebe, C. (2015). Projections of rapidly rising surface temperatures over Africa under low mitigation. Environmental Research Letters, 10(8), 085004. https://doi.org/10.1088/1748-9326/10/8/085004
- EWURA. (2015). Water Utilities Performance Review Report 2014/2015. Energy and Water Utilities Regulatory Authority, Tanzania.
- Foster, S. S. D., Morris, B. L., & Chilton, P. J. (1999). Groundwater in urban development: A review of linkages and concerns. In Proceedings of impacts of urban growth on surface water and groundwater quality. IUGG 99 Symposium, Birmingham. IAHS Publication no. 259. http://hydrologie.org/redbooks/a259/iahs_259_0003.pdf
- FCFA. (2016). Africa's climate: Helping decision makers make sense of climate. Future Climate for Africa. www.futureclimateafrica.org/wp-content/uploads/2016/11/africas-climate-final-report-4nov16.pdf www.futureclimateforafrica.org
- FCFA. (2017). Future climate projections for Tanzania. Future Climate for Africa. www.futureclimateafrica.org/resource/future-climate-projections-for-tanzania/ www.futureclimateforafrica.org
- Ghiglieri, G., Balia, R., Oggiano, G., Ardau, F., & Pittalis, D. (2008). Hydrogeological and geophysical investigations for groundwater in the Arumeru District (Northern Tanzania). Rendiconti Online Della Societa Geologica Italiana, 2, 1–3.
- Ghiglieri, G., Balia, R., Oggiano, G., & Pittalis, D. (2010). Prospecting for safe (low fluoride) groundwater in the Eastern African Rift: The Arumeru District (Northern Tanzania). Hydrology and Earth System Sciences, 14(6), 1081–1091. https://doi.org/10.5194/hess-14-1081-2010
- Ghiglieri, G., Pittalis, D., Cerri, G., & Oggiano, G. (2012). Hydrogeology and hydrogeochemistry of an alkaline volcanic area: The NE Mt. Meru slope (East African Rift-Northern Tanzania). Hydrology and Earth System Sciences, 16(2), 529–541. https://doi.org/10.5194/hess-16-529-2012
- GITEC. (2011, May). Groundwater assessment of the Pangani Basin, Tanzania. Pangani Basin Water Board and International Union for Conservation of Nature. Draft Final Report.
- Goodacre, A. K., Bonham-Carter, G. F., Agterberg, F. P., & Wright, D. F. (1993). A statistical analysis of the spatial association of seismicity with drainage patterns and magnetic anomalies in western Quebec. Tectonophysics, 217(3–4), 285–305. https://doi.org/10.1016/0040-1951(93)90011-8
- Gwenzi, W., & Nyamadzawo, G. (2014). Hydrological impacts of urbanization and urban roof water harvesting in water-limited catchments: A review. Environmental Processes, 1(4), 573–593. https://doi.org/10.1007/s40710-014-0037-3
- Homer, C., Huang, C., Yang, L., Wylie, B., & Coan, M. (2004). Development of a 2001 national land-cover database for the United States. Photogrammetric Engineering & Remote Sensing, 70(7), 829–840. https://doi.org/10.14358/PERS.70.7.829
- Kashaigili, J. J. (2010). Assessment of groundwater availability and its current and potential use and impacts in Tanzania. Report prepared for the International Water Management Institute (IWMI), Colombo, Sri Lanka. Retrieved 14 April 2020 from http://www.suaire.sua.ac.tz:8080/xmlui/handle/123456789/1484
- Kessides, C. (2006). The urban transition in Sub-Saharan Africa: Implications for economic growth and poverty reduction. The Cities Alliance.
- Lemaire, B. (2017, June). Arusha Sustainable Urban Water and Sanitation Delivery Project Consultancy Services for Additional Water Sources Investigations (Quantity And Quality Including Treatment Options) and Study on Lake Duluti. Final study report.
- Lwasa, S., Buyana, K., Kasaija, P., & Mutyaba, J. (2018). Scenarios for adaptation and mitigation in urban Africa under 1.5 °C global warming. Current Opinion in Environmental Sustainability, 30, 52–58. https://doi.org/10.1016/j.cosust.2018.02.012
- Mahmoud, S. H., Alazba, A. A., & Chapman, M. G. (2015). Hydrological response to land cover changes and human activities in arid regions using a geographic information system and remote sensing. PLoS One, 10(4), e0125805. https://doi.org/10.1371/journal.pone.0125805
- Mas, J. F., Kolb, M., Paegelow, M., Olmedo, M. T. C., & Houet, T. (2014). Inductive pattern-based land use/cover change models: A comparison of four software packages. Environmental Modelling & Software, 51, 94–111. https://doi.org/10.1016/j.envsoft.2013.09.010
- McDonald, M. G., & Harbaugh, A. W. (1988). A modular three-dimensional finite-difference ground-water flow model (Techniques of Water-Resources Investigations 06-A1). Retrieved 14 April 2020 from https://pubs.er.usgs.gov/publication/twri06A1
- Morris, B. L., Lawrence, A. R. L., Chilton, P. J. C., Adams, B., Calow, R. C., & Klinck, B. A. (2003). Groundwater and its susceptibility to degradation: A global assessment of the problem and options for management (Early Earning and Assessment Report Series, RS. 03-3). United Nations Environment Programme. http://nora.nerc.ac.uk/id/eprint/19395/1/Groundwater_INC_cover.pdf
- Nastar, M., Abbas, S., Aponte Rivero, C., Jenkins, S., & Kooy, M. (2018). The emancipatory promise of participatory water governance for the urban poor: Reflections on the transition management approach in the cities of Dodowa, Ghana and Arusha, Tanzania. African Studies, 77(4), 504–525. https://doi.org/10.1080/00020184.2018.1459287
- NBS and Office of Chief Statistician Zanzibar. (2013). 2012 Population and housing census: Population distribution by administrative areas. United Republic of Tanzania, Dar es Salaam
- NBC. (2014). Basic demographic and socio-economic profile statistical tables, Tanzania mainland. National Bureau of Statistics, Ministry of Finance, Dar es Salaam, The United Republic of Tanzania.
- Niang, I., Ruppel, O. C., Abdrabo, M. A., Dube, P., Leary, N., Schulte-Uebbing, L., … White, L. (2014). Africa. In V. R. Barros, C. B. Field, D. J. Dokken, M. D. Mastrandrea, K. J. Mach, T. E. Bilir, M. Chatterjee, K. L. Ebi, & Y. O. Estra (Eds.), Climate change 2014: Impacts, adaptation, and vulnerability. Part B: Regional aspects. Contribution of Working Group II to the fifth assessment report of the Intergovernmental Panel on Climate Change (pp. 1199–1265). Cambridge University Press. https://www.ipcc.ch/pdf/assessment-report/ar5/wg2/WGIIAR5-Chap22_FINAL.pdf
- Oikos, I. (2011). The Mount Meru challenge: Integrating conservation and development in Northern Tanzania. Ancora Libri. www.istituto-oikos.org
- Ong’or, B. T. I., & Long-Cang, S. (2007). Groundwater overdraft vulnerability and environmental impact assessment in Arusha. Environmental Geology, 51(7), 1171–1176. https://doi.org/10.1007/s00254-006-0408-9
- Parnell, S., & Walawege, R. (2011). Sub-Saharan African urbanisation and global environmental change. Global Environmental Change, 21(SUPPL. 1), S12–S20. https://doi.org/10.1016/j.gloenvcha.2011.09.014
- Poelmans, L., Van Rompaey, A., & Batelaan, O. (2010). Coupling urban expansion models and hydrological models: How important are spatial patterns? Land Use Policy, 27(3), 965–975. https://doi.org/10.1016/j.landusepol.2009.12.010
- Rodrigues, H., & Soares-Filho, B. (2018). A short presentation of Dinamica EGO. In M. T. Camacho Olmedo, M. Paegelow, J.-F. Mas, & F. Escobar (Eds.), Geomatic approaches for modeling land change scenarios (pp. 493–498). Springer. https://doi.org/10.1007/978-3-319-60801-3_35
- Røhr, P. C., & Killingtveit, Å. (2003). Rainfall distribution on the slopes of Mt Kilimanjaro. Hydrological Sciences Journal, 48(1), 65–77. https://doi.org/10.1623/hysj.48.1.65.43483
- Serdeczny, O., Adams, S., Baarsch, F., Coumou, D., Robinson, A., Hare, W., Schaeffer, M., Perrette, M., & Reinhardt, J. (2017). Climate change impacts in Sub-Saharan Africa: From physical changes to their social repercussions. Regional Environmental Change, 17(6), 1585–1600. https://doi.org/10.1007/s10113-015-0910-2
- Shukla, P. R., Skea, J., Slade, R., van Diemen, R., Haughey, E., Malley, J., Pathak, M., & Portugal Pereira, J. (eds.) (2019). Technical Summary, 2019 (Climate Change and Land: an IPCC special report on climate change, desertification, land degradation, sustainable land management, food security, and greenhouse gas fluxes in terrestrial ecosystems). Retrieved 12 April 2020 from https://www.ipcc.ch/site/assets/uploads/sites/4/2019/11/03_Technical-Summary-TS.pdf
- Taylor, R., & Barrett, M. (1999). Urban groundwater development in Sub-Saharan Africa. Proceedings of 25th WEDC Conference, Integrated Development for Water Supply and Sanitation, Addis Ababa, Ethiopia.
- Taylor, R. G., Barrett, M. H., & Tindimugaya, C. (2004). Urban areas of Sub-Saharan Africa; weathered crystalline aquifer systems. In D. Lerner (Ed.), Urban groundwater pollution (pp. 155–179). Balkema.
- Taylor, R. G., Koussis, A. D., & Tindimugaya, C. (2009). Groundwater and climate in Africa: A review. Hydrological Sciences / Journal des sciences hydrologiques, 54(4), 655–664. https://doi.org/10.1.1.693.6273&rep=rep1&type=pdf
- Thomas, K. J. A., & Zuberi, T. (2012). Demographic change, the IMPACT model, and food security in Sub-Saharan Africa. Working paper. United Nations Development Program, Regional Bureau for Africa.
- UN/DESA. (2015). World urbanization prospects: The 2014 revision (ST/ESA/SER.A/366). United Nations, Population Division. http://esa.un.org/Unpd/Wup/
- Veerbeek, W. (2017). Estimating the impacts of urban growth on future flood risk: A comparative study. CRC Press. http://resolver.tudelft.nl/uuid:4f081b83-b03f-4358-abb3-efab1111aff4
- Veerbeek, W., Pathirana, A., Ashley, R., & Zevenbergen, C. (2015). Enhancing the calibration of an urban growth model using a memetic algorithm. Computers, Environment and Urban Systems, 50, 53–65. https://doi.org/10.1016/j.compenvurbsys.2014.11.003
- Wenban-smith, H. (2015). Population growth, internal migration and urbanization in Tanzania, 1967-2012. Working paper. International Growth Centre, Phase 2 Final Report.
- Yi, W., Gao, Z., & Chen, M. (2012). Dynamic modelling of future land-use change: A comparison between CLUE-S and Dinamica EGO models. In Remote sensing and modeling of ecosystems for sustainability IX (Vol. 8513, pp. 85130H). International Society for Optics and Photonics.
- Zhou, Y., & Li, W. (2011). A review of regional groundwater flow modeling. Geoscience Frontiers, 2(2), 205–214. https://doi.org/10.1016/j.gsf.2011.03.003