
ABSTRACT
This study examines the impact of infrastructure and residents’ water usage patterns (internal factors) and climate (external factor) on household water consumption. Through quantitative information from the service provider and qualitative data from 900 surveys in three areas with different socio-economic levels (high, middle and low) in the Lima metropolitan area, an average user profile is determined for each area. The results are further assessed and compared to establish the impact of internal and external factors on water consumption. These results help in establishing water handling policies and developing residential infrastructure design for efficient and sustainable use of water.
Introduction
Peru ranks 17th among countries in freshwater scarcity for the urban population (FAO, Citation2016), and severe water stress is foreseen by 2040 (Luo et al., Citation2015), especially in several fast-growing desert and semi-desert megacities, such as Lima (Biswas et al., Citation2004). Moreover, due to climate change, water is already scarce, and the growing population is increasing demand (United Nations Human Settlements Programme, Citation2011), causing a crisis in the city’s water system, especially in densely populated lower-income districts (World Bank Group, Citation2016).
Figure 1. Classification of the variables affecting household water consumption. The coloured areas represent the aspects to be developed in this research. (Prepared by the author)
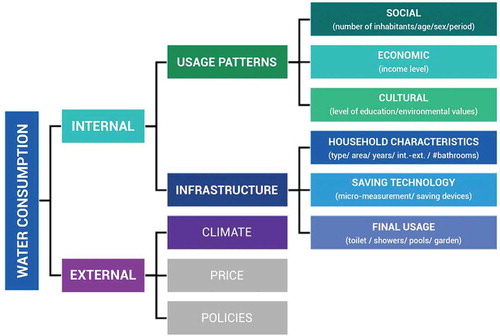
Figure 2. Water-saving strategies mentioned in the reviewed literature, prepared using information from Abderrahman (Citation2000), Araral and Wang (Citation2013), Da-ping et al. (Citation2011), Grafton et al. (Citation2011), Koh (Citation2020), Lowe et al. (Citation2015), Oliver and Brümmer (Citation2007), Sánchez García and Blanco Jiménez (Citation2012), Saurií (2003), and Tate (Citation1989)
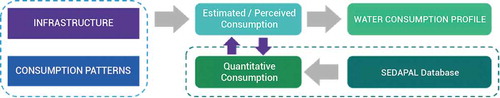
Figure 3. Estimated versus quantitative consumption
According to the World Health Organization, 100 litres of water per day are needed to optimally meet an individual’s basic needs (Howard et al., Citation2003). Considerable inequality in resource use exists in the Lima metropolitan area. According to local water service provider records, in some wealthier districts the consumption ranges from 260 to 445 litres per person per day, while in in lower-income districts it is from 16 to 41 litres per person per day (AQUAFONDO et al., Citation2016; SEDAPAL, Citation2017).
External and internal factors affect household water consumption. External factors such as climate, price, public policies and population growth tend to be indirect and cannot be controlled by the user. However, internal factors like dwelling type, devices, number of household members, and lifestyle directly impact and are controlled by the user. Moreover, these factors imply water usage patterns and infrastructure, which constitute the differences in water consumption in various districts. Although the external factors influence the internal ones, this research prioritizes the analysis of internal factors because they are directly related to the user.
The internal factors, represented by people’s consumption patterns or lifestyle, affect the consumption of safe drinking water (Sánchez García & Blanco Jiménez, Citation2012); the variables that influence the consumption patterns will be discussed later in the article. Defining consumer behaviour concerning water use helps in making relevant decisions for the implementation of systems aimed at reducing use of the resource (Shan et al., Citation2015). Infrastructure also affects water consumption. In urban areas, particularly in the residential sector, the implementation of water management policies and the promotion of appropriate infrastructure for the resources’ efficient and sustainable use are needed. This is because, besides aligning with Sustainable Development Goals 6 and 11, they benefit both entities and users (Manco et al., Citation2012).
There is an information gap regarding the relationship between house infrastructure and water consumption in Peru, where an initial code for water efficiency exists, but is not obligatory.Footnote1 Although data on water consumption in districts in the Lima metropolitan area are available, no database exists on the water use patterns and the impact of infrastructure on water consumption. This limits proposals for water conservation solutions based on local data.
Through the collection of quantitative and qualitative data from three districts in the Lima metropolitan area, this research determines an average user profile considering three socio-economic levels and subsequently establishes the impact of internal and external factors on water consumption in each case. The first section of this article outlines the research objective and its justification in addition to summarizing the water situation in Lima. The next section reviews the literature on factors influencing water consumption and classifies the reviewed variables. The third section reviews our primary methodology, and the fourth presents the results. The last section discusses the interpretation of the results and provides recommendations in accordance with the case studies.
Literature review
Water resources in the Lima metropolitan area
Peru contains approximately 5% of the world’s freshwater, with about 74,000 m3 per person per year (Comité Nacional del Libro Azul para el Perú, Citation2016, p. 36).Footnote2 In 2008, of the total amount of extracted water, 88.7% was used for agricultural purposes, 9.2% for municipal use, and 2.1% for industrial use (including 1.1% for mining). Furthermore, 75% of the population lives in the urban area. Although 26.2 million residents have a water connection, 4.2 million do not and need to get water by other means (p. 52).
Lima gets almost no rain (7.7 mm/y).Footnote3 Of the national population, 35% live in this city, which has 9,900,000 inhabitants and an average population density of 3,300 per km2 (INEI, Citation2015). Lima has three basins, with a total water supply of 36.6 m3/s (Comité Nacional del Libro Azul para el Perú, Citation2016, p. 39).Footnote4 This resulted in unmet water demand of 3.25 m3/s in 2013 and 3.33 m3/s in 2015 (AQUAFONDO et al., Citation2016), as well as a gap in the service between the central areas, covered by 92%, and the peri-urban areas by 50%, wherein 33% of the population lives in extreme poverty and is supplied water through tanker trucks (Kámiche, Citation2012).Footnote5 In other words, 1.5 million citizens do not have secure access to drinking water (INEI, Citation2016). In addition, the drinking water network is in disrepair, with losses from leakage due to an old piping system, low maintenance and illegal connections. The losses amount to more than 36% of the processed and treated water supply (SWITCH, Citation2011), which is close to the average in Latin America (38%); where the maximum is 51% in Costa Rica and the minimum 34% in Argentina (Lentini, Citation2015).
Internal and external factors affecting household water consumption
The factors affecting water consumption, and its various components, are mentioned and classified through different approaches in the literature. illustrates these factors based on the criteria adopted for this research, with climate as the external factor, and further examines the internal aspects in detail.
Internal factors
Internal factors include usage patterns and infrastructure. Usage patterns include social, economic and cultural aspects, whereas infrastructure involves the dwelling type, technology of existent devices, and consumption related to the rooms where the service is used (kitchen, laundry, and sanitary facilities).
Usage patterns
Usage patterns were classified into social, economic and cultural (Barberán & Salvador, Citation2010; Manco Silva et al., Citation2012), and the location of some variables were reformulated accordingly. Education and population characteristics (age, sex and number of household members) were included because of their potential to achieve important savings (Lowe et al., Citation2015).
From the social perspective, the primary conditions for the consumption estimate include number of household members (Cubillo et al., Citation2008), social stratum, education (Manco et al., Citation2012), and active hours (Oliver & Brümmer, Citation2007). The most populous strata are the most resource-consuming (Peña-Guzman et al., Citation2016); thus, the greater population density represents a change in household drinking water consumption (Fercovic & Melo, Citation2010). Although more people in a household means greater consumption, consumption per capita decreases (Barberán & Salvador, Citation2010; Ojeda-De la Cruz et al., Citation2016). Fewer people per household means lower consumption (Rockaway et al., Citation2011).
In terms of those occupying the household, the population can be floating or resident (Sánchez García & Blanco Jiménez, Citation2012) and of different sex or age ranges (Shan et al., Citation2015). Also, consumption patterns relate to socio-demographic levels, and the amount consumed per person is similar in many cases, especially among wealthier people (Loureiro et al., Citation2006), enabling us to extrapolate values in similar districts.
Cultural factors are crucial in assessing water consumption behaviour and weighing the implementation (or not) of efficiency measures. These include variables such as lifestyle, values, standards and social models, behaviour-related environmental beliefs, and education, in addition to maintenance (drips and leaks) and management (inspection frequency, reports, and speed of response) (Oliver & Brümmer, Citation2007), which are not included in the present research but are important to mention for future studies. Environmental concern and education increase the adoption of water-saving devices (Grafton et al., Citation2011) and influence the use, proper maintenance and sound administration of infrastructure (Barberán & Salvador, Citation2010).Footnote6 Finally, the provision of disaggregated data on consumption helps minimize it (Shan et al., Citation2015).
The economic factors include two internal components of the household economy: purchasing power or income per capita (Sánchez García & Blanco Jiménez, Citation2012) and income level (Cubillo et al., Citation2008) or family budget (Durán, Citation2015); however, this does not include the water price (an external factor). Moreover, income and consumption should be distinguished. On the one hand, Mainieri et al. (1997, as cited by Harlan et al., Citation2009) mentioned that there are reasons to think that affluence might reduce water use, as wealthier people live in newer, more efficient homes; on the other hand, a high family income means bigger houses and larger green areas, leading to higher water consumption (Rockaway et al., Citation2011), so there is a direct link between income and consumption (Shan et al., Citation2015).
Some authors mostly attribute this ratio to people’s resistance to changing their habits; for example, although a high family income facilitates the purchase of smart devices, the habit of doing laundry frequently reduces the potential savings (Shan et al., Citation2015). In contrast, a low-income family may not be able to buy smart devices, but it may adopt water-saving habits. Finally, high-income families have more stable consumption patterns and are less flexible with regard to price than low-income families (Grafton et al., Citation2011).
Residential water use does not respond immediately to price variations, either. In particular, water for essential uses (such as drinking, cooking and personal hygiene) is expected to be highly inelastic because a large share of the consumed water depends on durable equipment or on habits developed over time (Martínez-Espiñeira & Nauges, Citation2004). To have the desired effect, pricing changes must be accompanied by changes in regulations and awareness, as well as knowledge about consumers (Barrett, Citation2004). This happened in Sidney in the late 1970s, as mentioned by Davies (cited in Lucas & Cordery, Citation2019).
According to Hurd (2006), public education and awareness can lead to significant changes in consumer behaviour, but on the other hand, Gutzler and Nims (2005), Hamilton (1983) and De Oliver (1999) found that higher-income families do not respond as easily as lower-income households to educational conservation campaigns (all these are cited by Harlan et al., Citation2009).
Infrastructure
Water consumption linked with infrastructure mostly depends on two central dwelling features: size and sanitary infrastructure. The variables include type of house, size, age, the presence of swimming pools and gardens, and the current type of water-saving technology (Cubillo et al., Citation2008; Domene & Saurí, Citation2006; Shan et al., Citation2015).
In terms of dwelling features, the type of building (single-family home, multi-family dwelling, condominium) and the housing density affect water consumption, as does family size; consequently, certain economies of scale do not apply to small households (Domene & Saurí, Citation2006). On average, a single-family home consumes 330 more litres of water per day than a multi-family dwelling, mostly because they have green areas and swimming pools (Cubillo et al., Citation2008). Also, the bigger the house, the more complex is the adjustment to include new water-saving infrastructure (Rockaway et al., Citation2011), because larger homes tend to have more rooms and more appliances to replace.
No consensus exists on whether water-saving technology (dual-flush toilets, efficient bathroom fittings, pressure reducers, meters) reduces consumption (Oliver & Brümmer, Citation2007) and always results in lower water use (Grafton et al., Citation2011) or even increases it (Freire-González, Citation2019). The installation of meters benefits both the EPSFootnote7 (up to 50%) and the users (Silva et al., Citation2012), providing savings of 20% (Manco Silva et al., Citation2012). Although meters raise awareness of water consumption, the biggest motivation, particularly in low-income districts, is saving money (Shan et al., Citation2015; Lee et al., Citation2013; Sims et al., Citation2013). However the implementation of water-saving technology is less frequent in lower-income households (Clarke & Brown, Citation2006), and to be effective, additional measures such as taxation should be implemented (Freire-González, Citation2019).
Authors have classified final water use into hydration, food, personal hygiene, tableware, laundry and drainage, among other categories, e.g., irrigation, car washing, and leisure (Castillo-Avalos & Rovira-Pinto, Citation2013; Rockaway et al., Citation2011). Identifying water’s final use helps us see where adjustments should be made to reduce consumption (Manouseli et al., Citation2019).Footnote8 For outdoor water, several passive technologies (limitation of sidewalk washing or irrigation during peak hours) offer savings of 29%, and water-saving modification tools save 9% (Otaki et al., Citation2011).
External factors
Price
The price of water is an effective and highly influential external factor, one of the most common mechanisms to reduce consumption (Durán, Citation2015; Sánchez García & Blanco Jiménez, Citation2012; Grafton et al., Citation2011; Peña-Guzman et al., Citation2016; Shan et al., Citation2015). But some authors have concluded that consumption tends to be rigid in terms of price (Domene & Saurí, Citation2006), while others have seen a negative relationship between price and consumption (Grafton et al., Citation2011) or that small households adapt best to price variation, reducing their consumption (Barberán & Salvador, Citation2010).
Climate
Three aspects should be considered in the context of climate: average rainfall, average temperature, and the Palmer drought index (Rockaway et al., Citation2011) or relative humidity (Manco Silva et al., Citation2012) – together referred to as ‘climatology’ (Sánchez García & Blanco Jiménez, Citation2012). More specific metrics include maximum temperature and the number of rainy days (Barberán & Salvador, Citation2010). A close association exists among temperature, rainfall, and residential water consumption per capita, with changing patterns and higher consumption in the summer (Fercovic & Melo, Citation2010). This is more true in low-density houses (probably owing to the presence of gardens) than in mid- or high-density ones, whose consumption tends to be more stable throughout the year (Domene & Saurí, Citation2006).
Policies
This variable includes laws and regulations, subsidies, water use reduction campaigns, or any other aspect designed by the State or the service provider to affect household water consumption.
Water saving strategy review
There is a need to focus on reducing demand (Adler, Citation2011). The strategies for saving water mentioned most often in the reviewed literature were counted and classified into four kinds: patterns, infrastructure, policy and price (). Many authors have proposed strategies related to the change in usage patterns and improved infrastructure, while others have referred to price-related strategies and to the use of policy. Among the pattern variables, education is widely mentioned (e.g., raising awareness of water saving). In the infrastructure variable, the core strategy is the installation of meters (micro measurement), followed by water-saving sanitary fittings. Regarding external variables, the most often mentioned are higher prices, subsidies, and restricting use during peak hours.
Methodology
The research was designed to provide information for studying the relation among consumption, usage patterns, and infrastructure in three districts in the Lima metropolitan area with different consumption profiles: high (San Isidro, 346 L per person per day), middle (Breña, 155 L per person per day) and low (Villa el Salvador, 70 L per person per day) (SEDAPAL, Citation2017).These districts also have different socio-economic levels: high, middle and low, respectively.Footnote9
As the first step, the internal and external variables to be assessed in the research were selected as suggested by the reviewed literature. The influence of climate on annual household water consumption was reviewed by considering the internal (patterns and infrastructure) as well as the external aspects. Neither pricing nor public policy was considered.
Next, quantitative and qualitative information was collected through different instruments. Here, the quantitative information is annual data on water consumption per house by district, provided by SEDAPAL. This refers to 100% of the billed water and does not consider the losses in the system (on average 36% of the processed water).
To obtain qualitative data, door-to-door, in-person surveys, designed to be answered by each head of household, were conducted by a pollster. To avoid subject bias, the survey was presented as part of academic research. For greater objectivity, people were informed that the data are confidential and that the survey would not reflect their particular case but would be used to prepare statistics on the state of water use in the district; thus, there were no correct or incorrect answers. Furthermore, to reduce social desirability bias, it was clarified that no relationship existed with the government or the service provider.
The survey gathered information that enabled the understanding of the impact of internal variables on water consumption. The fieldwork was conducted by the University of Lima, with sample size of 900 dwellings, for a margin of error of ±5%.Footnote10 Questions were organized into four sections and classified into are two main internal variables: dwelling features (infrastructure) and population characteristics (consumption patterns) ().
Table 1. Classification of questions into two variables. The way questions are grouped is stated below. The question number is indicated in brackets. Prepared by the author
Surveys were designed following the internal and external variables previously defined. Various studies were reviewed to develop each section of the survey, identifying variables related to the features of the house and its residents, the cost of water, consumption habits (Ojeda-De la Cruz et al., Citation2016), (Rajala & Katko, Citation2004), and the sanitary equipment’s frequency of use. The following were also considered: the time factor (in water use and household members), the household’s density, and its socio-economic profile (Cubillo et al., Citation2008; Domene & Saurí, Citation2006; Gogiel, Citation2011; González et al., Citation2008; Grafton et al., Citation2011; Loureiro et al., Citation2006; Borg et al., Citation2013; Grafton et al., 2011; U.S. Geological Survey, Citation2004). Some surveys we reviewed organized the collection of information by breaking down water use, understanding the associated psychological issues, and assessing user behaviour (Shan et al., Citation2015). It is also worth including the month in which the survey was conducted and comparing it with the annual consumption to detect variability in consumption (Loureiro et al., Citation2006).
The indicators on infrastructure are directly quantifiable and measurable, whereas several usage patterns are not, although they can be estimated or tabulated. Thus, for the estimate of litres of water used by toilets, faucets, and equipment, international consumption standards were used – in this case, those in the EDGE certification (International Finance Corporation, Citation2017) – and multiplied by the number of people living in each household. Consumption habits and attitudes to consumption were classified into three groups according to their actions and their water-saving methods.Footnote11
In addition to a profile of each district, surveys were processed, and a summary sheet was developed for each household, presenting the characteristics of the dwelling, users, and consumption. These data facilitated analyzing how consumption was affected by different variables. Thus, surveys were processed in a spreadsheet, the cases meeting the variable were filtered, and consumption per variable was obtained.
Three supplementary consumption values were specified in each sheet. The first was annual average water consumption from June 2016 to June 2017, by plot, from SEDAPAL.Footnote12 The second and third values were based on the surveys and their qualitative data. The second was information from the respondent on the size (in cubic metres) of the household’s last water bill and was only used as a reference to establish users’ perception of consumption. The third was obtained from questions regarding frequency and use time of sanitary appliances and fittings (which is also perceived consumption). These values were collected from the head of the household. As water use is a socially learned behaviour, the head of the family influences the rest of the family’s water use; furthermore, they know each other’s consumption. Hence, this response was used to calculate household water consumption. We must clarify that the third value did not consider the water used for internal uses (food processing, personal hygiene) and external uses (garden irrigation, swimming pool), which will be discussed below.
The qualitative information from the surveys was contrasted with the quantitative information provided by SEDAPAL (). This produced ratios and percentages, generating sheets and profiles by district, as presented in the Results section.
The quantitative information from the water service provider (SEDAPAL) is considered accurate, as it is from water meters. These data were used as the primary source from which consumption, in terms of both infrastructure and user consumption, was calculated. For example, SEDAPAL data on houses with one bathroom were filtered to find their average consumption. This was followed by houses with two bathrooms, and so on. The qualitative information was used to calculate the consumption of water in each house for showering, flushing the toilet, washing clothes, and gardening (using green area as an indicator). When calculating these factors, they can be compared with the total consumption data to identify what percentage it represents of the total obtained from SEDAPAL.
Results
The overall results for water consumption include the three consumption values, expressed in litres per person per day. The perceived consumption in the three districts is similar, differing by only 33 litres per day between San Isidro and Villa el Salvador. For the latter, the closeness of the three values stands out, indicating that a significant amount of water use (approximately 80%) is linked to toilets and showers ().
The consumption obtained from water meters and the consumption reflected in the water bill always exceed the perceived consumption. The difference between these values may represent the water used for personal hygiene and dietary purposes. For all three values, the volume in San Isidro exceeded the volume in Breña, which exceeded that in Villa el Salvador; in other words, on average, higher socio-economic households used more water than the lower-level ones, which is consistent with several studies (Rockaway et al., Citation2011; Grafton et al., Citation2011; Hussien et al., Citation2016; and Xue et al., Russell and Fielding, Mondéjar-Jiménez et al. and Willis et al., all cited in Koop et al., Citation2019).
With regard to the external factors affecting water consumption, from the consumption amounts provided by SEDAPAL, a similar behaviour was observed in the water use in the three districts with regard to climate variables. In Lima, climate also impacted consumption: consumption is higher in summer and lower in winter, with variation of 26% in San Isidro, 21% in Breña and 22% in Villa el Salvador (). SEDAPAL’s sample was annual, whereas the survey was performed in October, a month in which consumption is 5% higher than the annual average.
Figure 4. Average water consumption by district according to both quantitative and qualitative information. The difference between consumption recorded by SEDAPAL and consumption reported in the surveys (showers, toilets, and washing machines) should be noted. The higher the socio-economic level, the greater the difference
Figure 5. Annual water consumption on selected plots by district, based on SEDAPAL data. In summer, the consumption increases for all cases, regardless of socio-economic level
Figure 6. People per household (based on survey) vs. household water consumption (based on SEDAPAL data)
Figure 7. Relation between income (based on survey) and water consumption (based on SEDAPAL data)
Figure 8. Relation between education level (based on survey) and water consumption (based on SEDAPAL data)
Figure 9. Relation between house type (based on survey) and water consumption (based on SEDAPAL data)
Figure 10. Relation between house size (based on survey) and water consumption (based on SEDAPAL data)
Figure 11. Relation between house age (based on survey) and water consumption (based on SEDAPAL data)
Figure 12. Water appliance consumption (based on survey) and its representation in final consumption (based on SEDAPAL data), with or without a garden
Regarding qualitative data, the 900 surveys (300 per district) were processed by the research team during the first months of 2018,Footnote13 developing a profile for each district in terms of the internal factors of water consumption and based on the four sections of the survey: dwelling information, the characteristics of the inhabitants, sanitary infrastructure, and usage patterns.
In San Isidro, the most representative type is the single-family house with an area over 100 m2 and over 30 years old. Here, 97% of them had a laundry room, 88% had two or more full sanitary facilities, 97% used washing machines, 44% used water dispensers, 50% had gardens, 3% had swimming pools, 32% had dual-flush toilets, and 6% owned aerators and pressure reducers. Concerning usage patterns, the average number of people per household was 3.7; they used a monthly volume of 23 m3, with monthly spending of PEN94. The average person used the shower six times a week for an average of 11 minutes; the toilet was used 3.4 times a day; and the washing cycle was used once a week. Finally, 75% of them showed a moderate water savings level; 65% said that they primarily saved water to avoid wasting it, and 49% of them did so to save money. More information is available in Supplemental Material 1.
In Breña, the most representative type was the single-family house with an area of 50–100 m2 and older than 50 years. Here, 67% owned a laundry room, 74% had a complete sanitary facility, 72% used washing machines, and 22% used water dispensers. Eight per cent had gardens, but none had swimming pools. Furthermore, 12% had dual-flush toilets, 7% owned aerators, and 6% had pressure reducers. The average number of people perhousehold was 4.3. They used a monthly volume of 20.45 m3, with monthly spending of PEN57. The average personused the shower six times a week for an average of 10 minutes; the toilet was used 3.27 times a day, and the washing cycle was used oncea week. Finally, 85% of them showed a moderate watersavings level; 65% stated that the primary reason they saved water was to avoid wasting it, and 64% did so to save money. For more, see Supplemental Material 2.
The most representative type in Villa El Salvador was the single-family house with an area over 100 m2 and 16–30 years old. Here, 81% owned a laundry room, 74% had a complete sanitary facility, 72% used washing machines, and 11% used water dispensers; 17% had gardens, but only 1% had swimming pools. Some 16% had dual-flush toilets, and 4% owned aerators and pressure reducers. The average number of people per household was 4.7. They used a monthly volume of 15.81 m3, with monthly spending of PEN44. The average person used the shower five times a week for an average of 10 minutes; the toilet was used 3 times a day; and the washing cycle was used 0.85 times a week. Finally, 85% showed a moderate water saving level, and 65% stated that the primary reason they saved water was to save money. For more, see Supplemental Material 3.
To assess how internal factors affect water consumption in a household, profile data from each district were disaggregated to be compared later, focusing on each internal variable. The cases meeting each condition under research (such as type of dwelling, frequency of toilet use, and presence of water-saving appliances) were sorted for each variable. The specific average water consumption value has been displayed for each condition in accordance with the quantitative data provided by SEDAPAL.
Usage pattern results
Social variables
For the population social variable, the average number of people per household is 4.2, with 3.3 in San Isidro, 4.3 in Breña and 4.7 in Villa el Salvador. If this information is related to household water consumption, then the more people per household, the higher the consumption per household (). Nevertheless, the greater the number of people living in a house, the less water is used by each one of them. For example, in Villa El Salvador, for households with up to two members, 3.3 more litres were consumed (per person day) than in houses with over five residents.
In the case of Lima, it can be asserted that on average, the older the person, the more water they consume. In households without children or teenagers, consumption increases by 7–18%, depending on the district, which is consistent with Clark and Finley (Citation2007) and Davies et al. (2014, as cited in Koop et al., Citation2019). In addition, in Villa El Salvador and Breña, households with teenagers consumed 2.75% more than households with children but no teenagers; this could be attributed to longer showers, as mentioned by Randolph and Troy (Citation2008). That is to say, in Lima, the presence of children and teenagers does not correspond to a significant increase in household water consumption. Perhaps this is because young children use diapers, and they have controlled bathing, and as they grow up, their use of sanitary devices is usually under the supervision of their parents, which leads to less water use. Conversely, the occupancy of a dwelling by only adults resulted in more water consumption; this is related to the idea that older people live in older houses, and the older the building, the less likely is the adoption of water-efficient equipment (see Supplemental Material 4).
Small differences were found regarding the impact of gender on water consumption. In all cases, the presence of men in the household corresponded to higher consumption, which is consistent with Clark and Finley (Citation2007). This is perhaps due to the difference in physical activity between men and women in sports and type of work. Locally, it is more common for men than women to practice sports (Seclén-Palacín & Jacoby, Citation2003; Grupo de Opinión Publica de la Universidad de Lima, Citation2008). And around 75% of the female workforce is linked to activities that require less physical effort (Insitituto Nacional de Estadística e Informática, Citation2016). These two differences could mean more water use by men for personal hygiene. When consumption was compared by sex and district, we observed that in San Isidro, only 1.6 additional litres were consumed per day by a household with more men than women; in Villa El Salvador, it was 19 litres; and in Breña, the difference was 37 litres a day (see Supplemental Material 5).
Regarding the presence of people throughout the day, it was found that during morning and afternoon, the three districts indicated a similar presence of 1–2 people (66% in Villa El Salvador, 69% in Breña, and 74% in San Isidro). Therefore, in low-income districts, reduced consumption is not a result of people staying in the house all day. In fact, only 3% of the dwellings surveyed in Villa El Salvador were usually inhabited during the day, while in San Isidro, this was 10%. Thus, the presence of residents during this time was not as determining as the users’ water use habits or the infrastructure (see Supplemental Material 6).
Economic variables
With reference to the economic variable, we can verify that, when we match families with similar income levels in the three districts, water consumption is still higher in San Isidro. This may be because of infrastructure type (more bathrooms, swimming pool, and garden), as well as the socio-economic environment wherein the house is placed, which could be more determinant than the family’s per capita income. Likewise, although families with more income in Villa El Salvador and San Isidro consumed less water, this was not the case in Breña. Once again, this may be explained by the differences in infrastructure and use ().
Cultural variables
Finally, with reference to cultural variables, education was almost always proportional to efficiency of water use: the higher the education, the lower the consumption. However, it is essential to mention the contradiction here: highly educated people have better-paid jobs, which corresponds to more water consumption ().
The consumption habits derived from water-saving strategies led to lower water use; the more water-saving strategies were implemented in a household, the less consumption was registered. Thus, the participants who reported using more strategies (e.g., closing the tap while having a shower, soaping, or brushing their teeth; efficiently washing clothes; fixing leaky faucets) also reported 12% less consumption in San Isidro, 90% less in Breña and 18% less in Villa El Salvador than those who reported using fewer strategies. This is perhaps mainly due to infrastructure. While San Isidro and Villa el Salvador present different housing typologies, around 85% of the people in Breña live in houses between 0 and 100 m2 in area. As the infrastructure is similar, the predisposition to save water is more visible (see Supplemental Material 7 and 8).
Similarly, households with more highly educated members had more water-saving devices. This finding reinforces the idea of the overall importance of education and suggests developing programmes and measures for environmental education. However, while several studies have found education to be a reliable indicator of concern, it is not a significant predictor of behaviour (Wolters, Citation2014). This is also true in our study, since most of the surveyed population reported moderate environmental concerns, but no reduction in water consumption.
Infrastructure results
The typical house in all three districts is the single-family home: 99.7% in Villa El Salvador, 68% in Breña and 56% in San Isidro. The second-most frequent varied by the district, being apartments in San Isidro (38%) and the quintaFootnote14 in Breña (21%).Footnote15 If we relate the house type to water consumption, we can assert that with respect to the four predominant types, with the single-family home being the most private and quinta being the most public, there is a decreasing trend of water consumption (11% in San Isidro and 15.6% in Breña). This may be because of the density, the number of common areas, or the footprint of these different types of buildings (). The higher water consumption in detached houses could be attributed to bigger houses and larger gardens (Ghavidelfar et al., Citation2018)
If we assess the link between dwelling area and water consumption per person, it can be stated that the greater the area, the higher the consumption. Dwellings of over 100 m2 used an average of 196 litres per day per person; those of 51–100 m2 used an average of 171; and those of less than 50 m2 used an average of 132. The larger the dwelling, the higher the number of people, sanitary facilities, toiletries, and garden areas, in addition to the more frequent use of toilets and washing cycles, resulting in higher water consumption ().
A direct relation between the age of the house and water consumption can also be seen. In all cases, there was an increase between houses of 0–15 years and those older than 50 years; the difference varyied from 19% to 47%. Inadequate sanitary facilities (with leaks) in older houses could partially account for such findings. But what is found is that the older the building, the higher the water consumption ().
After integrating the number of toilet services found in the sample, we see that dwellings at higher socio-economic levels have more sanitary facilities, swimming pools, and gardens. The average number of sanitary facilities per household in San Isidro is twice that in Breña and Villa El Salvador; the higher the socio-economic level, the larger the number of sanitary facilities. In San Isidro, 89% of households had more than two bathrooms; the average was 2.7. In contrast, in Breña and Villa El Salvador, 73% of houses had one sanitary facility; the average was 1.3. And at high socio-economic levels, the more sanitary facilities in a household, the greater was the water consumption per person. However, this was not the case at low socio-economic levels. This may be because the sanitary fittings do not save water or are not necessarily consolidated (complete) – see Supplemental Materials 9 and 10.
Regarding green areas, in San Isidro 50% of the surveyed households had gardens, and of these 20% were larger than 20 m2. Although both Breña and Villa El Salvador had a significant percentage of households with gardens, they were usually smaller than 5 m2. Thus in San Isidro household water consumption increased by 24% with the presence of a garden, but there was no such correspondence in the other two districts. This is consistent with Jorgensen et al. (Citation2009), Hussien et al. (Citation2016), Wong and Mui (Citation2005), Cubillo et al. (Citation2008), Domene and Saurí (Citation2006), and Shan et al. (2015). The presence of pools in the sample was not sufficient for analysis (only 12 had a pool and also had data from SEDAPAL). Additional study is required to identify whether swimming pools directly influence consumption (see Supplemental Material 11).
Regarding water-saving technology, 32% of the households in San Isidro had water-saving toilets, but only 16% in Breña and 12% in Villa El Salvador. The amount saved ranged from from 3% to 22%. The lower the socio-economic level, the fewer the devices, and the less water saved. Breña saved 19% in properties using toilets with water-saving technology, and Villa El Salvador saved 8.2%. This suggests future opportunities to minimize water consumption in such areas (see Supplemental Material 13).
Finally, we consider the incidence of gardens. In houses without green spaces, showers use 40–60% of the water, toilets use 12–18%, and washing machines use 6%. In households with gardens, the numbers for toilets and washing machines were similar, but the numbers for showers were 38 48%. In San Isidro only, green spaces represented the second-highest consumption. On average, showers are the activity that consumes the most amount of water (around 60%) – in San Isidro, 96 litres; in Breña, 71 litres; and in Villa El Salvador, 78 litres. The second-most water-consuming facility is toilets, with 25%. Hence, policies and strategies oriented towards saving water should focus on water use efficiency in such appliances ().
Conclusions
The urban population in Lima has water vulnerability and unmet water demand that affects 1.5 million people that do not have secure access to this resource. Yet the amount of consumption varies widely by district. As we will face significant water stress in the coming years, it is necessary to study mechanisms that offer equal access to water.
This research aims to understand consumer behaviour, which is essential not only to reduce water consumption but also to improve resource distribution. The variables that impact water consumption were sorted into external and internal, focusing on usage patterns, housing infrastructure, and the environment (climate, pricing and policies). The sample and its analysis were carried out for a scenario where access to water is secure. However, for greater scope, future research should consider scenarios that include shortages.
We find that water consumption is deeply affected by dwelling features. Water use related to behaviour, attitude or education is conditioned by dwelling characteristics and the types of devices employed in bathrooms. Thus, it is essential to focus efforts on housing design, especially on showers and toilets, which consume the most water. Also, Peru has a housing deficit of close to 1.8 million units, and this investigation represents an opportunity to develop infrastructure design policies capable of saving water and addressing the housing problem.
A significant contribution of this investigation is to understand the use of water in relation to specific user profiles and housing typologies, filling information gaps on the relationship between them, and providing relevant and detailed information that helps us understand water demand management in Lima.
The study relates quantitative data on household water consumption to qualitative information from surveys. These data permit us to build a user profile for each type of user and dwelling. They also enable us to estimate each qualitative variable’s representativity and impact on the general water consumption and to understand how water consumption is affected by specific aspects of each user profile.
Each profile provides ratios and values that could be extrapolated to districts with similar infrastructure and user characteristics in Lima and other cities in Peru, to plan more suitable water demand management policies.
Supplemental Material
Download PDF (1.5 MB)Acknowledgments
This research has been made possible by the support of the Scientific Research Institute of the University of Lima. We are also grateful to research assistant Carlos Esponda Alva and research interns Gabriela Champín Vidal and Jaione Aramburu Stuart.
Disclosure statement
No potential conflict of interest was reported by the authors.
Supplementary material
Supplementary data for this article can be accessed at https://doi.org/10.1080/02508060.2020.1830360
Additional information
Funding
Notes
1. Although a sustainable technical code to foster water efficiency exists (Ministerio de Vivienda, Construccion y Saneamiento, Citation2016), it is not enforceable, and there are still no clear indicators.
2. According to the Blue Book, exploitable water availability will drop from 74,000 m3 per person in 2003 to 54,000 m3 per capita in 2020.
3. Average, 2001–2014.
4. The flow rate in the three basins (Lurín, Rímac and Chillón) has been decreasing in the last few years. In January 2016 the Rímac River’s average was 22.2 m3/s, 41.9% less than the previous year and 46.9% less than with the historical average (41.8 m3/s). The flow in the Chillón River was 2.2 m3/s, 77.8% less than the previous year (INEI, Citation2016).
5. SEDAPAL charges people connected to water and sewage networks 4.9 Peruvian soles per m3 for drinking water and 2.2 Peruvian soles for drainage. Families without supply networks must buy the resource from tanker trucks at a cost of 15 Peruvian soles (Comité Nacional del Libro Azul para el Perú, Citation2016, p. 52).
6. According to a study by Fernández and Viñuales, for example, an education programme in Zaragoza achieved household consumption savings of 5.6%. Furthermore, there was an increase in the number of families adopting, but not necessarily maintaining over time, thrifty habits (from 20% to 50%) and new technologies (from 13% to 15%) (Manco et al., Citation2012).
7. EPS, by its Spanish acronym, Empresas Prestadoras de Servicios de Saneamiento, sanitation service providers.
8. In the Netherlands, for example, 40% is used in showers, 28% in toilets, and 12% in washing machines (Shan et al., Citation2015). In Great Britain, 25% of water is used in showers. In the US, 59% is outdoor use, and the rest includes 27% in toilets, 22% in washing machines, and 17% in showers. In Australia, 22% is for outdoor use, and the rest is composed of 25% for showers, 19% for sinks, 18% for washing machines, and 13% for toilets. In the city of Hong Kong, the water consumed by toilets represents 30% of internal domestic water consumption (Wong & Mui, 2005).
9. The Income Quintiles method is used in Peru by the National Statistics Institute, which divides the population into five more or less equal group. The first quintile groups the poorest, that is, those with the lowest income, and the fifth quintile those with the highest income. In this research, San Isidro is mainly the fifth quintile, Breña mainly the third and Villa el Salvador is the second quintile.
10. For the household selection, multistage random sampling was used. In the first stage, conglomerates were selected using a simple random sample for each district. This method is also used for the second stage, where a city block was selected. For dwelling selection, systematic sampling was used. Finally, for household selection, stratified random sampling by age was used. This procedure guarantees an optimal level of housing dispersion.
11. Ten aspects were asked from each head of the family and then evaluated to estimate the family’s saving level (attitude): three water-saving strategies (use of low-flush toilet, faucet aerators, water pressure reducer) and seven daily habits (turning off the tap when taking a shower / brushing teeth / washing dishes / watering the garden; gathering clothes to wash; quickly fixing leaks; family awareness of water use). Households that applies at least eight of these were considered to have strong environmental values; from five to seven, moderate environmental values; and four or less, low environmental values (see Supplemental Material 7).
12. On average, 82% of the plots have water meter data from SEDAPAL: 270 (out of 300) in Villa El Salvador, 244 in Breña, and 220 in San Isidro.
13. IBM SPSS Statistics 25 and Excel spreadsheets were used to process the information. The research team performed quality control using consistency checking and random supervision for 30% of the sample.
14. The quinta in Lima is a collective residential complex formed by a group of houses built on individual lots and with access through a common space or directly from public roads.
15. In this case, an ‘apartment’ is a building that contains properties in a vertical arrangement, while in a ‘condominium’ the arrangement is horizontal, and there is usually a private common area at ground level.
References
- Abderrahman, W. A. (2000). Water demand management and Islamic water management principles: A case study. International Journal of Water Resources Development, 16(4), 465–473. Taylor & Francis. https://doi.org/10.1080/713672529
- Adler, I. (2011). Domestic water demand management: Implications for Mexico City. International Journal of Urban Sustainable Development, 3(1), 93–105. https://doi.org/10.1080/19463138.2011.567085
- AQUAFONDO. (2016). Estudio de Riesgos Hídricos y Vulnerabilidad del Sector Privado en Lima Metropolitana y Callao en un Contexto de Cambio Climático.
- Araral, E., & Wang, Y. (2013). Water demand management: Review of literature and comparison in South-East Asia. International Journal of Water Resources Development, 29(3), 434–450. https://doi.org/10.1080/07900627.2013.826413
- Barberán, R., & Salvador, M. (2010). Ayuntamiento de Zaragoza. Ayuntamiento de Zaragoza. https://www.zaragoza.es/contenidos/medioambiente/cda/Hogares_viviendas.pdf
- Barrett, G. (2004). Water conservation: The role of price and regulation in residential water consumption. Economic Papers: A Journal of Applied Economics and Policy, 23(3), 271–285. https://doi.org/10.1111/j.1759-3441.2004.tb00371.x
- Biswas, A. K., Lundqvist, J., & Torjada, C. (2004). Water management for megacities. Stockholm Water Front, 2, 12–13. https://research.aalto.fi/en/publications/water-management-for-megacities
- Borg, M., Edwards, O., & Kimpel, S. (2013). A study of individual household water consumption. The University of California-Davis Water Management Research Institute.
- Castillo-Avalos, Y., & Rovira-Pinto, A. (2013). Eficiencia hídrica en la vivienda. Tecnologia y Ciencia del Agua, 4(4), 159–171. http://ref.scielo.org/r6ppt3
- Clark, W. A., & Finley, J. C. (2007). Determinants of water conservation intention in Blagoevgrad, Bulgaria. Society and Natural Resources, 20(7), 613–627. https://doi.org/10.1080/08941920701216552
- Clarke, J. M., & Brown, R. R. (2006). Understanding the factors that influence domestic water consumption within Melbourne. Australasian Journal of Water Resources, 10(3), 261–268. https://doi.org/10.1080/13241583.2006.11465301
- Comité Nacional del Libro Azul para el Perú. (2016). Libro Azul para el Perú. Gráfica La Española.
- Cubillo, F., Moreno, T., & Ortega, S. (2008). Microcomponentes y factores explicativos del consumo doméstico de agua en la Comunidad de Madrid. Canal de Isabel II.
- Da-ping, X., Hong-yu, G., & Dan, H. (2011). Discussion on the demand management of water resources. Procedia Environmental Sciences, 10(Part B), 1173–1176. https://doi.org/10.1016/j.proenv.2011.09.187
- Domene, E., & Saurí, D. (2006). Urbanisation and water consumption: Influencing factors in the metropolitan region of Barcelona. Sage Publications.
- Durán, G. (2015). Agua y pobreza en Santiago de Chile: Morfología de la inequidad en la distribución del consumo domiciliario de agua potable. EURE (Santiago), 41(124), 225–246. https://dx.doi.org/10.4067/S0250-71612015000400011
- FAO (2016). AQUASTAT main database, Food and Agriculture Organization of the United Nations (FAO). Retrieved from July 10, 2017.
- Fercovic, J., & Melo, O. (2010). Cambio climático. El incierto futuro del consumo de agua potable en Santiago. Agronomia y Forestal, 41, 18–23. http://agronomia.uc.cl/component/com_sobipro/Itemid,232/pid,127/sid,678/
- Freire-González, J. (2019). Does water efficiency reduce water consumption? The economy-wide water rebound effect. Water Resources Management, 33(6), 2191–2202. https://doi.org/10.1007/s11269-019-02249-0
- González, F., Moreno, T., & Ortega, S. (2008). Microcomponentes y factores explicativos del consumo doméstico de agua en la Comunidad de Madrid. Canal de Isabel II.
- Ghavidelfar, S., Shamseldin, A. Y., & Melville, B. W. (2018). Evaluating spatial and seasonal determinants of residential water demand across different housing types through data integration. Water International, 43(7), 926–942. https://doi.org/10.1080/02508060.2018.1490878
- Gogiel, G. (2011). Conciencia social y ahorro de agua doméstica según las diferentes tipologías urbanas. Universitat Politècnica de Catalunya.
- Grafton, Q., Ward, M. B., To, H., & Kompas, T. (2011). Determinants of residential watr consumption: Evidence and Analysis from a 10-country household survey. Water Resources Research, 47, W08537. https://doi.org/10.1029/2010WR009685doi:10.1029/2010WR009685
- Grupo de Opinión publica de la Universidad de Lima. (2008). V Encuesta anual sobre la situacion del deporte en el Perú. Universidad de Lima. http://www2.ulima.edu.pe/webulima.nsf/default/F598031D89943F2F05256E630017BD4C/$file/barometro_social_nov_2008b.pdf
- Harlan, S. L., Yabiku, S. T., Larsen, L., & Brazel, A. J. (2009). Household water consumption in an arid city: Affluence, affordance, and attitudes. Society and Natural Resources, 22(8), 691–709. https://doi.org/10.1080/08941920802064679
- Howard, G., Bartram, J., & World Health Organization. (2003). Domestic water quantity, service level and health. https://apps.who.int/iris/handle/10665/67884
- Hussien, W., Memon, F. A., & Savic, D. A. (2016). Assessing and modelling the influence of household characteristics on per capita water consumption. Water Resources Management, 30(9), 2931–2955. https://doi.org/10.1007/s11269-016-1314-x
- INEI. (2015). Perú: Anuario de Estadisticas Ambientales 2015. Instituto Nacional de Estadística e Informática.
- INEI. (2016). Estadisticas Ambientales. Instituto Nacional de Estadística e Informática.
- Insitituto Nacional de Estadística e Informática. (2016). Perú - Encuesta Nacional de Hogares sobre Condiciones de Vida y Pobreza 2016.
- International Finance Corporation. (2017). User Guide for Homes. Recuperado el 2017, de https://www.edgebuildings.com/homes-user-guide-version-2-0/
- Jorgensen, B., Graymore, M., & O’Toole, K. (2009). Household water use behavior: An integrated model. Journal of Environmental Management, 91(1), 227–236. https://doi.org/10.1016/j.jenvman.2009.08.009
- Kámiche, J. (2012). El precio del agua ¿es muy alto? (U. d. Pacifico, Ed.). Recuperado el Febrero de 2017, de http://www.saberescompartidos.pe/wp-content/uploads/2012/08/el_precio_del_agua_es_muy_alto.pdf
- Koh, Y. R. (2020). Attitude, behaviour and choice: The role of psychosocial drivers in water demand management in Singapore. International Journal of Water Resources Development, 36(1), 69–87. https://doi.org/10.1080/07900627.2019.1617114
- Koop, S., Van Dorssen, A., & Brouwer, S. (2019). Enhancing domestic water conservation behaviour: A review of empirical studies on influencing tactics. Journal of Environmental Management, 247, 867–876. https://doi.org/10.1016/j.jenvman.2019.06.126
- Lee, M., Tansel, B., & Balbin, M. (2013). Urban sustainability incentives for residential water conservation: Adoption of multiple high efficiency appliances. Water Resources Management, 27(7), 2531–2540. https://doi.org/10.1007/s11269-013-0301-8
- Lentini, E. (2015). El Futuro de los Servicios de Agua y Saneamiento en América Latina. Desafíos de los Operadores de Áreas Urbanas de más de 300,000 Habitantes. Inter-American Development Bank. Recuperado el 10 de 07 de 2020, de https://publications.iadb.org/handle/11319/7176
- Loureiro, D., Coelho, S. T., & Machado, P. (2006). Profiling residential water consumption. In 8th annual water distribution systems analysis symposium (pp. 18). Cincinnati.
- Lowe, B., Lynch, D., & Lowe, J. (2015). Reducing household water consumption: A social marketing approach. Journal of Marketing Management, 31(3–4), 378–408. https://doi.org/10.1080//0267257X.2014.971044
- Lucas, N. P., & Cordery, I. (2019). Effects of heightened price awareness on urban water consumption. Australasian Journal of Water Resources, 23(2), 129–136. https://doi.org/10.1080/13241583.2019.1650588
- Luo, T., Young, R., & Reig, P. (2015). Aqueduct projected water stress country rankings Technical Note. Washington, DC: World Resources Institute. www.wri.org/publication/aqueduct-projected-water-stresscountry-rankings
- Manco Silva, D. G., Guerrero Erazo, J., & Ocampo Cruz, A. M. (2012). Eiciciencia en el consumo de agua de uso residencial. Revista Ingenierias Universidad de Medellin, 11(21), 23–38. Retrieved from https://revistas.udem.edu.co/index.php/ingenierias/article/view/595
- Manouseli, D., Kayaga, S., & Kalawsky, R. (2019). Evaluating the effectiveness of residential water efficiency initiatives in England: Influencing factors and policy implications. Water Resource Management, 33, 2219–2238. https://doi.org/10.1007/s11269-018-2176-1
- Martínez-Espiñeira, R., & Nauges, C. (2004). Is all domestic water consumption sensitive to price control? Applied Economics, 36(15), 1697–1703. https://doi.org/10.1080/0003684042000218570
- Ministerio de Vivienda, Construccion y Saneamiento. (2016). Código técnico de construcción. El Peruano. August 28 from 2015.
- Ojeda-de la Cruz, A., Quintana-Pacheco, J., & García-Arvizu, F. (2016). Un estudio del consumo de agua residencial urbana: El caso de Hermosillo, Sonora. Bitácora Urbano Territorial, 26(1), 111–119. http://dx.doi.org/10.15446/bitacora.v26n1.43134
- Oliver, N., & Brümmer, D. (2007). Factors influencing water consumption in South Africa schools. Journal of Engineering Design and Technology, 5(1), 81–94. https://doi.org/10.1108/17260530710746623
- Otaki, Y., Otaki, M., Sugihara, H., Mathurasa, L., Pengchai, P., & Aramaki, T. (2011). Comparison of residential indoor water consumption patterns in Chiang Mai and Khon Kaen, Thailand. American Water Works Association, 103(5), 104–110. https://doi.org/10.1002/j.1551-8833.2011.tb11457.x
- Peña-Guzman, C., Melgarejo, J., & Prats, D. (2016). El ciclo urbano del agua en Bogotá, Colombia: Estado actual y desafíos para la sostenibilidad. Tecnología y Ciencias del Agua, VII(6), 57–71. http://ref.scielo.org/4g62jv
- Rajala, R., & Katko, T. (2004). Household water consumption and demand management in Finland. Urban Water Journal, 1(1), 17–26. https://doi.org/10.1080/15730620410001732080
- Randolph, B., & Troy, P. (2008). Attitudes to conservation and water consumption. Environmental Science & Policy, 11(5), 441–455. https://doi.org/10.1016/j.envsci.2008.03.003
- Rockaway, T. D., Coomes, P. A., Rivard, J., & Kornstein, B. (2011). Residential water use trends in North America. American Water Works Association, 103(2), 76–89. https://doi.org/10.1002/j.1551-8833.2011.tb11403.x
- Sánchez García, V., & Blanco Jiménez, F. J. (2012). El uso sostenible del agua en núcleos urbanos: las tarifas como herramienta de control del consumo. Observatorio Medioambiental, 15, 35-59. https://doi.org/10.5209/rev_OBMD.2012.v15.40331
- Saurií, D. (2003). Lights and shadows of urban water demand management: The case of the metropolitan region of Barcelona. European Planning Studies, 11(3), 229–243. https://doi.org/10.1080/09654310303639
- Seclén-Palacín, J. A., & Jacoby, E. R. (2003). Factores sociodemográficos y ambientales asociados con la actividad física deportiva en la población urbana del Perú. Revista panamericana de salud pública, 14(4), 255–264. https://doi.org/10.1590/S1020-49892003000900006
- SEDAPAL. (2017, Febrero 9). SEDAPAL. Recuperado el 2017, de http://www.sedapal.com.pe/noticias1/-/asset_publisher/mRM0/content/mayor-consumo-de-agua-potable-por-habitante-dia-se-registra-en-san-isidro?redirect=http%3A%2F%2Fwww.sedapal.com.pe%2Fnoticias1%3Fp_p_id%3D101_INSTANCE_mRM0%26p_p_lifecycle%3D0%26p_p_state%
- Shan, Y., Yang, L., Perren, K., & Zhang, Y. (2015). Household water consumption: Insight from a survey in Greece. Procedia Engineering, 119, 1409–1418. https://doi.org/10.1016/j.proeng.2015.08.1001
- Silva, D. G., Erazo, J. G., & Cruz, A. M. (2012). Eficiencia en el consumo de agua. Revista Ingenierías, Universidad de Medellin.
- Sims, A., Montague, T., & Allen, L. (2013, 3). Consumer council for water. Recuperado el 10 de 07 de 2020, de https://www.ccwater.org.uk/wp-content/uploads/2013/12/Research-into-customer-water-saving.pdf
- SWITCH. (2011). Switchtraining. Recuperado el Febrero de 2017, de. shorturl.at/wCRU1
- Tate, D. M. (1989). Water demand management in Canada: A review and assessment. Canadian Water Resources Journal, 14(4), 71–82. https://doi.org/10.4296/cwrj1404071
- U.S. Geological Survey. (2004). Residential water-use survey. Residential Water-Use Project.
- United Nations Human Settlements Programme. (2011). Cities and climate change. Global report on human settlements 2011. UN-Habitat. Earthscan.
- Wolters, E. A. (2014). Attitude-behavior consistency in household water consumption. Social Science Journal, 51(3), 455–463. https://doi.org/10.1016/j.soscij.2013.10.003
- World Bank Group. (2016). Lima water rehabilitation and management project and national rural water supply and sanitation project. International Bank for Reconstruction.
- Wong, L., & Mui, K. (2005). Determination of domestic flushing water consumption in Hong Kong. Facilities, 23 (1/2), 82-92. https://doi.org/10.1108/02632770510575929