
ABSTRACT
Principle 12 of the OECD Principles on Water Governance calls for the evaluation of sustainable water policies, which to be effective must be salient, credible and legitimate. Using a 2021 survey of land and water managers within the Colorado River Basin, we examine the salience, credibility and legitimacy of two approaches to evaluate policies that integrate water and land management: using practitioners’ perceptions of policies effectiveness to achieve water sustainability goals, and the importance of indicators to assess the water sustainability of a community. Results show perceptions of policy effectiveness and indicator importance vary with the context of organization and place.
Introduction
Access to clean and relatively inexpensive water has been a key factor in the growth of urban and rural communities in the United States (Quay, Citation2012). Technology over the last 100 years has created water systems that have reliably delivered water to the vast majority of communities. Most people assume that water will flow when they turn on their faucet and likely have little knowledge of where the water is coming from and how it reached their sink. Water sustainability has been at best a secondary issue of concern. However, in the Colorado River Basin, this soon will not be the case for many communities across the US West (Arizona, California, Colorado, Nevada, New Mexico, Utah and Wyoming) and Mexico as water demand is projected to exceed the available surface water (McCabe & Wolock, Citation2021; Miller et al., Citation2021; Sampson et al., Citation2016). In 2021, the United States Bureau of Reclamation declared the first shortfage of water allocation on the Colorado River since the 1922 Colorado River Compact created the law for river rights management (Goodland, Citation2021; Sakas, Citation2021). Trends of growth, economy, politics and climate are creating challenges for communities to maintain sustainable water systems (Hondula et al., Citation2019). The strategies and policies used over the last century to store water during wet years in large federal reservoirs and release and deliver water from reservoirs in dry years through a system of ditches and canals will likely not be enough to achieve water sustainability in the future (Gober et al., Citation2016; Udall, Citation2020). New strategies will be needed.
Water sustainability has been an evolving concept ranging from the simple concept of supply being balanced with demand to more complex and broader concepts of social justice and long-term processes. Hufschmidt and Tejwani (Citation1993, p. 3) defined water sustainability as ‘a set of activities that ensures that the value of the services provided by a given water resource system will satisfy present objectives of society without compromising the ability of the system to satisfy the objectives of future generations’. Modelled after the Brundtland Commission report (World Commission on Environment and Development (WCED), Citation1987) this is a very anthropogenic view point (Jones, Citation2011) and later definitions included natural or environmental needs as well as human needs such as the 2013 California Water Plan definition: ‘Water sustainability is the dynamic state of water use and supply that meets today’s needs without compromising the long term capacity of the natural and human aspects of the water system to meet the needs of future generations’ (Department of Water Resources, Citation2013, p. 5–8). For the purposes of this research, we follow Wiek and Larson’s (Citation2012) definition of water sustainability as:
Having sufficient water to meet the community’s economic, social, and environmental goals, without compromising the ability of future generations to meet their own water needs and community goals. (paraphrased by current authors)
The integration of the activities of land-use management – including planning and regulation – with the activities of water management – including operations and planning – has recently been cited as one way to increase the sustainability of community water systems (Fedak et al., Citation2018; Quay et al., Citation2018a; Räsänen et al., Citation2018). This is also a key element of Principle 3 of the OECD Principles on Water Governance (OECD, Citation2015), which ‘Encourages policy coherence through effective cross-sectoral co-ordination, especially between policies for water and the environment, health, energy, agriculture, industry, spatial planning and land use’ (emphasis added). For example, including a review of how much water is available to serve proposed development during the planning review of the development process helps to avoid over-committing available water supplies. Additionally, including water efficiency requirements as part of a development review can help to reduce future water demand. Several institutions, such as the American Planning Association, the American Water Works Association, the Babbitt Center for Land and Water Policy (which was created by the Lincoln Institute of Land Policy), the Colorado Water Conservation Board and the Water Research Foundation, are now supporting efforts to expand these activities (Hansman, Citation2021), yet there is currently little information about the status of such activities or evidence to understand how these activities will actually help achieve sustainability.
The OECD Principles on Water Governance include ‘Principle 12: Promote regular monitoring and evaluation of water policy and governance where appropriate, share the results with the public and make adjustments when needed’. To implement this principle with regard to integrated land and water management would require some evidence, that is, some method to evaluate these policies. One way to provide such evidence would be to assess the current state of water sustainability and practices of integrated land and water management in terms of effectiveness. The OECD emphasizes effectiveness as an important dimension of water governance and defines it as ‘the contribution of governance to define clear sustainable water policy goals and targets at all levels of government, to implement those policy goals, and to meet expected targets’ (OECD, Citation2015, p. 3). Thus, the extent that the implementation of policies to achieve targets of sustainability would be one assessment of effectiveness. This assessment could be based on either professional opinion of effectiveness or more objective indicators of water sustainability that are credible and salient to water and land managers.
To address this gap in the evidence and to explore these aspects of assessment, the Babbitt Center for Land and Water Policy and the Decision Center for a Desert City at Arizona State University developed and administered a survey for the spring of 2021 to assess the current state of integration between land and water management activities within communities of the Colorado River Basin. In our efforts to design the survey to evaluate these policies, there was much discussion on how to do that. We realized that such an evaluation must be outcome based and needed to be credible, salient and legitimate in order to influence policy, but how to achieve such was unclear. We concluded there were two approaches, either based on practitioners’ perceptions of outcomes or based on more objective indicators that measured outcomes. In our discussion we saw the pros and cons of both approaches, thus we designed the survey to also explore these questions. The intent of this article is to report on these questions using our survey as a case study.
Survey methodology
The abovementioned survey was developed based on several social science research frameworks: integrated policymaking (Meijers & Stead, Citation2004), values and goals – normative (Carter et al., Citation2005) and discourse (Lebel et al., Citation2005), water governance, more specifically, the management and transition framework (Pahl-Wostl et al., Citation2010), vulnerability (Larson et al., Citation2013), relevant dominant uncertainty (RDU) for policy and management applications (Thorne et al., Citation2018), water sustainability assessment framework (Godwyll et al., Citation2018), and integrated analysis of water governance (Quay et al., Citation2018b; Wiek & Larson, Citation2012). The survey was designed to address several research questions, including two related to practices and indicators:
What are land and water managers’ perceptions of the effectiveness of integrated policies and practices to achieve sustainability goals?
What factors are important to land and water managers to assess the current state of achieving sustainability goals and targets?
The first research question helped to examine the credibility and legitimacy of using practitioner perceptions as a general evaluation of the impacts water governance policies have on community water sustainability. The second research question helped to examine the credibility and salience of using water-related indicators to assess over time the impact that water governance policies may have on community water sustainability.
The survey had 17 questions with 119 descriptive items to rate. Of the 17 questions, seven were designed to address the two research questions above. Survey questions 4–9 were based on a list of 34 potential integrated land and water practices grouped into six categories and were developed based on a list of 268 unique water and land practices developed by the Babbitt Center and other research (Quay et al., Citation2018b). includes all six effectiveness survey questions, 34 practice items, both relevant OECD Principles, and which practice each principle pertains to. This list of practices reflects specific aspects of two OECD principles of water governance focused on enhancing the effectiveness of water governance including: (1) Principle 1, clearly allocate and distinguish roles and responsibilities including priority setting and strategic planning, financing and budgeting, infrastructure investment, and regulation and enforcement; and (2) Principle 3, encourage policy coherence through effective cross-sectoral coordination, especially between policies for water and the environment, health, energy, agriculture, industry, spatial planning and land use, including encouraging coordination mechanisms to facilitate coherent policies across ministries, public agencies and levels of government; and coordinated management of the use of water resources, taking into account policies that affect water availability.
Table 1. Survey practice questions with the OECD Principles on Water Governance
To rate these questions, respondents were asked to use a Likert scale of (1) Not at all effective, (2) A little effective, (3) Somewhat effective, (4) Very effective, (5) Extremely effective and (6) Don’t know.
Survey question 14: ‘How important are sustainability indicators in your organization’s assessment of water sustainability’, was based on water sustainability indicators developed by Godwyll et al. (Citation2018), which used a Likert scale ranging from ‘Not at all important’, ‘A little important’, ‘Somewhat important’, ‘Very important’ to ‘Extremely important’. The 12 indicators included:
Balance between groundwater pumping and recharge/replenishment.
Balance between supply and demand.
Meeting basic economic needs for water today and in the future.
Meeting quality-of-life needs for water, such as health, comfort and recreation.
Level of wastewater reuse.
Level of water loss.
Communication and coordination between local, regional, state, and federal managers and planners.
Capacity to continue increasing water efficiency.
Preparing for future water shortages.
Adequate stream flows to sustain environmental integrity and ecosystem functions.
Meeting agricultural needs for water.
Equitable distribution of impact and cost of potable water service.
The target population of the survey was the senior land and water managers for cities and counties with a population over 40,000 within the seven states included in the Colorado River Basin: Arizona, California, Colorado, Nevada, New Mexico, Utah and Wyoming. This included 283 cities and 107 counties representing 566 possible water and land managers from cities and 214 water and land managers from counties. A search for contact information for these managers resulted in 597 unique cohorts (a cohort is a senior land and water manager per city or county). The survey was deployed using Qualtrics; an invitation email was sent to each cohort, which resulted in the completion of 236 surveys.
Practices and policies can be described in general and theoretical terms, but they are implemented by specific people within specific organizations within specific places. Though we often collectively describe these organizations, people and places as society, they each have their own unique attributes which creates a specific context for policy implementation. Understanding this context can be important when assessing cases of such implementation (Gibbons, Citation2000; Larson et al., Citation2009; Volkery & Ribeiro, Citation2009). To explore the context of perceptions of effectiveness and importance, secondary data were collected for each cohort to capture the context of organization and place. Organizational context was represented by identifying the manager type of each respondent (127 land managers and 109 water managers). Place context was represented by census data (average household income, and population) for the place where each respondent worked and the type of government (city/county) for whom they worked. A k-means classification was applied to all the cities’ census data and place type data to create four census groups: Small poor city (41%), large moderate wealth city/county (1%), medium county mixed wealth (30%) and small prosperous city (28%).
Results
Effectiveness
shows the frequencies of responses for questions 4–9 by individual practices. Six of the 34 practices were rated ‘extremely effective’ by at least 30% of the respondents, which include: ‘Acquiring new water supplies’ (34%), ‘Water and wastewater infrastructure’ (39%), ‘Water quality’ (44%), ‘Water resource management planning’ (43%), ‘Water access’ (40%), and ‘Demonstrate sufficient water supply before approving development’ (33%). In addition to these six, 13 of the remaining practices had at least 40% of the respondents rate them ‘Very’ or ‘Extremely’ effective, which included at least one practice for each question group, all the practices under question 4: ‘Water supply management’, at least half of the practices under question 5: ‘Water demand’ and question 9: ‘Water into land regulations and policies’. This suggests that over half of the practices were considered effective.
Table 2. Frequencies and mean practice effectiveness results
No practice had more than 30% of the respondents rate it ‘Not at all effective’ and the four practices with the most respondents indicating ‘Not at all effective’ were ‘Water banking/recovery’ (27%), ‘Net-zero or water demand offset policy’ (27%), ‘Post-occupancy enforcement on water policies by a land use authority’ (24%) and ‘Water allotment’ (26%). This suggests that only a few of the practices were considered not effective.
A few practices had high rates of ‘Don’t know’, including ‘Rates based on water budgets’ (42%), ‘Net-zero or water demand offset policy’ (43%) and ‘Water allotment’ (45%), suggesting there was less experience with these practices.
The variance of the means for these results is not large, but most are skewed towards extremely effective except for ‘Net-zero or water demand offset policy’, ‘Post-occupancy enforcement on water policies by a land-use authority’, ‘Water allotment’ and ‘Incentives for developers based on development water efficiency’ which are skewed towards ‘Not at All’ effective.
There are significant differences in these means between different groups of contexts. shows the results of an analysis of variance (ANOVA) test for differences between land and water manager effectiveness responses; and shows the results for differences between census groups. A total of 50% of the practices showed a statistically significant difference between effectiveness ratings of land managers and water managers. In all but one case for the practices with a statistically significant difference, water managers rated effectiveness higher than land managers. The one exception was ‘Growth boundaries or annexation policies’ which was rated among the water managers’ lowest practices and among the land managers’ highest practices.
Table 3. Analysis of variance (ANOVA) results for the test of difference between land and water manager responses of effectiveness
Table 4. Analysis of variance (ANOVA) results for the test of difference between census group manager responses of effectiveness
More than half of the practices showed statistically significant differences in effectiveness between different census groups. The pattern of these differences was a bit mixed across all the practices. In general, ‘Small prosperous city’ groups rated effectiveness higher than the other groups and ‘Medium county mixed wealth’ group rated effectiveness lower than the other groups. The pattern for the ‘Small poor city’ and ‘Large moderate wealth city/county’ was mixed with some practices being higher than other groups and some being lower than other groups. However, these two groups rarely agreed on practice, if one rated in at the higher end the other would rate it at the lower end.
Water sustainability indicators
Survey question 14: How important are the following sustainability indicators in your organization’s assessment of water sustainability? had land and water managers rate the importance of metrics that could be used to measure some aspect of water sustainability. shows the results for land and water managers’ ratings of the water sustainability indicators listed in rank order based on mean importance. The distributions of ratings for all indicators except three were somewhat normally distributed, though all were skewed slightly to ‘Extremely’. ‘Balance supply demand’, ‘Economic needs met’ and ‘Water shortage’ were all very strongly skewed towards ‘Extremely’. ‘Safe yield’ was bimodal with ratings clustered around ‘None’ and ‘Very’, though less around ‘None’. Three had 20% or more of their ratings of ‘None’ or ‘A little’: ‘Safe yield’ (22%), ‘Water reuse’ (26%) and ‘Agricultural needs met’ (36%). Three had over 80% of their ratings ‘Very’ or ‘Extremely’: ‘Balance supply demand’ (83%), ‘Economic needs met’ (83%) and ‘Quality-of-life met’ (80%). Four are clearly at the top, ‘Economic needs met’, ‘Balance supply demand’, ‘Quality-of-life met’ and ‘Water shortage’. This suggests that water and land managers are focused on ensuring adequate supplies to meet the economic and quality-of-life water needs of their communities. Two indicators were at the bottom of the list: ‘Water reuse’ and ‘Agricultural needs met’.
Table 5. Frequencies (%) of ratings for importance of water sustainability indicators
Managers’ responses are skewed towards ‘Extremely important’ for all the indicators and the skew is quite large for ‘Balance supply–demand’, ‘Economic needs met’ and ‘Quality-of-life met’. There are significant differences in these means between different groups of contexts. shows the results of an ANOVA test for differences between land and water manager importance responses; and presents the results for differences between census groups. Differences between land and water managers were notable with 75% of the indicators showing statistically significant differences at the 95% level. Water managers consistently reported higher levels of importance than land managers. Indicators with differences between responses by census group were not as numerous with only 33% showing statistically significance at the 95% level. The pattern of responses among census groups for the different indicators was somewhat mixed. For the four indicators with a statistically significant difference, ‘Small prosperous cities’ generally ranked the indicators higher than the other groups. Responses in the ‘Medium county mixed wealth’ group were generally lower than the other groups. One exception was ‘Agriculture needs met’, which ranked the highest of all the groups. This indicator was interesting because it had some of the lowest importance ratings of all the indicators (‘Large moderate wealth city/county’ = 2.73 and ‘Medium county mixed wealth’ = 2.67) and the largest difference between the highest and lowest importance ratings of all the indicators with a statistically significant difference.
Table 6. Analysis of variance (ANOVA) results for the test of difference between land and water manager responses of importance of water sustainability indicators
Table 7. Analysis of variance (ANOVA) results for the test of difference between managers responses by census groups of importance of water sustainability indicators
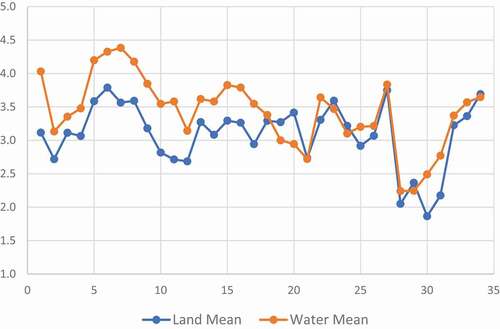
These differences between land and water managers and census groups for perceptions of effectiveness and importance of indicators show a statistically significant absolute difference but do not indicate the relative differences. shows the mean effectiveness of each practice by land managers and water managers, which corresponds to the data in . Though there are in some cases large differences between land and water managers for certain practices, the general pattern of which practices are rated higher, and which are rated lower than others, appear to be the same for land and water managers. shows the results of a Pearson correlation coefficient, which indicates there is a statistically significant correlation (95%) of perceived practice effectiveness means between land and water managers.
Table 8. Pearson correlation of means of practice effectiveness between land and water managers
Figure 1. Mean effectiveness by practice and manager type.
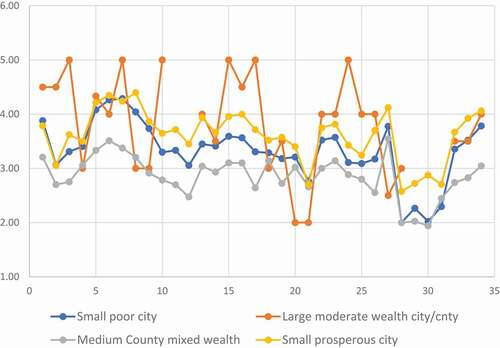
shows a similar pattern for the census groups; and shows Pearson correlation coefficients for each pair of the different census groups. All these correlations were statistically significant but the correlations with large moderate wealth city/county and all three of the other census groups were not that strong.
Table 9. Pearson correlation means of practice effectiveness between census groups
Figure 2. Mean effectiveness by practice and census group.
Similar patterns were found for means of indicator importance. shows the importance means by indicator and manager type. Though there are large differences in the absolute perceptions of importance for several indicators, with water mangers consistently rating indicators higher in importance than land managers, the general pattern of high and low perceptions seems the same for land and water managers. provides the results of a Pearson correlation analysis, which shows a strong statistically significant correlation between land and water manager perceptions.
Figure 3. Mean importance by indicator and manager type.
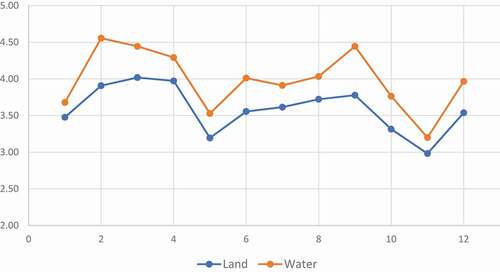
Table 10. Pearson correlation of means of indicator importance between land and water managers
However, these patterns do not bear out for the census groups regarding importance of indicators. shows the mean importance by indicator and census groups. Though there appear to be some patterns that suggest a correlation exists in some cases, there are also some patterns that show discord. presents the results of a Pearson correlation analysis for the different census group pairs. Only one pair, ‘Small prosperous city’ and ‘Small poor city’, show a strong statistically significant correlation at the 95% level, and in one case, the ‘Large moderate wealth city/county’ and ‘Medium county mixed wealth’ pair had a negative coefficient.
Figure 4. Mean importance by indicator and census group.
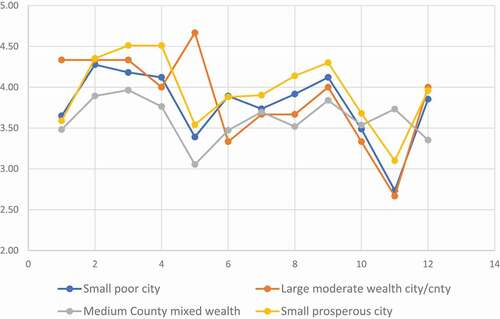
Table 11. Pearson correlation of indicator importance means between census groups
Discussion
Principle 12 of the OECD Principles on Water Governance calls for the evaluation of sustainable water policies. Policies and practices that integrate land and water management are a key component of Principle 3 within the OECD Principles. This research examined two approaches to evaluate these policies: (1) using water and land managers, their perception of effectiveness in achieving organizational water sustainability goals; and (2) using more objective indicators to assess changes in communities’ water sustainability resulting from the implementation of practices over time. The results of this survey suggest both approaches may be useful, but each is likely influenced by organizational and place-based characteristics.
These survey results suggest that using policy managers’ perceptions of effectiveness of integrated land and water management practices to achieve water sustainability appear to be an internally valid methodology. The variance of responses for specific practices was low. Most practices have results close to normal, while others had varying degrees of skewness towards higher and lower effectiveness. Only a few had a binomial distribution. The range of effectiveness across all practices ranged from very high to relatively low (). This all suggests that managers’ perceptions of effectiveness tend to be disbursed in a normal distribution but represent a thoughtful range of opinions.
Organizational and placed-based context does seem to influence managers’ perceptions of absolute effectiveness. On the organizational side, land managers generally rate the effectiveness of individual water-focused practices lower than water managers, and land managers rated some planning focused activities higher than water managers (). But despite these absolute differences in perceptions of effectiveness, land and water managers did generally agree on the relative effectiveness ( and ). These consistent patterns among manager types were not as distinct regarding the placed-based context of the census groups based on population size, wealth and city/county government. Significant differences in perceived effectiveness were found between the census groups with land and water managers from mixed wealth counties rating practice effectiveness the lowest, followed by small poor cities and then small prosperous cities (). There were also correlations between census groups in terms of the lowest and highest rated practices, though this relationship was not as strong as that between land and water managers ( and ).
These differences in context suggest that managers are considering the aspects of their work focus and the characteristics of their community when assessing the effectiveness of practices. They also seem to agree as to which are the lower and higher effective practices within their own context. This suggests periodic surveys to measure progress towards water sustainability over time using managers’ perspectives of effectiveness towards achieving water sustainability would be legitimate within each specific place and organizational context. But it also suggests that when reporting comparisons of effectiveness spatially or temporally, ranges that represent different contexts should be used.
These survey results also suggest that practitioners view the use of more objective indicators of water sustainability as salient (important) metrics to help them manage water sustainability. The variance in responses from managers for specific practices was generally low, even somewhat lower than for variance in the effectiveness of practices. This suggests a high level of agreement about importance of indicators. However, almost half of the indicators had large amounts of skew towards the ‘extremely important’ levels, which suggests that some indicators are of high importance (). Among these were ‘Balance supply–demand’, ‘Economic needs met’, ‘Quality-of-life met’, ‘Increasing water efficiency’ and ‘Water shortage’, which represent a core set of indicators highly valued for importance. Interestingly, two of these, ‘Economic needs met’ and ‘Quality-of-life met’, are less often part of the discussion about water and land management and do not currently have traditional or standard ways to measure them.
The contexts of organization and place also appear to be influencing perceptions of indictor importance. Just as with perceptions of effectiveness, water managers rated the importance of all indicators higher than land managers (). In this case, there also was a high correlation between water and land managers’ perceptions of high and low importance, with general agreement on which were more important than others ( and ). However, context of place, as represented by the census groups, had different results. In general, the pattern in perceptions of importance was similar to that of effectiveness perceptions, mixed wealth counties rated indicator importance the lowest, followed by small poor cities and then small prosperous cities. But in this case, there were some indicators that did not follow this pattern where importance was rated the same or importance was flipped with one group of practices higher and the other group lower.
These patterns of differences in perceptions of indicator importance based on organizational and place context suggest a few implications. The correlation between land and water managers’ perceptions of indicator importance suggests that within an organization, either a city or a county, some agreement can be reached on a single set of indicators used by water and land managers. However, the lack of correlation among the census groups suggests that this set of common organizational indicators might be different from one city to another, and one county to another. There are also some indicators that share a common vector of importance between census groups, which would indicate that there is an opportunity for a few indicators to provide a common comparison across different places.
Conclusions
Principle 12 from the OECD Principles on Water Governance calls for the evaluation of policies’ impact on water sustainability and its effect on change in the policies based on this evaluation. This will require some method of measuring the effectiveness of policies. Measuring water sustainability in a manner that is salient to practitioners is not straightforward because salience is heavily influenced by the context of place and organization. The organizational context was represented by identifying the manager type of each respondent (land and water managers) and place context was represented by census data (average household income, and population) for the place where each respondent worked and the type of government (city/county) for whom they worked. However, using perceptions of water sustainability is a valid approach to measuring sustainability in the current timeframe and useful for the reflection on current practices. Although this can be repeated over time to assess changes, perceptions of water sustainability are subject to some variance and are influenced by the context, such as characteristics of place and organization. If these change over time as well, this may introduce changes in perceptions. Any scheme to develop a standard method of assessing the effectiveness of practices of integrated land and water policy to impact water sustainability must do so with an understanding of the influences of context such as organization and place.
Water and land managers have strong perceptions of the importance of using specific indicators to assess levels of a community’s water sustainability in the present and over time. Managers’ perceptions of indicator importance also appear to be influenced by the context of organization and place. This seems strongest regarding place. Any scheme to develop and track indicators should recognize that different indicators will be salient to different places, though there are some that will be important to all places.
More research is needed to identify how other factors of context may influence perceptions of effectiveness and importance of indicators, such as water sources, landforms, climate, politics and institutional frameworks. Ultimately, we need research to connect perceptions of effectiveness and more objective indicators so we can assess exactly how and why effective practices do (or do not) contribute to the broader picture of water sustainability. It will only be through this evidence of evaluation that institutions will be able to effectively adjust the course of their policies.
Author contribution statement
The Land Wager Survey (LWS) project was initiated in 2019. RQ was the project manager for ASU and FS was the project manager for Lincoln. The project was conceived in a workshop with RQ, FS, RA, DW, JH, ZS, and ER2. Questions were initially developed by RA and finalized in a workshop with RQ, FS, RA, DW, JH, ZS, and ER2. ER2 and RQ developed the list of practices, RQ and ZS developed the list of indicators, AB and ER1 developed the secondary data. RQ, ER1 and AB developed the list of targeted survey cohorts and managed the survey deployment. RQ, ER1, and DW designed and conducted the statistical analysis. RQ, FS, RA, ER1, AB, DW, JH, ZS, and ER2 reviewed results. RQ and FS created the initial article draft which was reviewed by ER1, RA, AB, DW, JH, ZS, and ER2 before submission, RQ and FS managed the submission and peer and editor review process.
Geolocation
This research focused on the Colorado River Basin states of Arizona, California, Colorado, Nevada, New Mexico, and Wyoming within the United States of America.
Acknowledgments
This work was funded, in part, by the Babbitt Center for Land and Water Policy, Lincoln Institute of Land Policy and by the National Science Foundation SES-0951366.
The authors report there are no competing interests to declare.
Disclosure statement
No potential conflict of interest was reported by the author(s).
Additional information
Funding
References
- Carter, N., Kreutzwiser, R. D., & de Loë, R. C. (2005). Closing the circle: Linking land use planning and water management at the local level. Land Use Policy, 22(2), 115–127. https://doi.org/https://doi.org/10.1016/j.landusepol.2004.01.004
- Department of Water Resources. (2013). California Water Plan: Update 2013 – Volume 1: The strategic plan (p. 420). State of California.
- Fedak, R., Sommer, S., Hannon, D., Beckwith, D., Nuding, A., & Stitzer, L. (2018). Integrating land use and water resources: Planning to support water supply diversification. In Project #4623A’ (p. 144). Water Research Foundation. https://www.waterrf.org/research/projects/integrating-land-use-and-water-resources-planning-support-water-supply
- Gibbons, M. (2000). Mode 2 society and the emergence of context-sensitive science. Science & Public Policy, 27(3), 159–163. https://doi.org/https://doi.org/10.3152/147154300781782011
- Gober, P., Sampson, D. A., Quay, R., White, D. D., & Chow, W. T. L. (2016). Urban adaptation to mega-drought: Anticipatory water modeling, policy, and planning for the urban Southwest. Sustainable Cities and Society, 27(Suppl. C), 497–504. https://doi.org/https://doi.org/10.1016/j.scs.2016.05.001
- Godwyll, J., Quay, R., & White, D. D. (2018). An assessment of water sustainability indicators for the Colorado River Basin. Decision Center for Desert City, Julie Ann Wrigley Global Institute of Sustainability, Arizona State University. https://sustainability-innovation.asu.edu/dcdc/wp-content/uploads/sites/2/2020/03/Babbitt-Water-Sustainability-Indicator-Project_LM_Report-Final-Draft-No-Endnote.pdf
- Goodland, M. (2021, August 16) Bureau of Reclamation declares first-ever shortage on the Colorado River basin, triggering water reductions. Colorado Politics. Retrieved January 2, 2022, from https://www.coloradopolitics.com/news/bureau-of-reclamation-declares-first-ever-shortage-on-the-colorado-river-basin-triggering-water-reductions/article_c4d53aae-fed6-11eb-99ab-572607ec7d67.html
- Hansman, H. (2021, July). Bridging the divide: Why integrating land and water planning is critical to a sustainable future. Land Lines, Lincoln Institute of Land Policy, 28–37. https://www.lincolninst.edu/sites/default/files/pubfiles/bridging-the-divide-lla210706.pdf
- Hondula, D. M., Sabo, J. L., Quay, R., Chester, M., Georgescu, M., Grimm, N. B., & White, D. D. (2019). Cities of the Southwest are testbeds for urban resilience. Frontiers in Ecology and the Environment, 17(2), 79–80. https://doi.org/https://doi.org/10.1002/fee.2005
- Hufschmidt, M. M., & Tejwani, K. G. (1993). Integrated water resource management – Meeting the sustainability challenge. UNESCO.
- Jones, J. A. A. (2011). Water sustainability: A global perspective. Routledge.
- Larson, K. L., Polsky, C., Gober, P., Chang, H., & Shandas, V. (2013). Vulnerability of water systems to the effects of climate change and urbanization: A comparison of Phoenix, Arizona and Portland, Oregon (USA). Environmental Management, 52(1), 179–195. https://doi.org/https://doi.org/10.1007/s00267-013-0072-2
- Larson, K. L., White, D. D., Gober, P., Harlan, S., & Wutich, A. (2009). Divergent perspectives on water resource sustainability in a public–policy–science context. Environmental Science & Policy, 12(7), .1012–1023. https://doi.org/https://doi.org/10.1016/j.envsci.2009.07.012
- Lebel, L., Garden, P., & Imamura, M. (2005). The politics of scale, position, and place in the governance of water resources in the Mekong region. Ecology and Society, 10(2), 18. https://doi.org/https://doi.org/10.5751/ES-01543-100218
- McCabe, G. J., & Wolock, D. M. (2021). Water balance of the turn-of-the-century drought in the Southwestern United States. Environmental Research Letters, 16(4), 044015. https://doi.org/https://doi.org/10.1088/1748-9326/abbfc1
- Meijers, E., & Stead, D. (2004). Policy integration: What does it mean and how can it be achieved? A multi-disciplinary review. Paper presented at Berlin Conference on the Human Dimensions of Global Environmental Change: Greening of Policies – Interlinkages and Policy Integration. Berlin. https://www.polsoz.fu-berlin.de/en/polwiss/forschung/systeme/ffu/forschung-alt/projekte/abgeschlossene/04_bc2004/index.html
- Miller, O. L., Putman, A. L., Alder, J., Miller, M., Jones, D. K., & Wise, D. R. (2021). Changing climate drives future streamflow declines and challenges in meeting water demand across the southwestern United States. Journal of Hydrology X, 11, 100074. https://doi.org/https://doi.org/10.1016/j.hydroa.2021.100074
- OECD. (2015). OECD Principles on Water Governance. https://www.oecd.org/cfe/regionaldevelopment/OECD-Principles-on-Water-Governance-en.pdf
- Pahl-Wostl, C., Holtz, G., Kastens, B., & Knieper, C. (2010). Analyzing complex water governance regimes: The management and transition framework. Environmental Science & Policy, 13(7), 571–581. https://doi.org/https://doi.org/10.1016/j.envsci.2010.08.006
- Quay, R., Hester, C., Larson, K. L., & White, D. D. (2018a). Urban landscape water use research evaluation (Project #4633). Water Research Foundation.
- Quay, R., Lawless, K., & Ryder, K. (2018b). Assessing the connection between Land Use Planning and Water Resource Planning. Decision Center for Desert City, Julie Ann Wrigley Global Institute of Sustainability, Arizona State University. https://sustainability-innovation.asu.edu/dcdc/wp-content/uploads/sites/2/2019/09/ASU_Lincoln_ReportFINAL_AssessingTheConnectionBetweenLandUsePlanning_December2018.pdf
- Quay, R. (2012). Managing water resources: The central issue for sustaining life. In D. Pijawka & M. Gromulat (Eds.), Understanding sustainable cities: Concepts, cases, and solutions (pp. 287). Kendall Hunt.
- Räsänen, A., Nygren, A., Monge, M., Adrián, K., Mira, K. M., & Juhola, S. (2018). From divide to nexus: Interconnected land use and water governance changes shaping risks related to water. Applied Geography, 90, 106–114. https://doi.org/https://doi.org/10.1016/j.apgeog.2017.11.005
- Sakas, M. E. (2021, August 16th) The first-ever Colorado River water shortage has been declared. What does that mean for Colorado? Colorado Public Radio News. Retrieved January 2, 2022, from https://www.cpr.org/2021/08/16/colorado-river-water-shortage-declared/
- Sampson, D. A., Quay, R., & White, D. D. (2016). Anticipatory modeling for water supply sustainability in Phoenix, Arizona. Environmental Science & Policy, 55(Part 1), 36–46. https://doi.org/http://dx.doi.org/10.1016/j.envsci.2015.08.014
- Thorne, C. R., Lawson, E. C., Ozawa, C., Hamlin, S. L., & Smith, L. A. (2018). Overcoming uncertainty and barriers to adoption of Blue‐Green Infrastructure for urban flood risk management. Journal of Flood Risk Management, 11(S2), S960–S972. https://doi.org/https://doi.org/10.1111/jfr3.12218
- Udall, B. (2020). 7 Running on empty: Southwestern water supplies and climate change. In J. Williams, D. Propst, K. Bestgen, & C. Hoagstrom (Eds.), Standing between life and extinction: Ethics and ecology of conserving aquatic species in North American Deserts (pp. 109–123). University of Chicago Press.
- Volkery, A., & Ribeiro, T. (2009). Scenario planning in public policy: Understanding use, impacts and the role of institutional context factors. Technological Forecasting and Social Change, 76(9), 1198–1207. https://doi.org/https://doi.org/10.1016/j.techfore.2009.07.009
- Wiek, A., & Larson, K. L. (2012). Water, people, and sustainability—A systems framework for analyzing and assessing water governance regimes. Water Resources Management, 26(11), 3153–3171. https://doi.org/https://doi.org/10.1007/s11269-012-0065-6
- World Commission on Environment and Development (WCED). (1987). Our common future, the Brundtland Commission Report. Oxford University Press.