
ABSTRACT
Access to accurate and trusted data for transboundary water management is important but not always sufficiently appreciated. Based on the Lake Victoria water levels decline, this technical note demonstrates that when a water crisis unfolds, tensions can arise because of absence of relevant data and uncertainty over data that are available. These may hamper the process towards agreeing on actions to be taken, thus delaying crisis resolution. This technical note demonstrates the importance of reliable data in a sensitive transboundary water situation. Countries therefore should allocate sufficient resources for adequately monitoring the state of transboundary water resources within their territories.
Introduction
Access to accurate and trusted data for the management of transboundary water resources is very important but not always sufficiently appreciated. Ground observations of river discharges have been declining globally (Fekete & Vörösmarty, Citation2007; Lorenz & Kunstmann, Citation2012). This technical note demonstrates that when a water crisis unfolds, tensions can arise because of the absence of relevant data and uncertainty over data that are available. It makes a case for countries to allocate sufficient resources for adequately monitoring the state of transboundary water resources within their territories, and transparently sharing these data with their fellow riparians.
Lack of precise data creates opportunities for stakeholders to explain observed undesirable phenomena, such as dwindling water levels, in different ways, often in accordance with their own particular self-interests. This may stand in the way of quickly resolving the problem by addressing root causes. As a consequence, citizens and stakeholders unnecessarily incur costs or suffer damages that could have been avoided or resolved faster.
The declining water levels of Lake Victoria, as observed from about the year 2000 to October 2006, provide a clear-cut case of appropriate institutions lacking evidence-based information to make informed decisions. As a result, decision-making was postponed, foreign consultants had to be hired and an agreed final report was delayed by at least four years. The rains helped the lake to recover to levels that were considered normal during the period 2007–10.
The remainder of the paper is structured as follows. It next describes the controversy at hand, then briefly describes the five most prominent alternative explanations of the cause of the controversy , after which it reviews the responses of experts and institutions. The final section concludes.
Setting the scene
This section briefly describes the crisis associated with lake level declines, and then proceeds with a basic description of the lake’s water balance
The lake level crisis (2004–06)
The lake level decline disrupted a way of life for citizens living close to the shores of the lake in all the cities and towns spread out across East Africa. The lake is a source of drinking water for the many residents, and when the lake receded, several drinking water installations for lake abstraction were left behind and the responsible entities had to extend their pipelines into the receding lake. Second, all the piers at fish landing beaches from where fishing vessels would dock to discharge their cargo were also left offshore and the small vessels and large fishing boats could not dock at their designated sites. Lastly, navigation was also disrupted because the lake receded and the cargo could not be loaded or unloaded because vessels could not access the docks. In short, three main economy sectors: water supply, fisheries and navigation, were adversely disrupted.
From 1998 to the end of 2006 Lake Victoria’s water levels were steadily declining (). When in August 2004 the levels went below 11.2 m as measured at Jinja, Uganda, the first outcries appeared in the newspapers. ‘Alarm as Lake Victoria levels fall’ due to excessive water use for power generation in Uganda, which affected lake transport and fisheries, wrote the Daily Nation, a major Kenyan newspaper, on 27 August 2004. On 3 October 2004, the Ugandan New Vision newspaper headlined ‘Lake Victoria levels to drop further’, mentioning the delayed rains as the main cause, and observing that the last time lake levels had risen had been in 1997. The low lake levels severely affected the old Nalubaale (formerly Owen Falls) and the new Kiira hydropower stations, both located at the natural outlet of the lake near Jinja and where the White Nile starts, resulting in frequent power outages. A year went by and the lake continued to shrink. On 15 November 2005, another front cover story in the Kenyan Daily Nation read ‘Alarm on Lake Victoria waters’. Interviewed government and World Bank officials told the newspaper that the continued decline in lake levels and increase in siltation spelled doom for the lake, leading to the deterioration of its health and threatening fish. The major cause of the declining levels was cited as being poor environmental management in the catchment areas of the lake.
Figure 1. Lake Victoria’s monthly water levels, January 1998–December 2010.
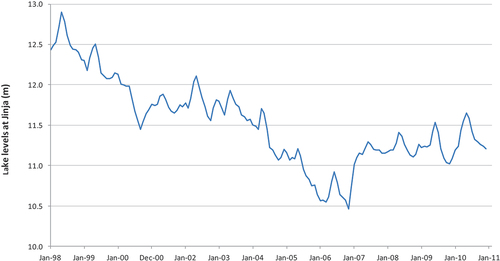
From the very beginning, alternative explanations for the causes of the declining lake levels were given: excessive hydropower generation by Uganda, climate-related issues and environmental degradation in upstream catchments.
As the decline continued, the first three months of 2006 saw a flurry of articles in Ugandan and Kenyan newspapers, with alarmist headlines such as ‘Lake Victoria is drying up’ (Sunday Vision, Uganda, 3 January), ‘Save shrinking Lake Victoria’ (The Monitor, Uganda, 5 January) and ‘Falling water levels spells doom for Lake Victoria’ (The Standard, Kenya, 13 February). In an article entitled ‘States to discuss falling Lake Victoria level’, The East African (Kenya, 28 March) announced that in April the East African Community (EAC) Council of Ministers would convene a meeting to discuss falling lake levels.
The water balance of Lake Victoria
In trying to make sense of the rather capricious behaviour of the lake, and in particular its water levels, many reports and studies have focused on the lake’s water balance (e.g., before the crisis: De Baulny & Baker, Citation1970; Kite, Citation1982; Piper et al., Citation1986; Sene & Plinston, Citation1994; Yin & Nicholson, Citation1998; Tate et al., Citation2004; COWI Consulting Engineers and Planners AS, in association with DHI Water and Environment, Citation2002; and after the crisis: Blackmore & Whittington, Citation2008; Swenson & Wahr, Citation2009; Vanderkelen et al., Citation2018). The water balance has, however, been elusive to many observers. Even an authoritative study commissioned by the Lake Victoria Basin Commission Secretariat (LVBCS) concludes that:
using the Sene and Plinston (Citation1994) water balance procedure to reproduce values of NBS [net basin supply, i.e., inflows into the lake from tributaries plus precipitation on the lake minus evaporation from the lake], estimated from outflows and change of storage in Lake Victoria, over the period January 1991 to December 2009 […] produces a value which is 33% too high. (LVBCS, Citation2012, vol. 1, pp. 62–63)
Strangely, the report does not mention the large uncertainties about the actual amount of rainfall on the lake and the evaporation from it, yet these are by far the largest components of the water balance (). It is important to note that rainfall and evaporation are nearly equal in size, and during certain series of years the balance may be in favour of rainfall (most of the time), but in other periods evaporation may be larger.
Figure 2. Water balance of Lake Victoria, averages over the period 1950–2000.
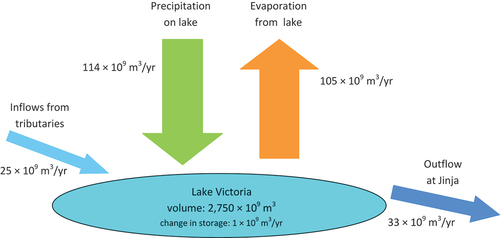
The Lake Victoria water balance has at least three interesting characteristics.Footnote1 First, two components, precipitation on and evaporation from the lake, are relatively large compared with the inflows from tributaries and the outflow at Jinja. Second, these two large natural components are not easily managed by human intervention, whereby it should be noted that the evaporation component fluctuates less over time than rainfall. Third, only two components of the water balance can be measured with some level of accuracy, namely the change of water storage in the lake (through lake level measurements) and the outflow at Jinja. Most of the many tributaries are ungauged and their flows into the lake are unknown. Further, precipitation on and evaporation from the lake are not known by any measure of accuracy. The first two characteristics combined render the lake susceptible to large-scale fluctuations, since there are long-term (multi-year) fluctuations of rainfall that have a significant impact on lake levels and lake outflows. Whereas in 2006 there was a crisis of lake water levels being too low, in 2020 they were too high: villages were flooded because the lake levels had increased to unprecedented heights (Khaki & Awange, Citation2021).
The third characteristic implies that if something salient happens, such as a serious decline of lake levels, there are alternative explanations possible. And that is exactly what happened during the period 2004–06. This created a level of ambiguity that could be exploited by different actors with particular and differing interests.
Alternative explanations and narratives of the lake level decline
Alternative explanations formed narratives that can be conveniently grouped along the various components of the water balance. One narrative concerned the reduced precipitation on the lake during the period 2003–06. Another narrative focused on climate change, arguing that global warming had led to increased evaporation from the lake. A third narrative focused on environmental degradation in the upstream catchment areas, which was believed to have led to reduced inflows into the lake. A fourth narrative also concerned the reduced inflows into the lake, but explained it because of increased abstractions in upstream catchment areas, in particular for use in irrigated agriculture. Finally, a fifth narrative explained the declining lake levels due to over-releases by the two power plants at Jinja, over and above the amounts that follow from the Agreed Curve (see Box 1). These five narratives are briefly discussed below.
Precipitation on the lake has decreased
Several experts who have studied the water balance of Lake Victoria concur that lake level fluctuations are highly influenced by variability of rainfall (e.g., Yin & Nicholson, Citation2002; Kizza et al., Citation2009; Tate et al., Citation2004). And indeed one of the first newspaper articles on the lake level decline blamed the delay in the rains (New Vision, Uganda, 3 October 2004; Sunday Vision, Uganda, 12 March 2006; The East African, Kenya, 28 March 2006; Daily Nation, Kenya, 7 June 2006). The LVEMP (Citation2005) and LVBC (Citation2007) echoed this sentiment and reported reduced precipitation over the period 2000–06.
Yet, climatologists are not in agreement, and the deviation from the mean over that period was small (e.g., Awange et al., Citation2008; Kizza et al., Citation2009), although Blackmore and Whittington (Citation2008) and Swenson and Wahr (Citation2009) report greater reductions in rainfall, the latter using satellite-derived data without explaining how these were calibrated. Awange et al. (Citation2008) also relied on satellite-derived data, which require calibration with ground data, but these were difficult to access, and it is implied that this could not be done. Later studies have similarly estimated rainfall on the lake using remote sensing data (e.g., Awange et al., Citation2019; Vanderkelen et al., Citation2018), but all suffer from the same problem that these cannot be validated or corrected because there are no ground observations in the lake. Long-term water balance studies arrive at large differences in this component of the water balance (at least 5%, which is equivalent to approximately 20% of inflows into the lake; Blackmore & Whittington, Citation2008; LVEMP, Citation2005; Piper et al., Citation1986; Yin & Nicholson, Citation1998). Finally, the LVBCS-commissioned study by the Centre for Ecology and Hydrology (CEH) still bases its estimation of rainfall on the lake on records of lakeshore rainfall without any validation with observations of actual rainfall on the lake (LVBCS, Citation2012, Vol. 1, section 4.2, pp. 38–40). This is important because given the size of the lake, it is unlikely that the climate of the lake shore is representative of the entire lake area. The above implies that there are no validated scientific data on rainfall on the lake, which is worrisome, since this constitutes the largest source of water for the lake.
Evaporation from the lake has increased
Evaporation from the lake is believed to have increased because of an increase in temperature due to climate change. This was found by a study commissioned by the Ugandan Ministry of Energy and Mineral Development (WREM International, Citation2005), which was echoed by Mubiru (Citation2006), but global warming was cited by many newspaper articles as well (Sunday Vision, Uganda, 3 January 2006; The Monitor, Uganda, 5 January 2006; The Standard, Kenya, 13 February 2006).
Yet the literature provides no scientific evidence that indeed evaporation levels have increased, and whereas experts mention that the long-term variations in actual evaporation are relatively small, different long-term water balance studies arrive at different figures, with these differences amounting to between 2% and 4%, which are small relative differences, but they translate into large absolute volumes. What is clear, just as with precipitation on the lake, is that there is a lack of precise, validated data on actual lake evaporation, which again is worrisome since this constitutes the largest loss of water from the lake.
Environmental degradation has caused a decrease of inflows to the lake
Several newspapers mentioned that environmental degradation in upstream catchment areas had contributed to lake level decline and increased levels of siltation (e.g., Daily Nation, Kenya, 15 November 2005). A report of the EAC standing committee on agriculture, tourism and natural resources indicated that the reduction in catchment inflows was a result of a decrease in forest cover coupled with unsustainable farming practices, destruction of wetlands and overgrazing (East African Legislative Assembly, Citation2006). In September 2008, the UN-Habitat Secretary met with the ministers responsible for water of the five EAC countries and attributed the falling Lake Victoria water levels mostly to environmental degradation.
However, in the scientific literature there is no evidence that land degradation led to a decrease in river discharge. If anything, environmental degradation in upstream catchments is likely to increase river flows (e.g., Gebremicael et al., Citation2013).
Increased water abstractions have caused a decrease in inflows to the lake
A fourth narrative focused on increased abstractions in upstream catchment areas, in particular for irrigated agriculture, industries and domestic water use in towns and cities. Several newspaper articles blamed flower farmers, for example (Sunday Vision, Uganda, 3 January 2006). The LVBCS-commissioned study by the CEH estimated that existing abstractions within the Lake Victoria basin amounts to approximately 1.2 × 10⁹ m3/year, which it equated to nearly 5% of the long-term mean outflow at Jinja, and which should have caused a decline of the lake level of about 0.02 m (LVBCS, Citation2012, vol 1, p. 75). Whereas this study was able to estimate total water abstractions, the data on water flowing into the lake are extremely limited. Only during the period 1969–77 were the 20 major tributaries flowing into Lake Victoria gauged, representing 80% of the total catchment area. Only five major catchments have records before 1969: the Kagera catchment mainly located in Burundi, Rwanda and Tanzania, and four catchments located in north-west Kenya (Yala, Nzoia, Sondu and Awach Kaboun). These five tributaries make up 40% of the lake’s catchment area (LVBCS, Citation2012, vol 1, p. 38), but their flows stopped being measured in 1985 (for the Kenyan catchments) and in 1990 (for Kagera River). Thus, at the time of the crisis there were no measurements of water flowing into the lake. The estimates of water inflows into the lake were based on modelling results rather than on data for the mentioned five catchments, and their extrapolation to the entire catchment area based on a relationship established for the period 1969–77 (LVBCS, Citation2012, vol 1, p. 58).
It must be clear from the above that estimates of current inflows into the lake have a large uncertainty and error margin. It is thus impossible to ascertain with any measure of accuracy whether catchment inflows had increased, decreased or remained stable.
Power plants at Jinja have released above the ‘Agreed Curve’
The first public outcry about the alleged over-release at the two power plants at Jinja was a newspaper article in the Daily Nation of Kenya on 27 August 2004, which was followed by many others, and even Ugandan newspapers started to mention this in early 2006. It is important to realize that Uganda would not make data on actual water releases at Jinja public. It was only when in February 2007 a company assessing the feasibility of the proposed Bujagali II hydropower dam published its report which contained a dataset on water releases at Jinja (PPA, Citation2007) that independent scientists were able to verify these claims (e.g., Sutcliffe & Petersen, Citation2007). Over the period between end of 2005 and end of 2007, a consensus emerged that some 50% of the observed lake level decline could be attributed to over-releases from the power plants at Jinja (this was confirmed by later studies, e.g., Vanderkelen et al., Citation2018). Still, there were some who strongly denied this, including Mubiru (Citation2006) and Tickodri-Togboa (Citation2011).
The responses
It may be concluded from the previous section that the lake’s water balance remains difficult to determine, simply because the majority of its components are not known by any measure of accuracy. This continues to create opportunities for strategic counter-narratives. The responses came from two sides. First, experts conducted studies to try to explain the sudden decline in water levels, followed by intergovernmental responses. These are presented below.
Expert studies
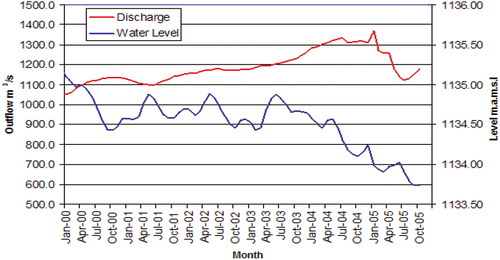
Authorities are expected to address crises. Already at the end of 2005, a first authoritative report was published (the end report of the Lake Victoria Environmental Management Programme Phase 1; LVEMP, Citation2005) that highlighted that during the period January 2000–January 2005, the Ugandan hydropower operators had not respected the so-called ‘Agreed Curve’, which prescribes allowed water releases from the lake into the White Nile at Jinja, as a function of the water level of the lake, so as to mimic the natural flow from the lake (see Box 1). While during that period lake levels steadily declined, the amount of water released from Nalubaale and the new Kiira hydropower stations increased ().
Box 1. Owen Falls Dam of 1954 and the ‘Agreed Curve’
In 1949, Britain, the then-colonial master of Uganda, and Egypt signed a bilateral agreement to construct a dam on Lake Victoria’s only outlet (‘Exchange of notes regarding the construction of Owen Falls Dam’, dated 31 May 1949; Beach et al., Citation2000). The agreement included a provision that Uganda (although not a signatory) could build (or contract to build) a hydroelectric dam as long as the dam ‘did not adversely affect the discharge of water to be passed through the dam […]’. In December 1949, a contract for building the Owen Falls Dam amounting to nearly £4 million was signed between Britain (Uganda) and Egypt with the slot ‘water allocation’ filled to read ‘Refer to 1929 Nile Treaty’ (Beach et al., Citation2000).
The 1929 Nile Treaty was an ‘Exchange of notes between Her Majesty’s Government in the United Kingdom and the Egyptian Government on the use of waters of the Nile for irrigation’ in Cairo on 7 May 1929. A key provision is 4(b):
Except with the prior consent of the Egyptian Government, no irrigation or power works or measures are to be constructed or taken on the River Nile or its branches, or on the lakes from which it flows so far as all these are in the Sudan or in countries under British administration, which would in such a manner as to entail prejudice to the interest of Egypt, either reduce the quantities of water arriving in Egypt, or modify the date of its arrival, or lower its level.
The Owen Falls Dam was completed in 1954. Dam operating rules were developed so that the now human-controlled releases were made to mimic the natural flow regime that existed before Ripon Falls rocks were blasted to make way for accelerated flow to the dam. The so-called ‘Agreed Curve’ relates releases to lake levels using the Jinja gauge (Sene & Plinstone, Citation1994).
The ‘Agreed Curve’ relating the Jinja gauge level and lake outflow.
Source: Sutcliffe and Petersen (Citation2007)
The LVEMP (Citation2005) report, among others, updated the water balance study earlier done by COWI Consultants that covered the period 1950–2000. The report concluded that the observed fall in lake level was a result of a combination of two factors: (1) reduced input in terms of rain and inflows into the lake; and (2) increased outflows caused by excess releases at Jinja. It was even able to quantify the relative contribution of the ‘excess releases’ that accounted for 45% of the total fall in the period 2001–04 (LVEMP, Citation2005).
This finding must have been embarrassing for the Uganda government: the only components of the lake’s water balance that can be directly influenced by humans and thus be managed, namely the releases by the two hydropower dams, were identified as a major driver of the decline.
An international non-governmental organization (NGO), International Rivers (then still known as International Rivers Network) based in the United States, subsequently commissioned a study by a Kenyan-based hydrologist (Kull, Citation2006). This study confirmed the LVEMP report’s findings (excessive releases from the Ugandan hydropower dams were responsible for 55% of the lake level declines, the balance by ‘natural characteristics’), which was later also confirmed by Sutcliffe and Petersen (Citation2007). Kull (Citation2006) pointed out that the commissioning of the Kiira hydropower plant in 2000, which added 200 MW to Uganda’s electricity generating capacity, was likely to have increased the water releases from the lake, as it was situated next (in parallel) to the existing Nalubaale hydropower plant (180 MW), and not in series. In the meantime, the increased generating capacity could not keep up with growing electricity demand of the Ugandan economy.
Intergovernmental response (2006–12)
The EAC Secretariat convened a meeting for permanent secretaries responsible for these sectors in 2005 at which the LVEMP I report was presented and deliberated. This was immediately followed by a factfinding tour, where the permanent secretaries listened to stakeholders narrate their experience with declining lake levels and witnessed for themselves the extent of the negative economic impacts. The report they compiled highlighted the negative effects on many sectors of the economy. The permanent secretaries’ tour and its report prepared the ground for a Council of Ministers meeting to chart a way forward to address the lake decline and reverse the losses.
In April 2006, the EAC Council of Ministers meeting issued a directive to the LVBCS to formulate and implement a new policy to regulate the water release from Lake Victoria based on a modification of the current Agreed Curve policy (East African Community, Citation2006). The ministers indicated that the proposed new regime be flexible and adaptive to the present needs of the EAC partner states, reflecting the current realities and one that takes into account the interests of all stakeholders, both down- and upstream of the lake.
In response to the directive, the LVBCS established in 2007 the Lake Victoria Water Release Task Force, which consisted, in its initial formation, of nine experts, three drawn from each of the then-EAC partner states. The three from each country comprised of a water resources specialist, a hydrologist and a legal/water rights officer (Okonga, Citation2010).
From the most intense dynamics that occurred at the end of 2005 and early 2006, we see that gradually the urgency of the matter decreases. From January 2006, the operator of Nalubaale and Kiira plants started to comply again with the Agreed Curve. Helped by ‘natural factors’, the lake levels started to increase again ().
The main activity of the taskforce was to commission a study that would critically examine the Agreed Curve policy, prepare an alternative discharge/water release regime that optimizes lake storage, examine the potential social and economic impacts of the proposed regime, and to propose an appropriate monitoring mechanism (East African Community, Citation2008).
In December 2007, a consortium of consultants led by the UK-based Centre for Ecology and Hydrology was hired to conduct the study. A year later the consortium presented its final report, but the taskforce did not accept it as there were gaps that needed to be worked on (LVBC, Citation2010). The most important gap was the absence of upstream abstractions in the water balance computations (Okonga, Citation2010). This implied, the taskforce argued, that only the lake levels and releases were considered in determining a proposed new releases regime, and this was considered unacceptable. An extraordinary meeting of the Council of Ministers was necessary to confirm that the scope of the study had to be expanded to include not only current abstractions but also future abstractions and the potential impacts of climate change, and to review the proposed ‘zones’ of the release policy, as proposed in the initial final report, ‘taking cognisance of abstractions and consider additional zones as appropriate, which do not create shocks to the hydropower generation system’ (LVBC, Citation2009, p. 9). The extension of the contract was awarded in October 2009; CEH signed the contract in April 2010 and submitted its final report in February 2012.
Conclusions
The water balance of the lake remains elusive simply because some of its components are not quantifiable by any measure of accuracy. The biggest gains can be made by improving the accuracy of the two largest components with the largest uncertainties, namely rainfall on and precipitation from the lake, through the establishment of a number of climate stations on some of the lake’s mini-islands. This will allow the calibration/correction of remotely sensed data and will greatly improve their accuracy. Combined with known lake levels and releases from the lake, the inflows from the tributaries can then be more accurately calculated.
Given how vital water resources of Lake Victoria are for the economies of Tanzania, Kenya and Uganda, these countries should prioritize investments in such stations, in data-sharing protocols and real-time-sharing mechanisms and platforms, and – ideally – engage in joint monitoring. Moreover, as a complementary effort, citizen science could generate relevant data by involving fishermen who are regularly out on the lake in data collection for ground-truthing remotely sensed data.
Using the Lake Victoria case, this paper has shown that lack of accurate and trusted data can create additional complications in an already sensitive environment of the management of transboundary water resources. It makes a case for countries to allocate sufficient resources for adequately monitoring the state of transboundary water resources within their territories, and transparently sharing these data with their fellow riparians.
In this context it is interesting to note that the unprecedented increase in lake levels in 2020 was generally accepted to be caused by climatic factors, including climate change, and did not cause a data controversy between the riparian countries of Lake Victoria.
Disclosure statement
No potential conflict of interest was reported by the authors.
Notes
1. We ignore the groundwater component of the lake’s balance, which is also ignored by most cited works. It is apparently assumed that the amount of water lost to aquifers (percolation) is of the same order of magnitude as the amount of water gained from aquifers (seepage) and that different lake levels do not affect this balance. We also ignore consumptive use of water directly withdrawn from the lake, which is estimated by several authors to be small compared with the other components of the water balance.
References
- Awange, J. L., Saleem, A., Sukhadiya, R. M., Ouma, Y. O., & Kxiang, H. (2019). Physical dynamics of Lake Victoria over the past 234 years (1984–2018): Is the lake dying? Science of the Total Environment, 658, 199–218. https://doi.org/10.1016/j.scitotenv.2018.12.051
- Awange, J. L., Sharifi, M. A., Ogonda, G., Wickert, J., Grafarend, E. W., & Omulo, M. A. (2008). The falling Lake Victoria water level: Grace, TRIMM and Champ satellite analysis of the lake basin. Water Resources Management, 22(7), 775–796. https://doi.org/10.1007/s11269-007-9191-y
- Beach, H. L., Hammer, J., Hewitt, J. J., Kaufman, E., Kurki, A., Oppenheimer, J. A., & Wolf, T. A. (2000). Transboundary freshwater dispute resolution – Theory, practice and annotated references (pp. 324). United Nations University Press.
- Blackmore, D., & Whittington, D. (2008). Opportunities for cooperative water resources development on the eastern Nile: Risks and rewards, An Independent Report of the Scoping Study Team to the Eastern Nile Council of Ministers [Unpublished paper].
- COWI Consulting Engineers and Planners AS, in association with DHI Water and Environment. (2002). Integrated water quality/limnology study for lake Victoria: Final report (Report to Lake Victoria Environmental Management Project).
- de Baulny, H. L., & Baker, D. (1970). The water balance of Lake Victoria. (Technical Note). Water Development Department.
- East African Community. (2006). Special report on the declining of water levels of lake Victoria, East African community Secretariat, Arusha, https://www.oieau.org/eaudoc/system/files/documents/41/208894/208894_doc.pdf
- East African Community. (2008). Consultancy on the development of a new Lake Victoria water release policy [unpublished draft]. Lake Victoria Basin Commission.
- East African Legislative Assembly. (2006). Water levels seminar, July. Unpublished report.
- Fekete, B. M., & Vörösmarty, C. J. (2007). The current status of global river discharge monitoring and potential new technologies complementing traditional discharge measurements. In D. Schertzer, P. Hubert, S. Koide, & K. Takeuchi (Eds.), Predictions in Ungauged Basins: Pub Kick Off (pp. 309 (pp.129–136). IAHS Publ.
- Gebremicael, T. G., Mohamed, Y. A., Betrie, G. D., van der Zaag, P., & Teferi, E. (2013). Trend analysis of runoff and sediment fluxes of in the Upper Blue Nile Basin: A combined analysis of statistical tests, physically-based models, and land use maps. Journal of Hydrology, 482, 57–68. https://doi.org/10.1016/j.jhydrol.2012.12.023
- Khaki, M., & Awange, J. (2021). The 2019–2020 Rise in Lake Victoria monitored from space: Exploiting the state-of-the-art GRACE-FO and the newly released ERA-5 reanalysis products. Sensors, 21(13), 4304. https://doi.org/10.3390/s21134304
- Kite, G. W. (1982). Analysis of Lake Victoria levels. Hydrological Sciences Bulletin, 27(2), 99–110. https://doi.org/10.1080/02626668209491093
- Kizza, M., Rodhe, A., Chong-Yu, X., Ntale, H. K., & Halldin, S. (2009). Temporal rainfall variability in the Lake Victoria basin in East Africa during the 20th century. Theoretical and Applied Climatology, 58(1–2), 119–135. https://doi.org/10.1007/s00704-008-0093-6
- Kull, D. (2006, February). Connections between recent water level drops in Lake Victoria, dam operations and drought International Rivers Network. with Addendum Lake Victoria Report. June 2006. International Rivers. http://www.internationalrivers.org/resources/addendum-lake-victoria-report-4118
- Lorenz, C., & Kunstmann, H. (2012). The hydrological cycle in three state-of-the-art reanalyses: Intercomparison and performance analysis. Journal of Hydrometeorology, 13(5), 1397–1420. https://doi.org/10.1175/JHM-D-11-088.1
- LVBC. (2007). Report of sub-committee on legal implications Task Force on New Lake Victoria Water Release Policy. Lake Victoria Basin Commission.
- LVBC. (2009). 7th Task Force Meeting Minutes 2009 – LVBC Information Resource Centre. Lake Victoria Basin Commission.
- LVBC. (2010). Annual report – July 2008–June 2009. Lake Victoria Basin Commission.
- LVBCS. (2012). The development of a new water release and abstraction policy for the lake Victoria basin (Final report – February 2012; 5 volumes. Prepared by the Centre for Ecology and Hydrology). Lake Victoria Basin Commission Secretariat.
- LVEMP. (2005, 1). Hydrology and meteorology of the basin report. Lake Victoria Environmental Management Project.
- Mubiru, P. (2006). Causes of the decline of Lake Victoria levels during 2004 to 2005, December 2006. A position paper by the commissioner for Energy Resources Department, Ministry of Energy and Mineral Development, Republic of Uganda. http://www.energyandminerals.go.ug/
- Okonga, J. R. (2010, September 5). Challenges of cooperation in water resources management – A case on development of a new water release and abstraction policy for Lake Victoria Basin [Paper presentation]. During a Seminar on Management of Transboundary water Resources. World Water Week, Stockholm.
- Piper, B. S., Plinston, D. T., & Sutcliffe, J. V. (1986). The water balance of Lake Victoria. Hydrological Sciences Journal, 31(1), 24–47. https://doi.org/10.1080/02626668609491025
- PPA. (2007). Bujagali II – Economic and Financial evaluation study – Final report, appendices. Power Planning Associates Ltd. http://tinyurl.com/38hyk7
- Sene, K. J., & Plinston, D. T. (1994). A review and update of the water balance of Lake Victoria in East Africa. Hydrological Sciences Journal, 39(1), 47–63. https://doi.org/10.1080/02626669409492719
- Sutcliffe, J. V., & Petersen, G. (2007). Lake Victoria: Derivation of a corrected natural water level series. Hydrological Sciences Journal, 52(6), 1316–1321. https://doi.org/10.1623/hysj.52.6.1316
- Swenson, S., & Wahr, J. (2009). Monitoring the water balance of Lake Victoria, East Africa, from space. Journal of Hydrology, 370(1–4), 163–176. https://doi.org/10.1016/j.jhydrol.2009.03.008
- Tate, E., Sutcliffe, J., Conway, D., & Farquharson, F. (2004). Water balance of Lake Victoria: Update to 2000 and climate change modelling to 2100. Hydrological Science Journal, 49(4), 563–574. https://doi.org/10.1623/hysj.49.4.563.54422
- Tickodri-Togboa, S. S. (2011). On the contribution of Victoria Nile river discharge to the hydrological performance of East Africa’s Lake Victoria. Paper presented at the Second International Conference on Advances in Engineering and Technology. https://www.mak.ac.ug/documents/Makfiles/aet2011/Tickodri-Togboa.pdf
- Vanderkelen, I., van Lipzig, N. P. M., & Thiery, W. (2018). Modelling the water balance of Lake Victoria (East Africa) – Part 1: Observational analysis. Hydrology and Earth System Sciences, 22(10), 5509–5525. https://doi.org/10.5194/hess-22-5509-2018
- WREM International. (2005, September). Study on Water Management of Lake Victoria. (Technical Report 10 – Climate Change Impact Assessment. For Uganda Ministry of Energy and Mineral Development). Water Resources and Energy Management International Inc.
- Yin, X., & Nicholson, S. E. (1998). The water balance of Lake Victoria. Hydrological Sciences Journal, 43(5), 789–811. https://doi.org/10.1080/02626669809492173
- Yin, X., & Nicholson, S. E. (2002). Interpreting annual rainfall from the levels of Lake Victoria. Journal of Hydrometeorology, 3(4), 406–416. https://doi.org/10.1175/1525-7541(2002)003<0406:IARFTL>2.0.CO;2