
 ?Mathematical formulae have been encoded as MathML and are displayed in this HTML version using MathJax in order to improve their display. Uncheck the box to turn MathJax off. This feature requires Javascript. Click on a formula to zoom.
ABSTRACT
The unexpected drop of the Blue Nile water in July 2020, attributed to the sudden closure of the Grand Ethiopian Renaissance Dam (GERD) during the first filling in 2020, significantly interrupted the water supply for Khartoum, Sudan. This incident pursued using satellites and hydrological models to estimate inflows into Roseires dam. A hydrological model was developed to predict GERD inflows, while reservoir levels were extracted from Sentinel-1, -2 and Jason-3. A water balance model was developed to predict GERD releases and the dates of overtopping during subsequent fillings events. The study demonstrates the effectiveness of satellite data and models for transboundary reservoir management.
Introduction
The Grand Ethiopian Renaissance Dam (GERD) has been under construction across the Blue Nile in Ethiopia since 2011. The dam is located 15 km upstream of the Sudan–Ethiopian border, and about 115 km upstream of Roseires dam in Sudan (). GERD started filling in 2020 and is expected to reach its full capacity of 74 BCM in the near future.
Figure 1. (a) Main features of the study area: major irrigation schemes, major cities (population > 200,000 people) and large dams; (b) affected water supply utilities in the capital Khartoum; and (c) distance between the Grand Ethiopian Renaissance Dam (GERD) and Roseires.
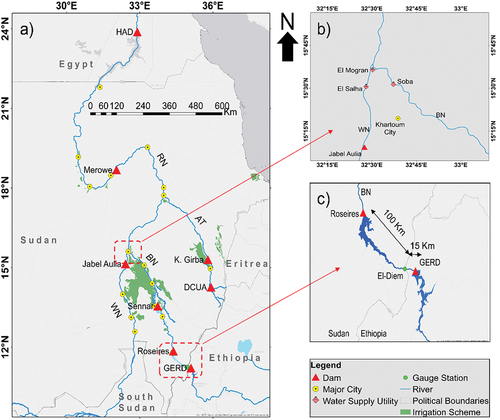
In July 2020 an incident occurred that triggered the analysis given in this paper. The water level of the Blue Nile River at Khartoum gauging station dropped suddenly by 0.8 m in only two days on 17–18 July 2020. A number of large drinking water supply utilities located around the capital Khartoum, including El Salha (30,000 m3/day), El Mogran (30,000 m3/day) and Soba (300,000 m3/day), failed to pump water from the river for about three to four days. This incident was reported widely in the news in Sudan (e.g., Asharq, Citation2020; SUNA, Citation2020). Although the water level at the site was still higher than the minimum operation level, it took a day or two for the operators to accommodate the sudden drop of the Blue Nile’s water level that occurred at a time when the hydrograph would typically be rising, namely during the flood season.
The measurements of the Blue Nile flow at El-Deim gauging station located on the Sudan–Ethiopia border revealed the reason to be a sudden closure of the GERD’s bottom culverts, leading to the flow suddenly decreasing from around 220 to 120 Mm3/day. Until the operators of the water utilities lowered the pump intakes to stabilize the operation, the drinking water supply for millions of people in the capital city Khartoum was interrupted. This event prompted the water managers in Sudan to get prepared and take remedial measures well in advance of the subsequent years of GERD filling in 2021 and 2022, in particular to modify the operating policy of Roseires dam on the Blue Nile, as well as Jebel Aulia dam on the White Nile (). Information to support these measures, in particular the operation of Roseires dam during GERD filling, were derived from satellite imageries and hydrological models.
The operation of large dams is data intensive and requires real-time data of inflow, reservoir level and gate openings not only to optimally satisfy downstream demands but also more importantly for the safety of the dam itself. Therefore, river flow gauging stations are installed upstream of reservoirs to monitor inflow. Hydrological models are also employed to increase lead time, or fill data gaps in the expected inflow (Joo et al., Citation2019). However, the accessibility of data for dam operation is hindered occasionally by a limited number of gauging stations, or by the lack of data-sharing protocols among riparian states in transboundary river basins (Gerlak et al., Citation2011; Thu & Wehn, Citation2016), which is the case in the Nile River Basin and its tributaries.
The literature shows increasing applications of remote sensing (RS) data and/or hydrological models to support dam operation in situations where there is limited (real-time) in-situ data. Inflow to reservoirs is computed by hydrological models driven by satellite rainfall datasets (Beck et al., Citation2017; Han et al., Citation2020). The performance of hydrological models driven by satellite rainfall datasets varies for different regions (topography, hydro-climate) and time scales (e.g., Abera et al., Citation2017; Gebremichael et al., Citation2014). Abera et al. (Citation2017) evaluated the JGrass-NewAge rainfall-runoff model results based on SM2R-CCI satellite rainfall data over the Blue Nile catchment (174,000 km2) at El-Deim station and showed very good results, with a Kling–Gupta efficiency (KGE) indicator of 0.92.
Information about water level, water surface area or water volume stored in upstream reservoirs is also important for proper water management. Measuring water levels and the extent of water bodies using satellites is increasingly common, and particularly important in situations of limited data exchange in a river basin. Muala et al. (Citation2014) used Landsat images to estimate the water levels of Roseires and High Aswan reservoirs, with root mean squared error (RMSE) varying from 0.62 to 0.92 m, and a coefficient of determination (R2) ranging from 0.81 to 0.96 against in-situ measurements. Basheer et al. (Citation2021b) estimated the water level of Tekezze 5 reservoir in Ethiopia using Landsat images for the period 2007–16 and obtained matching results to those reported in the literature. Duan and Bastiaanssen (Citation2013) used four satellite altimetry products to assess the water level of Lake Tana, with RMSE ranging from 10.5 to 16.2 cm, and R2 ranging from 0.95 to 0.97 when compared with in-situ measurements. Similarly, Pham et al. (Citation2022) successfully analysed water extent extracted from Sentinel-1 and -2 to monitor volume variation of Thac Mo Reservoir in Vietnam. Additionally, they used data from Jason-3 to monitor changes in water level. Their study found a strong correlation between delineated water extent (R2 = 0.98), extracted water level (R2 = 0.99, RMSE = 0.86 m) and in-situ measurements.
This paper describes a computational framework that was developed and applied to safeguard the operation of Roseires reservoir during the second and third years of GERD filling. Roseires dam, which is located just downstream of the GERD, is the main water controller of the Blue Nile system in Sudan and serves millions of people living on both sides of the river (). The innovation of this research is the integration of information from different sources (data and models) to forecast the expected release from a large dam located upstream in a neighbouring country, which is still under construction, in a context of no data-sharing between riparian states.
After describing the study area, we present the dataset and methodology. This consists first of a rainfall runoff meso-scale hydrological model (mHM), driven by forecasted rainfall data (CHIRPS-GEFS), to compute inflow into the GERD for the following two weeks. Satellite data of reservoir level and reservoir extent (optical and radar) were employed to estimate the level of the GERD reservoir. An estimation of the dam construction rate allowed predicting the expected maximum dam height during the next filling period. We present how this information is integrated into a water balance model, and how this allowed the computation of the expected outflow from GERD for two weeks into the future. The latter equals the inflow into Roseires reservoir. The results are updated daily making use of measured discharges at El-Deim gauging station. We conclude the article by describing how such a computation facilitates the management of reservoirs on international rivers.
While the paper presents the experience of Sudanese water managers to fill in the data gaps during GERD’s filling, which has been largely satisfactory, this is not equivalent to sharing in-situ measurements between the GERD and Roseires reservoirs, in particular with regard to data accuracy, lead time and the expected risks/benefits of the incoming flows.
Description of the study area
The Blue Nile river originates from the Ethiopian highlands flowing north-west to join the White Nile at Khartoum, to form the Main Nile River flowing downstream to Egypt, and finally to the Mediterranean Sea (). The Blue Nile provides 60% of the total Nile water measured at Aswan, and is characterized by high seasonal variation, with 80% of the water flowing during the four months from July to October (Sutcliffe & Parks, Citation1999). A number of dams have been built to regulate the river flow: Sennar dam (0.9 BCM) built in 1925; J. Aulia dam (3.5 BCM) built in 1937; K. Elgirba dam (1.3 BCM) built in 1964; Roseires dam (3 BCM) built in 1966, heightened (to 7.4 BCM) in 2011; High Aswan Dam (162 BCM) built in 1970; Merowe dam (12.4 BCM) built in 2009; Dam Complex of Upper Atbara DCUA (3.5 BCM) built in 2017; and recently the GERD (with an expected storage capacity of 74 BCM) under construction since 2011.
These dams are vital for the socio-economic well-being of the three riparian countries, Ethiopia, Sudan and Egypt. For example, Roseires dam is the backbone of water resources management of Sudan because it is located in the upstream part of the Nile system. It supplies irrigation water for the large irrigation schemes of Gezira (0.9 million ha), Rahad (0.12 million ha) and Suki (0.03 million ha), in addition to many medium-sized and small-scale irrigation schemes. The operation of Roseires dam is well connected to the remaining five dams in the country to ensure optimal water resources management to satisfy demands for irrigation, hydropower and drinking water across the Nile river system within Sudan. In fact, the major cities in Sudan, including Khartoum, are located along the Blue Nile, White Nile and Main Nile. The drinking water supply for these cities directly depends on the water availability along the Nile and its tributaries. As can be seen from , Roseires dam is located about 115 km downstream of the GERD, while the backwater curve of the reservoir when full is just 15 km downstream of the GERD. This makes safe operation of Roseires dam very much dependent on the operation of the GERD, and thus on the data exchange between the two dams.
The three countries of Sudan, Ethiopia and Egypt have been, and are still, negotiating on the filling and operation of the GERD since 2011 (Basheer et al., Citation2021a), but so far (October 2023) without a conclusive agreement. A major step forward was the Declaration of Principles (DOP), signed in 2015, in which the three countries agreed to embark on negotiations on the filling and operation procedure, while dam construction continued (DOP, Citation2015).
Data and methodology
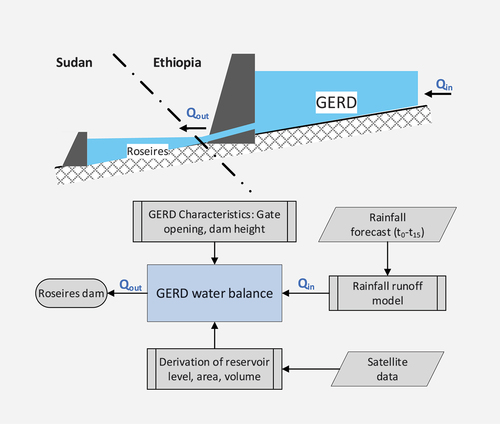
The overall goal of the approach given in this paper is to provide information for operating Roseires reservoir, in the absence of in-situ data on the water releases from GERD during initial filling in 2021 and 2022. Therefore, through water-balance computation, releases were estimated based on the forecasted inflow, reservoir level and characteristics of the GERD (dam height and gates openings), as represented by the analytical framework (). The inflow was computed by a hydrological model driven by forecasted rainfall for the following two weeks. The GERD reservoir level and dam height (middle section) were extracted from satellite data, both optical and altimetry. Further details are given in the methodology section below.
Figure 2. Analytical framework for computing river inflow into the Roseires reservoir.
Data
Four datasets were used in the analysis: (1) forecasted rainfall datasets to drive the hydrological model; (2) satellite datasets to estimate changes of GERD water level, as well as the height of the dam wall (middle section); (3) GERD characteristics to estimate gate opening, and the expected height of the dam wall; and (4) measured river flow at El-Deim gauging station, located immediately downstream of the GERD, as a verification point. This section describes the datasets used in the analysis.
Rainfall estimates
Due to the lack of access to real-time ground observations of rainfall in the catchment area of the GERD, which is entirely located in Ethiopia, the Climate Hazards Centre InfraRed Precipitation with Stations data (CHIRPS) version 2 re-analysis dataset was used in the analysis (Funk et al., Citation2015). The CHIRPS dataset was used to run the mHM hydrological model over the upper Blue Nile Basin. To predict the incoming flows, the set of forecasted data of CHIRPS-GEFS was then used to run the mHM model for the following 15 days. CHIRPS has been selected for this analysis because of its wide application in similar contexts and fine spatial (0.05°) and temporal (daily) resolutions. It extends from 1981 to date, and is freely available dataset. The CHIRPS dataset shows good agreement with the ground observations in different climatic zones worldwide (Dinku et al., Citation2018). Over the Mekong River basin, the CHIRPS-GEFS showed better performance, that is, smaller RMSE and higher probability of detection (POD), compared with the Integrated Multi-satellitE Retrievals for Global Precipitation Measurement (IMERG for GPM) dataset (Meechaiya et al., Citation2020). When comparing the model’s results derived from different satellite precipitation datasets over the neighbouring Tekezze–Atbara sub-basin, Gebremicael et al. (Citation2022) found that the best model results were achieved with CHIRPS compared with five other precipitation datasets: RFEv2, TMPA3B42v7, IMERGv6, MSWEPv2.8 and PERSIANN. Other studies in the same region also found a good performance for CHIRPS (Basheer & Elagib, Citation2019; Belete et al., Citation2020; Fenta et al., Citation2018).
The CHIRPS dataset was developed by the Climate Hazards Group of the University of California (Samaniego et al., Citation2011). It is a blended dataset that combines satellite measurements and in-situ rainfall measurements from the Global Telecommunication System (GTS). The CHIRPS dataset is a quasi-global rainfall dataset covering 50°S to 50°N (accessible at https://data.chc.ucsb.edu/products/CHIRPS-2.0/). The CHIRPS-GEFS is a bias-corrected and downscaled version of the National Centres for Environmental Prediction (NCEP) Global Ensemble Forecast System (GEFS) of precipitation, with a lead time of 15 days. It covers the same extent of CHIRPS dataset, and with similar spatial resolution and extent.
Satellite measurements of the reservoir area and level
To estimate water level variation of the GERD reservoir, a collection of satellite datasets was used. First, we derived the level–area–volume relationship of the GERD reservoir using the Alos-PalSAR DEM, which is a terrain corrected DEM, available with spatial resolution of 12.5 m. It is accessible freely from the Alaska Satellite Facility – Distributed Active Archive Centre at https://asf.alaska.edu/data-sets/sar-data-sets/alos-palsar/. Four scenes were used to cover the extent of the GERD reservoir from elevation 500 to 630 masl. The accuracy of the Alos-PalSAR DEM is discussed in the methodology section below.
Next, the dynamic areal extent of the GERD reservoir was delineated from Sentinel-1 and -2. The European Space Agency’s (ESA) Sentinel-1 data are radar imagery free of cloud interference. They have a spatial resolution of 10 m and swath of 250 km. The dataset is acquired from two polar-orbiting satellites, Sentinel-1A and -1B, with a global revisit time of 6–12 days (Torres et al., Citation2012). Sentinel-2 is a twin satellite constellation mission also by ESA, with a five-day revisit time. It comprises Sentinel-2A and Sentinel-2B, carrying a multispectral imaging instrument (MSI), which acquires optical images in 13 spectral bands. The spatial resolution of Sentinel-2 imagery is 10 m (Drusch et al., Citation2012). In total, 38 images of Sentinel-1 and 30 images of Sentinel-2 were downloaded and processed, covering a two-year period from December 2020 to December 2022. Additionally, reservoir water levels were obtained from the Jason-3 altimetry dataset.
The Jason-3 satellite mission was launched in 2016 to measure sea and reservoirs’ surface heights. It is a collaboration between NASA, NOAA, CNES (the French space agency) and the European Organization for the Exploitation of Meteorological Satellites (EUMETSAT; Biancamaria et al., Citation2018). In total, 28 data points were accessed from the US Department of Agriculture, Foreign Agricultural Service (https://ipad.fas.usda.gov/lakes/images/lake001296.10d.2.txt).
The main dataset used to delineate the GERD reservoir area in this study was Sentinel-2 images. However, the additional data of Sentinel-1 and Jason-3 were used when Sentinel-2 images were covered by clouds or for additional verifications. The used datasets are justified in the results section ‘Derivation of GERD reservoir level’ below.
The main characteristics of the GERD
To compute the water releases from GERD during initial filling, it is critical to know the size of the gate openings and elevation of the middle section of the dam wall. The latter acts as a very wide overflow weir in case the inflowing water – during the flood season – exceeds the combined capacity of the culverts, bottom outlets and lower turbines.
The GERD has a design reservoir capacity of 74 BCM and a lake area of 1874 km2 when full at a water level of 640 masl (Abtew & Dessu, Citation2019). The capacity of the GERD reservoir is about 1.5 times the mean annual flow of the Blue Nile river, and 10 times larger than the capacity of Roseires reservoir.
The GERD is composed of three main parts: (1) the main dam, which is a roller compacted concrete (RCC) gravity dam, built across the main course of the Blue Nile, with a length of 1780 m and height of 145 m; (2) the main gated spillway body on the left bank at elevation of 624.9 masl; and (3) the saddle dam which is a concrete face rock fill dam (CFRD), with a length of 5 km and 50 m high, including a 200 m ungated emergency spillway at 642 masl (Pietrangeli et al., Citation2020).
The main RCC dam is divided into three sections: right bank, middle and left bank ( and ). The right bank is equipped with two early generation units and five normal generation units, while the left bank is equipped with six normal generation units and two low level outlets at 542.25 masl (invert level). The left bank also has four temporary culverts at level elevation of 500 masl (invert level) used for river diversion during the early stages of construction (Basheer et al., Citation2020a).
Figure 3. Main characteristics of the GERD drawn from different sources given in .
Figure 4. Middle section during overtopping in 2020 and shortly before overtopping in 2021 showing the height of the middle section.
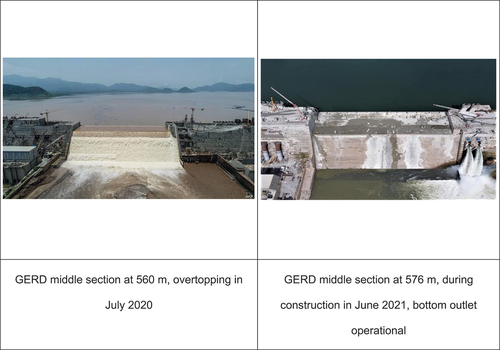
Table 1. GERD main characteristics.
Additional information of the GERD is given in , which was compiled from different sources, including Basheer et al. (Citation2020a), IPoE (Citation2013) and Pietrangeli et al. (Citation2017).
The GERD filling has been planned to be in stages following dam construction (Pietrangeli et al., Citation2017), the overtopping of the middle section being foreseen at three different levels: 515, 560 and 595 masl.
As most of the water in the initial years of filling passes over the middle section during the flood season, it is essential to predict the elevation of the middle section beforehand. Together with the gate characteristics, this is key information to compute the water balance for a given inflow.
The information on the GERD construction was needed to be able to establish the expected elevation of the middle section, and was extracted from various sources, including satellite images, newspapers, television channels and social media (Facebook, WhatsApp, Twitter). This information was crucial to predict and/or validate the construction rate diagram (). It is to be noted that advising the operation of Roseries dam in real time when no data exchanged with GERD has been an extensive exercise based on: tracing, collecting, screening, validating, assembling and hence using information from a wide spectrum of sources: technical reports; measurements of flow downstream of the GERD at El-Deim gauging station; hydrological model computing river inflows; reservoir level derived from three sets of satellite imageries; and photos, videos and news from different media types describing stage of construction and opening/closure of outlets (). Prior experience of dam construction management proved to be critical for interpreting information and convert it into useful (discrete) data to support water balance computation. shows the different media sources used during the filling period of 2021 and 2022.
Table 2. Examples of the media sources used to track the progress of the Grand Ethiopian Renaissance Dam (GERD) construction during filling of 2021 and 2022. Several other sources were also consulted.
Figure 5. Construction rate diagram of the GERD middle section height, as envisaged on 11 July 2021.
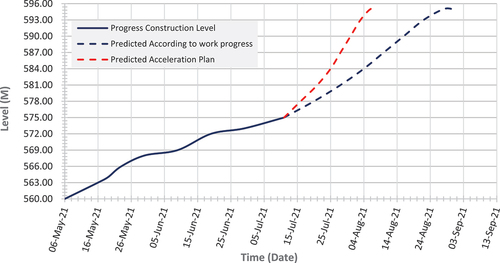
The construction rate estimated from the planned height of the middle section may not be strictly followed due to various reasons. This is typical in construction work (e.g., Konior & Szostak, Citation2020). Therefore, the construction rate was updated as frequently as possible, depending on the availability of information. Two different scenarios of the construction rate were composed: normal and accelerated. presents the ‘construction rate diagram’ of the GERD, as envisaged by the authors on 11 July 2021.
El-Deim discharges
El-Deim discharge gauging station was installed in 1964 to measure river inflow into Roseires reservoir. It is located on the Sudanese–Ethiopian border, 15 km downstream of the GERD (). The rating curve of the station proved to be very stable until the heightening of Roseires dam in 2012, when it experienced positive and negative shifts of the water level. However, Fameka, another station located 15 km downstream of El-Deim, has been used as a second check of flow measurements. Daily water level and discharges are measured at both El-Deim and Fameka, while hourly water levels are measured at the two stations during the flood season (July–September). The data from these stations proved crucial not only for calibration of the hydrological model before GERD construction but also as a key verification point for computation of GERD releases during the years of initial filling.
Methodology
This section describes the different components of the analytical framework given in ; specifically the hydrological modelling to estimate forecasted inflows into the GERD, the change of reservoir level derived from RS data and finally the GERD releases computed with the water balance.
Hydrological modelling
The literature shows various applications of hydrological models to compute runoff over the Blue Nile basin. Gebre (Citation2015) used the HEC-HMS model to compute runoff from five small catchments in the Upper Blue Nile basin, with the Nash–Sutcliffe efficiency (NSE) ranging from 0.50 to 0.77. A semi-distributed Soil & Water Assessment Tool (SWAT) model for the Upper Blue Nile was developed by Dessie et al. (Citation2014), giving an acceptable NSE of 0.83–0.89 for calibration and validation, respectively.
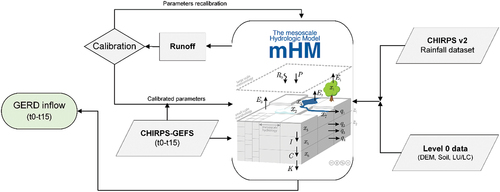
In this study, we have used a fully distributed, grid-based mHM to compute inflow into the GERD reservoir (Samaniego et al., Citation2011). The mHM model was selected because of previous experience of the team in both the Blue Nile and Tekezze–Atbara basins. It is an open-source conceptual model simulating rainfall-runoff process (). The model was set up using the global database () with a spatial resolution of 0.002°. Initial model parameters were obtained from spatially disaggregated ERA5 climate re-analysis data (Lorenz et al., Citation2019). To produce scale-invariant simulations across different scales, a multiscale parameter regionalization technique (MPR) was used, along with an adaptive time step for routing the generated runoff through a multiscale routing model (mRM) (Thober et al., Citation2019).
Table 3. Meso-scale hydrological model (mHM) global datasets used for the model (Lorenz et al., Citation2019).
Figure 6. Structure of the meso-scale hydrological model (mHM).
The mHM model’s parameters were calibrated for the Upper Blue Nile from 2002 to 2006 using a dynamically dimensioned search algorithm (DDS) (Tolson & Shoemaker, Citation2007), with 2500 optimizations’ iterations, and then validated from 2007 to 2011. Detailed model results are given in the Results and discussion section.
Derivation of the reservoir level
Water level changes of the GERD reservoir during the initial years of filling have been derived and validated from different data sources, as given by and explained in five steps below.
Figure 7. Flow chart of the processes of GERD’s water level derivation.
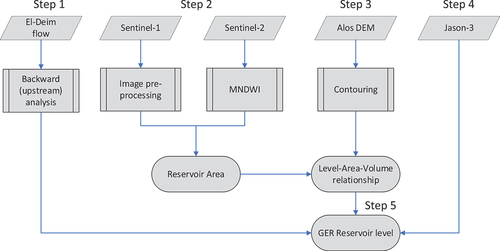
(1) The most reliable computation of the GERD reservoir level is applying the hydraulic equations of the water flow through the gate openings (orifice flow) and/or over the middle section of the dam wall (wide flat-crested weir). These backward (upstream) computations are based on the discharge measurements at El-Deim gauging station. The orifice equation is used for the flow through the culverts, bottom outlets and turbines. The computed reservoir level is labelled as the reference water level, which we assume to be the actual water level. The latter has been subsequently used to validate levels derived from satellite and altimetry data. The two bottom outlets started operation in April 2021, while the two lower turbines started operation on 20 February 2022 and 11 August 2022, respectively (AfricaNews, Citation2022; BBC, Citation2022). Before the middle section dam wall would be overtopped, we used the orifice equation to compute the reservoir level. Once the overtopping of the dam wall occurred during the flood season, the majority of the flow passes over the middle section, in addition to what is flowing through the bottom outlets and/or lower turbines.
The parameters of the orifice equation were derived from the data given in . The power equation for the hydro-turbine was used to compute the head difference, assuming a turbine efficiency of 0.75 to account for the condition during the commissioning of the turbines, which is lower than a turbine efficiency of 0.85 suggested by Abtew and Dessu (Citation2019). The reservoir level then equals the (computed) head difference plus the tail water level. The latter is obtained from the GERD’s tailwater table (Wheeler et al., Citation2016).
The flow over the middle section is assumed typical for a flow over a flat-crested weir, given by Equationequation (1)(1)
(1) :
where Qout = total flow downstream the GERD, measured at El-Deim; Qmid = flow over the middle section (flat-crested weir); Qbot = flow through bottom outlets; Qturb = flow through turbines; C = discharge coefficient, assumed to be 1.69, after Finlay (Citation2000); and L = 260 m, estimated from Google Earth (high resolution).
For the condition of water overflowing (overtopping) the middle section, the GERD reservoir level equals the height of the middle section (as constructed just before each flood season), plus the computed head over the weir.
(2) The areal extent of the water surface in the GERD reservoir has been delineated from Sentinel-1 using the modified normalized different water index (MNDWI) (Equationequation 3(3)
(3) ). The MNDWI enhances open water features while removing built-up land noise, as well as vegetation and soil noise (Xu, Citation2006). This technique has been used extensively to delineate boundaries of water bodies. For example, Hui et al. (Citation2008) used MNDWI to delineate areas of Poyang Lake using Landsat thematic mapper images. Yue and Liu (Citation2019) used the same index in addition to others to delineate open water bodies with different sizes in China.
where MNDWI = modified normalized difference water index; Green = reflectance of the green spectral band; and IR = reflectance of the shortwave infrared spectral band.
Computing MNDWI from Sentinel-1 required additional pre-processing with European Space Agency – Sentinel Application Platform (ESA SNAP) software. This includes speckle filtering, calibration and terrain correction (Filipponi, Citation2019). The threshold method applied here relies on the difference in radar return signals, with water bodies exhibiting low radar returns, while the surrounding terrain displaying higher radar returns. The derived threshold value is then used to delineate the water extent. The corresponding water level to the delineated area is extracted from level–area–volume relationship discussed in step 3 below.
(3) The level–area–volume relationship of the GERD reservoir was derived from four mosaicked scenes of Advanced Land Observing Satellite – Phased Array Type L-Band Synthetic Aperture Radar (ALOS PALSAR) DEM. The study conducted by Khal et al. (Citation2020) showed that the vertical accuracy of the ALOS PALSAR DEM is better than other freely available DEMs. The RMSE against actual height was found to be 1718, 1736 and 1958 mm, respectively, for ALOS PALSAR, SRTM and ASTER. Similarly, Correa-Muñoz et al. (Citation2019) showed better results of ALOS PALSAR compared with SRTM and ASTER DEMS. It is to be noted that the error is expected to be much smaller when calculating the change of storage volume.
First, the reservoir area was delineated for different contour elevations, from 500 to 630 masl, with increments of 5 m. The storage volume was then calculated as reservoir area times increment of contour elevation.
(4) Additional data for reservoir level were obtained directly from the Jason-3 satellite mission and used for additional verification, or filling in missing data.
(5) To enhance confidence for water level estimates, the water level derived from satellite and altimetry data given by steps 2 and 3 was verified against the reference level computed in step 1.
Finally, we prepared a set of GERD reservoir-level data based on the three different sources, as given above. This has been instrumental not only for verification but also to fill in data gaps, for example, during the time when there is no information on gate openings or between satellite overpasses.
The GERD water balance
Given the inflow into the GERD for the next two weeks – computed by the hydrological model, yielding the current reservoir level – derived from satellite data, and the most likely scenario of dam characteristics (height of middle section, opening of gates), it is possible to compute the GERD outflow from the water balance equation (Equationequation 4(4)
(4) ). It was assumed that the current gate openings prevailed for the next two weeks, unless new information became available.
where Qin and Qout = daily inflow and outflow to and from the GERD; dS/dt = daily change in reservoir storage; A = reservoir surface area; P = daily precipitation; and E = open water evaporation, for which we used average monthly values (K. G. Wheeler et al., Citation2016). While the literature shows debatable figures for seepage in the GERD, here we assume it to be negligible compared with the daily flow through the dam (Heggy et al., Citation2021; Wheeler et al., Citation2022).
Results and discussion
This section presents the results of the computations of GERD releases as a key input for the safe operation of Roseires reservoir. First, we show the results of the hydrological model producing forecasted inflow into the GERD, then water level variation in the GERD reservoir obtained from satellite data, and finally the GERD releases as the residue of the water balance equation.
Inflow to the GERD reservoir
Using historical precipitation datasets of CHIRPS, and measured discharges at El-Deim station, the mHM model for the upper Blue Nile was calibrated and validated for the periods 2002–06 and 2007–11, respectively. The results show very good performance for both calibration and validation periods, as given in and . = observed flow at El-Deim;
= average observed flow;
= simulated flow from the mHM model;
= average simulated flow; σx = standard deviation in observations; σy = standard deviation in simulations; r = linear correlation between y and x; and
= number of observations.
Table 4. Statistical indices for the performance of the meso-scale hydrological model (mHM) model.
Figure 8. Observed and simulated daily discharges at El–Deim station computed by the meso-scale hydrological model (mHM) derived by CHIRPS dataset: (a) calibration and (b) validation.
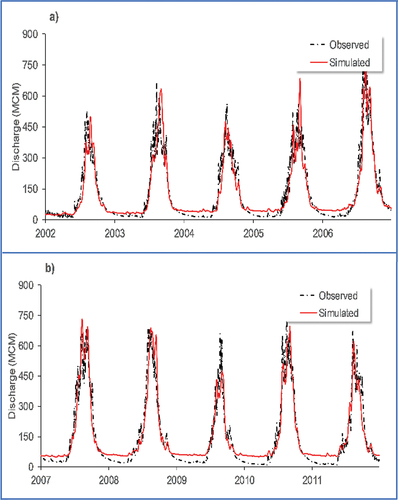
While the model could capture high flows, it consistently overestimated low flows. This is attributed to the calibration objective function, being NSE, giving a larger weight to fitting high flows compared with low flows.
Derivation of the GERD reservoir level
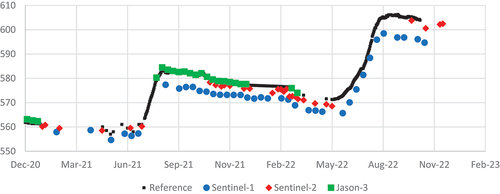
The surface area of the GERD reservoir was delineated using MNDWI for Sentinel-2 and a threshold-based classification for Sentinel-1 imageries, as described in the methodology section above. Using the level–volume–area relationship of , the corresponding water level was derived from the corresponding surface area for the processed images of both Sentinel-1 and -2. Surprisingly, there is a shift of about 3.7 m between reservoir levels derived from the two datasets of Sentinel-1 and -2, while the altimetry measurement of Jason-3 is closer to the reference level (actual), see . The RMSE against the reference water level is 5.79, 1.95 and 0.93 m, respectively, for Sentinel-1, -2 and altimetry (Jason-3). It is to be noted that the uncertainty of water surface delineation is influenced by a number of factors: sensor characteristics, measurement methods and image processing techniques. Radar backscatter can also be affected by surface roughness, in particular in shallow water depths mixed with vegetation, frequency and polarization, which is sometimes challenging to accurately delineate water from other land cover surfaces (Gstaiger et al., Citation2012).
Figure 9. GERD level–area–volume relationship derived from DEM.
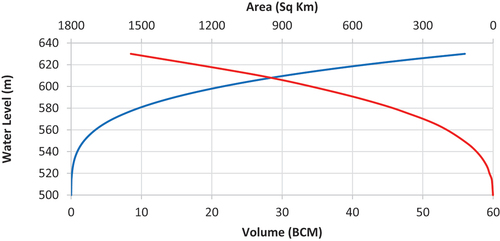
Figure 10. GERD reservoir level: reference level (actual); Sentinel-1, -2 and Jason-3 (altimetry).
Furthermore, the correlation of the derived reservoir level from the three sources against the reference water level data has been assessed, as given in .
Figure 11. Correlation of the derived reference (actual) water level against Sentinel-1, -2 and Jason-3 (altimetry). The determination coefficient R2 and T-test values for statistical significance at a 95% level are shown (critical value = 2.0).
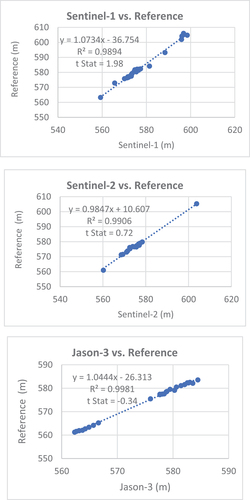
Based on the regression equations of , the corrected time series of the derived water level monitored by Sentinel-1, -2 and Jason-3 was computed (). Accordingly, the RMSE were much smaller compared with the situation before correction and found to be 1.12, 0.74 and 0.37 m, respectively, for Sentinel-1, -2 and Jason-3.
Figure 12. Derived water level from Sentinel-1, -2 and Jason-3 compared with the reference (actual), after correction.
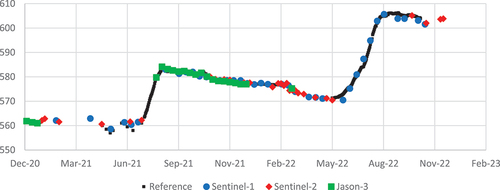
To facilitate tracking of the GERD reservoir level, we have mostly used the data from Sentinel-2 because it is closest to the reference level compared with Sentinel-1, and more complete compared with the Jason-3 dataset. However, in occasions when there were missing data from Sentinel-2, or for an ambiguous result, we used images from both Sentinel-1 and Jason-3 (altimetry). It is to be noted that Sentinel-2 with high optical resolution is better for the delineation of clear water surfaces, while the advantage of Sentinel-1 is that it is available for all weather conditions.
The time-series data derived from satellite and altimetry of proved to be crucial to trace the water level variability on the GERD reservoir, and hence computation of releases, in particular for the occasions when no information was available about the operation of the bottom outlets, or of the two lower turbines.
Computation of the GERD water balance
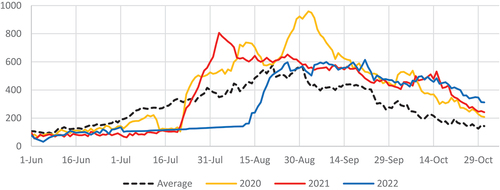
From the forecasted precipitation data, the mHM model computes the inflow into the GERD for the following two weeks. Combining this information with the condition of the gate opening (number and size of gates opening), and the (expected) maximum level of the middle section of the dam wall, as well as the initial water level in the reservoir, it is possible to compute the expected change of reservoir level and releases for the following two weeks. This is based on the assumption that gate openings remain constant. However, this approach is valid only for the conditions before overtopping of the middle section. The timing of overtopping the middle section is crucial information for the operation of Roseires and the downstream riverine inhabitants, as the releases from the GERD will suddenly increase from the about 100 Mm3/day to 600 Mm3/day or more, in a matter of days, as shown by for the three events in 2020, 2021 and 2022. While the average Blue Nile flood hydrograph shows a relatively slow rise during the flood season, the overtopping event brings large volumes of water in a very short period of time (less than two weeks), which may have serious implications for the safety of Roseires dam, and the livelihoods of local residents, if not accurately predicted, and safely managed.
Figure 13. Measured GERD releases before, during and after the overtopping in 2020, 2021 and 2022 compared with the long-term average at El-Deim (Mm3/day).
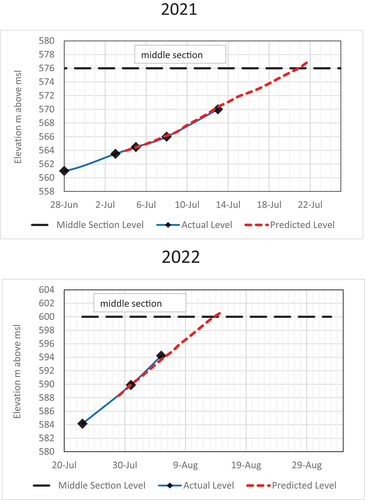
Predicting the time of overtopping the middle section is therefore one of the most important outputs from this analysis. The dam construction rate diagram in predicts the expected elevation of the middle section in the coming two weeks, which was 576 m in 2021. The expected middle section in 2022 is 600 m. Based on the forecasted inflow for the coming two weeks, with the GERD water balance equations it was possible to compute both the change of reservoir level, as well as the flow through the dam openings. Subsequently it was then possible to predict the expected date of overtopping, namely when the reservoir level would reach the elevation of the middle section, as given by for the events of 2021 and 2022.
Figure 14. Predicted date of overtopping the middle section issued on 13 July 2021 (top) and 5 August 2022 (bottom).
The prediction depends, of course, on the accuracy of the CHIRPS-GEFS precipitation forecast, as well on the initial water level of the reservoir. Therefore, the hydrological forecast had to be updated on a weekly basis, in May and June, but on daily basis in July and August. Accordingly, the reservoir water balance model was updated on daily basis as well.
shows the intersection of the predicted construction rate, with the expected height of the middle section, before the flood season. As can be seen, the exercise was successful to predict a week in advance the date of overtopping, with a small error of ±1 to 2 days. The actual dates of overtopping were 20 July 2021 and 13 August 2022, respectively. Of course, the accuracy of prediction decreases with increases of lead time, that is, it was possible to envisaged the date of over topping with more than a week lead time, but with an uncertainty of more than ±1 to 2 days.
Conclusions
This paper presents the experience of predicting releases from the GERD in 2021 and 2022 for the situation of no data exchange between the GERD and Roseires dam, which is located only 115 km downstream. The sudden drop of the Blue Nile water level in July 2020, due to the sudden closure of the GERD diversion culverts, caused serious interruption of the drinking water supply in Khartoum for a couple of days. This incident prompted the need for water resources planners in Sudan to rely on public domain datasets to get prepared for the GERD fillings in subsequent years.
A hydrological model (mHM) driven by forecasted rainfall (CHIRPS-GEFS) was developed to successfully predict the inflow into the GERD for the next two weeks. Reservoir water levels were derived using three sources of data: (1) the measured discharge at El-Deim station downstream the GERD – together with gate openings, it was possible to compute the head difference – and hence reservoir elevation, using the hydraulic equation of the gates; (2) the GERD reservoir area was extracted from Sentinel-1 and -2 imageries, and converted to elevations based on a level–area–volume relation built from ALOS PALSAR DEM; and (3) direct altimetric measurements from Jason-3 over the GERD reservoir. These three data sources allowed critical verification to ensure fairly accurate estimates of reservoir levels, as well as the filling in of data gaps.
The construction rate diagram provided key information to predict the date of the water flow overtopping the middle section of the GERD. The diagram was constructed based on a variety of information sources, including satellite imageries, scientific literature, technical reports, and even texts and photos from different types of news channels, including social media.
This paper has shown that given the predicted river inflows, and the initial level of GERD reservoir, it was possible, through a simple water balance, to compute the change of water levels in the reservoir, as well as reservoir releases. Of high importance proved to be the prediction of the date of overtopping, as then the river flow would increase sharply from about 100Mm3/day to 500–600 Mm3/day in a few days. The events of overtopping in 2021 and 2022 were predicted sufficiently accurately a week in advance.
The experience of using data and information from various sources together with hydrological and hydraulic models – in the case of no data exchange between riparian states, allowed the safe operation of Roseires reservoir during the second and third years of filling, in 2021 and 2022, respectively, and to avoid unexpected river flow changes for downstream water supplies. The integrated approach of data – from various sources, together with hydrologic and hydraulic models – is applicable to other river basins with no or limited in-situ measurements. While the paper presents a successful exercise to minimize negative implications of operating Roseires during second and third years of filling, it cannot be equivalent to sharing measured data among the two reservoirs of GERD and Roseires, specifically with regard to accuracy of information, length of the lead time and expected risks/benefits of the incoming flows.
Disclosure statement
No potential conflict of interest was reported by the authors.
References
- Abera, W., Formetta, G., Brocca, L., & Rigon, R. (2017). Modeling the water budget of the Upper Blue Nile basin using the JGrass-NewAge model system and satellite data. Hydrology and Earth System Sciences, 21(6), 3145–3165. https://doi.org/10.5194/hess-21-3145-2017
- Abtew, W., & Dessu, S. B. (2019). The Grand Ethiopian Renaissance Dam on the Blue Nile (1st ed.). Springer. https://doi.org/10.1007/978-3-319-97094-3
- AfricaNews. (2022). Ethiopia announces that second turbine in GERD is in operation.
- Asharq. (2020). Sudan: Sudden decline of Nile water leads to 5 water stations out of service.
- Basheer, M., & Elagib, N. A. (2019). Performance of satellite-based and GPCC 7.0 rainfall products in an extremely data-scarce country in the Nile Basin. Atmospheric Research, 215, 128–140. https://doi.org/10.1016/j.atmosres.2018.08.028
- Basheer, M., Nechifor, V., Calzadilla, A., Siddig, K., Etichia, M., Whittington, D., Hulme, D., & Harou, J. J. (2021a). Collaborative management of the Grand Ethiopian Renaissance Dam increases economic benefits and resilience. Nature Communications, 12(1), 5622. https://doi.org/10.1038/s41467-021-25877-w
- Basheer, M., Sulieman, R., & Ribbe, L. (2021b). Exploring management approaches for water and energy in the data-scarce Tekeze–Atbara Basin under hydrologic uncertainty. International Journal of Water Resources Development, 37(2), 182–207. https://doi.org/10.1080/07900627.2019.1591941
- Basheer, M., Wheeler, K. G., Elagib, N. A., Etichia, M., Zagona, E. A., Abdo, G. M., & Harou, J. J. (2020a). Filling Africa’s largest hydropower dam should consider engineering realities comment. One Earth, 3(3), 277–281. https://doi.org/10.1016/j.oneear.2020.08.015
- BBC. (2022). Ethiopia starts generating power from River Nile dam. BBC News.
- Beck, H. E., Vergopolan, N., Pan, M., Levizzani, V., van Dijk, A. I. J. M., Weedon, G. P., Brocca, L., Pappenberger, F., Huffman, G. J., & Wood, E. F. (2017). Global-scale evaluation of 22 precipitation datasets using gauge observations and hydrological modeling. Hydrology and Earth System Sciences, 21(12), 6201–6217. https://doi.org/10.5194/hess-21-6201-2017
- Belete, M., Deng, J. S., Wang, K., Zhou, M. M., Zhu, E. Y., Shifaw, E., & Bayissa, Y. (2020). Evaluation of satellite rainfall products for modeling water yield over the source region of Blue Nile Basin. Science of the Total Environment, 708, 134834. https://doi.org/10.1016/j.scitotenv.2019.134834
- Biancamaria, S., Schaedele, T., Blumstein, D., Frappart, F., Boy, F., Desjonqueres, J. D., … Nino, F. (2018). Validation of Jason-3 tracking modes over French rivers. Remote Sensing of Environment, 209, 77–89. https://doi.org/10.1016/j.rse.2018.02.037
- Correa-Muñoz, N. A., Murillo-Feo, C. A., & Martínez-Martínez, L. J. (2019). The potential of PALSAR RTC elevation data for landform semi-automatic detection and landslide susceptibility modeling. European Journal of Remote Sensing, 52, 148–159. https://doi.org/10.1080/22797254.2018.1552087
- Dessie, M., Verhoest, N. E. C., Pauwels, V. R. N., Admasu, T., Poesen, J., Adgo, E., Deckers, J., & Nyssen, J. (2014). Analyzing runoff processes through conceptual hydrological modeling in the Upper Blue Nile Basin, Ethiopia. Hydrology and Earth System Sciences, 18(12), 5149–5167. https://doi.org/10.5194/hess-18-5149-2014
- Dinku, T., Funk, C., Peterson, P., Maidment, R., Tadesse, T., Gadain, H., & Ceccato, P. (2018). Validation of the CHIRPS satellite rainfall estimates over Eastern Africa. Quarterly Journal of the Royal Meteorological Society, 144(S1), 292–312. https://doi.org/10.1002/qj.3244
- DOP. (2015). Agreement on declaration of principles between the Arab Republic of Egypt, the Federal Democratic Republic of Ethiopia, and the Republic of the Sudan on the Grand Ethiopian Renaissance Dam Project. https://www.ethiopianembassy.be/wp-content/uploads/Newsletter-29.pdf
- Drusch, M., Del Bello, U., Carlier, S., Colin, O., Fernandez, V., Gascon, F., Hoersch, B., Isola, C., Laberinti, P., Martimort, P., Meygret, A., Spoto, F., Sy, O., Marchese, F., & Bargellini, P. (2012). Sentinel-2: ESA’s optical high-resolution mission for GMES operational services. Remote Sensing of Environment, 120, 25–36. https://doi.org/10.1016/j.rse.2011.11.026
- Duan, Z., & Bastiaanssen, W. G. M. (2013). Estimating water volume variations in lakes and reservoirs from four operational satellite altimetry databases and satellite imagery data. Remote Sensing of Environment, 134, 403–416. https://doi.org/10.1016/j.rse.2013.03.010
- Fenta, A. A., Yasuda, H., Shimizu, K., Ibaraki, Y., Haregeweyn, N., Kawai, T., Belay, A. S., Sultan, D., & Ebabu, K. (2018). Evaluation of satellite rainfall estimates over the Lake Tana basin at the source region of the Blue Nile River. Atmospheric Research, 212, 43–53. https://doi.org/10.1016/j.atmosres.2018.05.009
- Filipponi, F. (2019). Sentinel-1 GRD preprocessing workflow [Paper presentation]. Third International electronic conference on remote sensing. MDPI. https://doi.org/10.3390/ECRS-3-06201
- Finlay, S. (2000). Software for the hydraulic design of underground stormwater detention tanks. Journal of Water Management Modeling. https://doi.org/10.14796/JWMM.R206-13
- Funk, C., Peterson, P., Landsfeld, M., Pedreros, D., Verdin, J., Shukla, S., Husak, G., Rowland, J., Harrison, L., Hoell, A., & Michaelsen, J. (2015). The climate hazards infrared precipitation with stations – A new environmental record for monitoring extremes. Scientific Data, 2(1), 150066. https://doi.org/10.1038/sdata.2015.66
- Gebre, S. L. (2015). Application of the HEC-HMS model for runoff simulation of Upper Blue Nile River Basin. Journal of Waste Water Treatment and Analysis, 6(2), 1–8. https://doi.org/10.4172/2157-7587.1000199
- Gebremicael, T. G., Deitch, M. J., Gancel, H. N., Croteau, A. C., Haile, G. G., Beyene, A. N., & Kumar, L. (2022). Satellite-based rainfall estimates evaluation using a parsimonious hydrological model in the complex climate and topography of the Nile River Catchments. Atmospheric Research, 266, 105939. https://doi.org/10.1016/j.atmosres.2021.105939
- Gebremichael, M., Bitew, M. M., Hirpa, F. A., & Tesfay, G. N. (2014). Accuracy of satellite rainfall estimates in the Blue Nile Basin: Lowland plain versus highland mountain. Water Resources Research, 50(11), 8775–8790. https://doi.org/10.1002/2013WR014500
- Gerlak, A. K., Lautze, J., & Giordano, M. (2011). Water resources data and information exchange in transboundary water treaties. International Environmental Agreements – Politics Law and Economics, 11(2), 179–199. https://doi.org/10.1007/s10784-010-9144-4
- Gstaiger, V., Huth, J., Gebhardt, S., Wehrmann, T., & Kuenzer, C. (2012). Multi-sensoral and automated derivation of inundated areas using TerraSAR-X and ENVISAT ASAR data. International Journal of Remote Sensing, 33(22), 7291–7304. https://doi.org/10.1080/01431161.2012.700421
- Han, Z. Y., Long, D., Huang, Q., Li, X. D., Zhao, F. Y., & Wang, J. H. (2020). Improving reservoir outflow estimation for ungauged basins using satellite observations and a hydrological model. Water Resources Research, 56(9), e2020WR027590. https://doi.org/10.1029/2020WR027590
- Heggy, E., Sharkawy, Z., & Abotalib, A. Z. (2021). Egypt’s water budget deficit and suggested mitigation policies for the Grand Ethiopian Renaissance Dam filling scenarios. Environmental Research Letters, 16(7), 074022. https://doi.org/10.1088/1748-9326/ac0ac9
- Hui, F. M., Xu, B., Huang, H. B., Yu, Q., & Gong, P. (2008). Modelling spatial–temporal change of Poyang Lake using multitemporal Landsat imagery. International Journal of Remote Sensing, 29(20), 5767–5784. https://doi.org/10.1080/01431160802060912
- IPoE. (2013). International panel of experts on the Grand Ethiopian Renaissance Dam Project Final Report.
- Joo, H., Lee, J., Jun, H., Kim, K., Hong, S., Kim, J., & Kim, H. S. (2019). Optimal stream gauge network design using entropy theory and importance of stream gauge stations. Entropy, 21(10), 991. https://doi.org/10.3390/e21100991
- Khal, M., Algouti, A., Algouti, A., Akdim, N., Stankevich, S. A., & Menenti, M. (2020). Evaluation of open digital elevation models: Estimation of topographic indices relevant to erosion risk in the Wadi M’Goun watershed, Morocco. Aims Geosciences, 6(2), 231–257. https://doi.org/10.3934/geosci.2020014
- Konior, J., & Szostak, M. (2020). The S-curve as a tool for planning and controlling of construction process-case study. Applied Sciences – Basel, 10(6), 2071. https://doi.org/10.3390/app10062071
- Lorenz, C., Portele, T., Shrestha, P., Hassan, M. A., Osman, M., Samaniego, L., Laux, P., & Kunstmann, H. (2019). Regionalized global and seasonal information for the transboundary water management: Examples from the Tekeze–Atbara and Blue Nile basins [Paper presentation]. Tekeze–Atbara basin conference on water related studies at: Khartoum, Sudan, Khartoum, Sudan.
- Meechaiya, C., Laverde, M., Son, L. H., Sothea, K., Haag, A., Kwant, M., Ate, P., Markert, A., Shukla, S., & Landsfeld, M. F. (2020). Towards more accurate riverine flood forecasting over the Lower Mekong basin: Assessment of the rainfall forecast CHIRPS-GEFS for the Mekong River commission [Paper presentation] (pp. GC045-13). AGU Virtual fall meeting abstracts. https://agu.confex.com/agu/fm20/meetingapp.cgi/
- Muala, E., Mohamed, Y. A., Duan, Z., & van der Zaag, P. (2014). Estimation of reservoir discharges from Lake Nasser and Roseires reservoir in the Nile Basin using satellite altimetry and imagery data. Remote Sensing, 6(8), 7522–7545. https://doi.org/10.3390/rs6087522
- Pham, B., Frappart, F., Quan, T., Tong Si, S., Phan, H., Nguyen, S., Le, A. P., & Viet, B. (2022). Monitoring lake volume variation from space using satellite observations—A case study in Thac Mo Reservoir (Vietnam). Remote Sensing, 14(16), 4023. https://doi.org/10.3390/rs14164023
- Pietrangeli, G., Bezzi, A., Rossini, C., & Masciotta, A. (2017). Design of Grand Ethiopian Renaissance RCC main dam [Paper presentation]. Conference: Africa 2017, Marrakech, Marocco.
- Pietrangeli, G., Pittalis, G., Simonelli, G., & Zaffaroni, P. (2020). Rockfill Saddle Dam at GERDP and design of peripheral joint system.
- Samaniego, L., Kumar, R., & Jackisch, C. (2011). Predictions in a data-sparse region using a regionalized grid-based hydrologic model driven by remotely sensed data. Hydrology Research, 42(5), 338–355. https://doi.org/10.2166/nh.2011.156
- SUNA. (2020). Khartoum water authority: Sudden decline of the White and Blue Nile leads to shutdown of water supply stations. Sudan News Agency.
- Sutcliffe, J. V., & Parks, Y. P. (1999). The hydrology of the Nile (Vol. 5). International Association of Hydrological Sciences Wallingford.
- Thober, S., Cuntz, M., Kelbling, M., Kumar, R., Mai, J., & Samaniego, L. (2019). The multiscale routing model mRM v1.0: Simple river routing at resolutions from 1 to 50 km. Geoscientific Model Development, 12(6), 2501–2521. https://doi.org/10.5194/gmd-12-2501-2019
- Thu, H. N., & Wehn, U. (2016). Data sharing in international transboundary contexts: The Vietnamese perspective on data sharing in the Lower Mekong Basin. Journal of Hydrology, 536, 351–364. https://doi.org/10.1016/j.jhydrol.2016.02.035
- Tolson, B. A., & Shoemaker, C. A. (2007). Dynamically dimensioned search algorithm for computationally efficient watershed model calibration. Water Resources Research, 43(1), W01413. https://doi.org/10.1029/2005WR004723
- Torres, R., Snoeij, P., Geudtner, D., Bibby, D., Davidson, M., Attema, E., Potin, P., Rommen, B., Floury, N., Brown, M., Traver, I. N., Deghaye, P., Duesmann, B., Rosich, B., Miranda, N., Bruno, C., L’Abbate, M., Croci, R., Pietropaolo, A., & Rostan, F. (2012). GMES Sentinel-1 mission. Remote Sensing of Environment, 120, 9–24. https://doi.org/10.1016/j.rse.2011.05.028
- Wheeler, K., Jeuland, M., Strzepek, K., Hall, J., Zagona, E., Abdo, G., Basson, T., Blackmore, D., Block, P., & Whittington, D. (2022). Comment on ‘Egypt’s water budget deficit and suggested mitigation policies for the Grand Ethiopian Renaissance Dam filling scenarios’. Environmental Research Letters, 17(8), 088003. https://doi.org/10.1088/1748-9326/ac7e5e
- Wheeler, K. G., Basheer, M., Mekonnen, Z. T., Eltoum, S. O., Mersha, A., Abdo, G. M., Zagona, E. A., Hall, J. W., & Dadson, S. J. (2016). Cooperative filling approaches for the Grand Ethiopian Renaissance Dam. Water International, 41(4), 611–634. https://doi.org/10.1080/02508060.2016.1177698
- Xu, H. Q. (2006). Modification of normalised difference water index (NDWI) to enhance open water features in remotely sensed imagery. International Journal of Remote Sensing, 27(14), 3025–3033. https://doi.org/10.1080/01431160600589179
- Yue, H., & Liu, Y. (2019). Method for delineating open water bodies based on the deeply clear waterbody delineation index. Journal of Applied Remote Sensing, 13(3), 038504–038504. https://doi.org/10.1117/1.JRS.13.038504