
ABSTRACT
Overconsumption of meat produces a large share of emissions and contributes, therefore, to climate change. Consumption of food related to tourism is conditioned by what food service establishments offer and spatially determined by the limited area of a particular destination. The aim of this case study is, first, to investigate the city-wide spatial distribution of common restaurants and vegan and vegetarian restaurants (which in general contribute to sustainable food consumption), with reference to popular tourist attractions. Second, the research focuses on quantity of meatless dishes and the way they are presented on menus in order to investigate whether food service establishments nudge customers to select meat-based dishes. For the first objective, quadrat and network analyses were used to explore the spatial location of the investigated types of restaurants. For the second one, a comprehensive examination of menus of 21 restaurants at the Old Town Square, which is the most overcrowded place in Prague, was conducted. The findings suggest that vegan and vegetarian restaurants are not exposed to the tourist market as their distribution is rather dispersed, beyond the borders of the UNESCO area. Furthermore, the researched restaurants offered primarily meat-based dishes and also nudge their customers to select them.
Introduction
Food is not only an essential part of everyday life, but also of the tourism experience. Gastronomy, according to the UNWTO (Citation2017), is a strategic element in the promotion of any destination; the lure of culinary delights increases the likelihood of a (repeated) visit to a country (see also Dixit, Citation2020; Dixit & Mawroh, Citation2019; Henderson, Citation2009; Karim & Chi, Citation2010; Kivela & Crotts, Citation2005; López-Guzmán & Sánchez-Cañizares, Citation2012; Mohamed et al., Citation2020; Privitera et al., Citation2018; Richards, Citation2002). World Food Travel Association (Citation2021) defines food tourism as ‘the act of traveling for a taste of place in order to get a sense of place’. Therefore, a single visit to a restaurant cannot be considered as a food or gastronomy tourism. It is rather the need for food that is the primary factor influencing travel behaviour and decision-making of tourists (Hall & Sharples, Citation2003).
The contact of tourists with gastronomy is triangular. Food may be either peak touristic experience, supporting consumer experience or daily routine experience (Quan & Wang, Citation2004). Similarly, motivational factors of tourists towards food differ significantly (Mak et al., Citation2012). In Czech context, supporting consumer experience is likely. Although gastronomy was incorporated into marketing campaign of CzechTourism (Citation2010), an official state tourism agency, it is the primary motive for visiting Czechia for only 2% of visitors. Gastronomy is, however, one of the activities that 26% of visitors do (CzechTourism, Citation2020a). Even though food experience is very important for a large group of tourists, this paper considers all the three perspectives mentioned by Quan and Wang (Citation2004) since the consumption of food occurs whether it is a peak or a daily routine experience.
Tourists can enjoy a wide range of diverse gastronomic experiences in the form of local food markets, cooking classes or food festivals (Dixit, Citation2019). In 2010, tourists consumed 39.4 Mt (million tonnes) of food, 10.9 Mt more than they would have consumed at home. This could rise to 82.0 Mt by 2050 (Gössling & Peeters, Citation2015). By comparison, in 2010 the United Nation’s World Food Program distributed 4.6 Mt of food aid (WFP, Citation2011). Naturally, such consumption contributes significantly to climate change. According to Poore and Nemecek (Citation2018) and IPCC (Citation2014), entire food supply chain produces 24–26% of the world’s greenhouse gas emissions (GHG). The main contributor is livestock (Reisinger & Clark, Citation2017; Steinfeld et al., Citation2006). Aside from GHGs, the livestock sector, that occupies 83% of the world’s farmland (Poore & Nemecek, Citation2018), contributes to other environmental problems related to deteriorating soil quality, e.g. terrestrial acidification and eutrophication (Steinfeld et al., Citation2006), use of scarce water resources, and biodiversity loss (Smith et al., Citation2013). Meat (especially beef, lamb and mutton) have a significantly higher negative impact on the environment when compared with vegetable products (Alexander et al., Citation2016; Opio et al., Citation2013; Poore & Nemecek, Citation2018; Steinfeld et al., Citation2006; Yue et al., Citation2017).
Vegan and vegetarian restaurants (hereafter vegetarian restaurants) can contribute to the creation of sustainable food systems (Enthoven & Brouwer, Citation2019; Niederle & Schubert, Citation2020). The spatial distribution of sustainable, i.e. non-meat, dishes offered by food service establishments in close vicinity of the most popular tourist attractions has not been investigated at the urban level in recent literature. The aim of this study is, first, to explore the spatial access of vegetarian restaurants to the Prague’s most popular and most visited tourist attractions as compared to common restaurants, and, second, to analyse the menus of common restaurants to see whether they offer a sufficient number of meatless dishes and whether these dishes are appropriately presented to be frequently selected by customers. In other words, the aim of this research is not to investigate the exact ecological footprint of gastronomy offered in the vicinity of famous tourist attractions, where the overconsumption of natural resources occurs primarily, but rather to investigate potential causes of tourists’ unsustainable consumption. The investigation is especially relevant for flexitarian and reducetarian (hereafter only flexitarian) tourists who attempt to reduce the amount of meat consumed (Salehi et al., Citation2020) since a poor access to sustainable gastronomy in tourist places can result in their higher meat, less sustainable, food practice. Nevertheless, tourists following any type of a diet from Beardsworth and Keil (Citation1991) dietary continuum are considered. This research adopted the following three research questions:
To what extent are vegetarian restaurants located in the vicinity of the most popular and visited tourist attractions in comparison to common restaurants?
What dishes (meat-based vs. meatless) are offered in the menus of food service establishments in the direct vicinity of the most popular and visited tourist attractions?
How are meatless dishes presented in common restaurants?
In accordance with the previous findings that the most effective way to reduce environmental footprint from one’s diet is to avoid meat-based dishes (Alexander et al., Citation2016; Bellarby et al., Citation2012; González-García et al., Citation2020; Poore & Nemecek, Citation2018; Reisch et al., Citation2013; Stehfest et al., Citation2009), this research is focused on the distinction between meat-based (and further also on offered meat variations) and meatless dishes and does not deal with beverages. Also, geographical origin of foodstuffs is ignored due to an extensive number of factors that affect the carbon footprint of transport. Specifically, the carbon footprint of food imported from a local farmer nearby by a small van may be higher compared to a long-distance purchase imported by a truck (Gössling et al., Citation2011). Furthermore, transport makes on average a relatively minor contribution to overall food chain emissions (Garnett, Citation2011).
Literature review
Tourists’ consumption behaviour
Tourists behave in a different way compared to their everyday life. On average, tourists consume an extra 0.5 kg food per person per day and the absolute amount of consumed food can reach 3.1 kg per person per day including the generated food waste (Gössling, Citation2015; Gössling & Peeters, Citation2015; Juvan et al., Citation2018). The amount of unconsumed food is 1.7 times higher among tourists compared to households (Li et al., Citation2019; Silvennoinen et al., Citation2012; Wang et al., Citation2018), approximately by 58 grams per person per dish. Furthermore, the total amount of food waste is increasing: from 135 grams per person per dish in 2013, to 144 grams per person per dish in 2015 (Wang et al., Citation2018). According to a study conducted in Tibetan Lhasa, tourist food consumption averages 945 grams per person per dish, which is approximately twice that consumed by residents (Li et al., Citation2018). Tourists also spend more money on food. More specifically, they consume a higher amount of unhealthy food, meat, dairy and seafood products and, on the contrary, less vegetables and fruits (Li et al., Citation2019; Wang et al., Citation2020).
Geographical location is a crucial aspect of food service establishments practice (Lee et al., Citation2019). The urban destination is a limited area with a limited number of food service establishments. Tourists mostly rely on the dishes offered in such establishments, which makes food service establishments key actors in the destination’s environmental sustainability (Gössling et al., Citation2011). The limited area is conditioned by the highly uneven spatiotemporal patterns of tourist behaviour and associated localization of food service establishments. Tourists tend to stay in the destination’s centre that may include iconic sights, shopping areas and places of historical significance (Ashworth & Page, Citation2011; Domenech et al., Citation2020; Hayllar & Griffin, Citation2009; Khan et al., Citation2020), especially in the close vicinity of their hotel (Lin et al., Citation2009; Shoval et al., Citation2011) without a significant dispersion out of the most popular area (Zee et al., Citation2020; Zee & Bertocchi, Citation2018). Even though this has been affected by Airbnb (Ki & Lee, Citation2019), the highest concentration of Airbnb listings still prevails in the vicinity of the most popular attractions (Boros et al., Citation2018; Gutiérrez et al., Citation2017; Roelofsen, Citation2018). The significant concentration in the destination’s centre is primarily observed during the day. In the evening, tourists return to their accommodation, which is, however, also located in the vicinity of the destination’s historical centre (Salas-Olmedo et al., Citation2018). Therefore, it can be argued that consumption of natural resources in food service establishments occurs primarily nearby main tourist sights.
The limited dispersion of tourists is also observed in Prague. Specifically, tourists concentrate at the Old Town Square and they further walk along the so-called Royal Way (Kádár, Citation2013). Prague’s historical centre is due to its small area overcrowded and congested and, therefore, also identified as a tourist ghetto (Dumbrovská, Citation2016). Tourists’ tendency to stay close to Prague’s most popular sights is further described in a research focused on Couchsurfers (Lochman, Citation2019), who are usually referred to as backpackers (Schuckert et al., Citation2018) or as alterative tourists (Molz, Citation2013), not interested in popular tourist attractions (Chen, Citation2018).
Tourists’ spatial patterns are affected by the length of their stay and number of previous visits (Shoval & Raveh, Citation2004). Since the length of stay of tourists is continuously decreasing, from 5.4 days in 1995 to 4.6 in 2015 (Gössling et al., Citation2018), their spatial dispersion is becoming more limited, as tourists are not able to visit the whole city (Mazanec, Citation1997). Furthermore, tourists walk and usually stop for more than three minutes primarily on commercial streets. On the contrary, residential areas are just pass through zones where longer stops are marginal (Yun et al., Citation2018). The procedure by which tourists search for a restaurant is spatio-temporally determined too, since people tend to search for food nearby (Xuan et al., Citation2018). A high concentration of tourists causes – aside from problems such as congestion and displacement of residents – overexploitation of natural resources (Peeters et al., Citation2018), which includes the food and water primarily offered in the food service establishments.
Tourists opt for fine dining more frequently than when they are at home (Wang et al., Citation2020). To cater to their needs, food service establishments cluster around the central area where the most popular attractions are located (Zee et al., Citation2020). Their location affects the food service establishments’ popularity. According to Zhai et al. (Citation2015), the most popular food service establishments of Chinese city Hangzhou are located within the old urban district and the popularity gradually decreases towards new urban districts. Those located in the immediate vicinity of major tourist attractions are spatially advantaged, because they are exposed to flocks of tourists yearning to eat. If these establishments offer food produced in an environmentally unsustainable way, significant environmental damage can occur.
Consumers’ food preferences and decision making are influenced by the restaurant’s menu design (Wansink & Love, Citation2014). The selection of meatless dishes can be enhanced by its better visibility and the chef’s recommendation placed at the top of the menu (Bacon & Krpan, Citation2018; Kurz, Citation2018). On the contrary, creation of a separate section influences consumers’ choices negatively as meat-eaters tend to overlook such sections (Bacon & Krpan, Citation2018). According to Peters and Remaud (Citation2020), another important aspect of food choice is an appropriate combination of ingredients. It can be argued, therefore, that insufficient number of meatless dishes may cause that consumers select rather meat-based dishes – especially the so-called flexitarians, who do not avoid meat completely but rather reduce the overall amount of meat they consume (Dagevos & Voordouw, Citation2013). Preference for environmentally more sustainable dishes can be further enhanced by raising consumers’ awareness of the environmental impact of the dishes on the menu (Apostolidis & McLeay, Citation2016; Filimonau & Krivcova, Citation2017; Gössling et al., Citation2011).
Environmental impact of foodstuffs
The environmental impact of any given dish varies depending on its composition. The biggest issue is the consumption of meat and specifically beef, whether conventional or organic (Pieper et al., Citation2020). Poore and Nemecek (Citation2018) estimate that the production of 1 kg of bovine meat (beef herd) requires an average of 362 m2 land (median value of the authors’ sample amounts to 170 m2). Approximately the same impact on land use is observed in lamb and mutton production, which need an average of 370 m2 of land per kg meat (median is 127 m2). Beef, lamb and mutton production also contribute a large share of GHG emissions: the mean GHG emissions of 1 kg of beef amounts to 100 kg CO2eq and for lamb and mutton, 40 kg CO2eq respectively (medians amount to 60 kg CO2eq and 41 kg CO2eq). The environmental impact of cattle further implies the environmental impact of cheese – the median values of required land use and GHG emissions are slightly higher compared to pork. In comparison, the most environmentally challenging plant food among the primary vegetarian foods are pulses which require an average of 16 m2 per 1 kg production (median value amounts to 12 m2). In the case of GHG emissions, the most challenging primary plant food is rice with an average value of 4 kg CO2eq (the same value for median) per kg produced. However, the environmental issues of meat consumption are more extensive. The livestock sector is a key player in land degradation, excessive use of water and its pollution by antibiotics, hormones and fertilizers and pesticides used for feed crops (Gössling et al., Citation2011; Steinfeld et al., Citation2006).
Alongside the development of technological solutions to climate change, it is necessary to shift dietary patterns towards plant-based diets to mitigate the GHG emissions bound up in the food system (Garnett, Citation2011). A plant-based diet is the most effective way to reduce the environmental impact of one’s food consumption (Alexander et al., Citation2016; Bellarby et al., Citation2012; Poore & Nemecek, Citation2018; Reisch et al., Citation2013; Stehfest et al., Citation2009). According to a study by Alexander et al. (Citation2016), if the world adopted the dietary pattern of the USA, 178% more land would need to come under agriculture. By contrast, if the world were to adopt the dietary pattern of India, only 45% of the world current area under agriculture would be needed. The overconsumption of meat and milk products is the primary factor causing such an extreme difference in dietary patterns (Alexander et al., Citation2016; Godfray et al., Citation2010; Poore & Nemecek, Citation2018). The exclusion of animal products from diets would reduce food production’s land use by 76%, GHG emissions by 49%, water acidification by 50%, water eutrophication by 49% and scarcity-weighted freshwater withdrawals by 19% (Poore & Nemecek, Citation2018). Similar findings were presented in a study by Hallström et al. (Citation2015), who argue that dietary changes in favour of sustainable food could reduce GHG emissions and land use requirements associated with the current diet by 50%. Specifically, adopting a vegan diet could reduce current GHG emissions by up to 55% and land use by up to 60%; a vegetarian diet could decrease GHG emissions by up to 35% and land use by up to 50%. According to Stehfest et al. (Citation2009), when the transition to less meat or even a complete switch to plant-based diet would be globally adopted, up to 2700 Mha (million hectares) of pasture (i.e. 80%) and 100 Mha of cropland (i.e. 6%) could be abandoned, resulting in a large carbon uptake from regrowing vegetation. The environmental benefits of meatless diet were, however, described in a number of other studies (Friel et al., Citation2009; Machovina et al., Citation2015; Quam et al., Citation2017; Tilman & Clark, Citation2014).
Food service establishments play an undeniable role in the environmental sustainability of a destination, so a focus on the food offered at tourist locations is necessary for the development of environmentally sustainable tourism. The environmental impact of food consumed by tourists is investigated by Li et al. (Citation2020) in a case study of Tibetan Lhasa. The authors found that arable land requirements increased by 7828 hectares between 2013 and 2015, including 899 hectares due to the dietary pattern effect associated with a higher demand for animal-based foodstuffs. In total, of the 22,209 hectares of arable land required for tourists, the animal-based foodstuffs required 18,618 hectares (84%). Enthoven and Brouwer (Citation2020) focus on the spatial distribution of sustainable restaurants at the national level, identifying the largest clusters of sustainable restaurants. However, the relationship between sustainable restaurants and tourist locations in the urban environment remains unexplored. This research gap highlights the uniqueness and significance of this research. Additionally, given the fact that the protection of public health is a principal tenet of city planning (Nixon & Doud, Citation2011), our insights can be of importance to policy makers seeking to promote appropriate measures.
Materials and methods
Prague, the capital city of Czechia, was chosen for this case study. The case study is intrinsic since it seeks to describe a specific phenomenon because of its uniqueness and to examine the case to a higher extent (Hendl, Citation2005; Yin, Citation2003). A combination of qualitative and quantitative methods was adopted in order to develop a comprehensive and representative understanding (Babbie, Citation2013; Crowe et al., Citation2011; Sayer, Citation2000) of the spatial distribution of sustainable gastronomy.
Case study: Prague
Prague is located in central Czechia, has a population of 1.3 million (Eurydice, Citation2019) and covers 496 km2 (Osborne et al., Citation2020). Tourism is primarily concentrated in the historic centre that is included in the UNESCO World Heritage List (UNESCO, Citationn.d.). The most visited attractions in 2019 include Prague Castle with 2.6 million visitors, the Petřín Funicular with 2.2 million visitors and Prague Zoo with 1.5 million visitors (CzechTourism, Citation2020b). The most congested place is the Royal Way (Kádár, Citation2013), which is less than 3 km long hosting the most popular and remarkable Prague sights such as the Prague Castle, the Old Town Square with its medieval astronomical clocks and Charles Bridge (Dumbrovská & Fialová, Citation2020). In general, tourists tend to stay in the destination’s centre without significant dispersion out of the Prague’s UNESCO area (Kádár, Citation2013; Lochman, Citation2019).
Prague is frequently associated with overtourism, both in the literature (Capocchi et al., Citation2019; Dodds & Butler, Citation2019; Garcia-Hernández et al., Citation2019; Pinke-Sziva et al., Citation2019; Szromek et al., Citation2020) and the media (Tait, Citation2019; Tait, Citation2020). According to the Czech Statistical Office (CSO, Citation2020), 8.0 million tourists were accommodated in Prague in 2019, out of which 6.8 million were foreigners. The total of nights spent in Prague was 18.5 million (16.4 million by foreigners). Between the years 2012 and 2019, the total number of tourists increased by 2.3 million (i.e. an increase of 41%). In 2019, the biggest share of foreign tourists came from neighbouring Germany (13%), USA (8%), United Kingdom (6%) and Russia (6%). The number of bed-nights increased as well, specifically by 4.0 million (i.e. an increase of 28%). In no month in 2019 did the number of bed-nights fall below one million (CSO, Citation2020).
Since 2012, the length of stay decreased from 2.52 to 2.30 days in 2019 (CSO, Citation2020), which positions Prague exactly two times below the world average (Gössling et al., Citation2018) and makes it primarily a transiting destination. This implies an insufficient dispersion of tourists around the city (Mazanec, Citation1997). Except for domestic tourists, tourists from China and South Korea spend the least nights in Prague, 1.78 and 1.70 nights respectively (CSO, Citation2020). The same group of tourists also belongs to the biggest spenders as they spend approximately €54 per person per day. However, the most money on average is spent by German tourists (€69). On the contrary, the group with the lowest expenses is Ukrainian tourists (€30). Foreign tourists spend approximately 9% of their expenditures on food, while domestic tourists spend 20% (CzechTourism, Citation2019).
Finally, gastronomy is an important part of the Czech tourism promotion (CzechTourism, Citation2010; CzechTourism, Citation2021). About a quarter of tourists stated that gastronomy was one of the activities they engaged in during their stay (CzechTourism, Citation2020a).
Quantitative investigation
The first analysis is exclusively focused on the city-wide distribution of vegetarian restaurants and common restaurants with reference to the most popular tourist attractions. The data was collected in August 2020.
Data collection
The locations of vegetarian restaurants were obtained from the HappyCow (Citationn.d.) world veggie map. Only the vegan and vegetarian restaurants from the map were chosen for the analysis because the other option, restaurants with veg-options, offered a marginal share of sustainable dishes – their menu could be identical to that of common restaurants. In total, 109 vegetarian restaurants were included in the investigation.
Second, the layer containing the coordinates of common restaurants were obtained from the Open Street Map database (Open Street Map, Citation2020). The restaurant and pub categories, which usually offer main dishes, were extracted. The identified vegetarian restaurants were removed from the layer. A total of 2597 common restaurants were included in the investigation.
Third, a layer of tourist attractions was created through desk research. The content of 10 popular promotional websites was investigated, with toponyms extracted and included in the database of attractions. Part of the database is also a count of mentions in the websites, which were used as weights in the quadrat analysis. CzechTourism (Citation2020b) data that includes the total number of visitors to individual Prague attractions were also considered. However, the data do not include visitors to public spaces such as the Charles Bridge. Therefore, the CzechTourism data were only used for the relevance assessment of the developed database and as a complementary data source. The final database comprises 116 attractions (and their weights, i.e. count of mentions): 72 sights from promotional websites and another 44 sights from the CzechTourism data.
Quantitative methods
Three quantitative methods were applied. First, general spatial distribution was determined by the measures of centrality and variability: specifically, geographic mean, that measures the average location, and standard deviational ellipse, that determines to what extent the specific variables are concentrated around the geographic mean, and whether they exhibit a directional trend (Scott & Janikas, Citation2009).
Second, the quadrat analysis was applied. The method has some disadvantages – loss of information from original data because of the sizes of quadrats that influences the obtained results (Borruso, Citation2008). Due to the potential influence of different quadrat sizes on the results, Prague was divided into three grids. The first grid consists of 2161 quadrats with a side length of 500 m, the second consists of 3332 quadrats with a side length of 400 m, and the third consists of 5821 quadrats with a side length of 300 m. Smaller quadrats would not contain enough vegetarian restaurants and tourist attractions to develop representative outputs. Subsequently, in each individual quadrat the number of vegetarian restaurants and common restaurants was counted. In the case of tourism attractions, the weights were counted. The extent of spatial clustering was statistically investigated with the Getis-Ord General G analysis (Mueller-Warrant et al., Citation2008). Finally, a correlation analysis was applied to the quadrats to examine to what extent the locations of both examined types of restaurants are related to the spatial distribution of tourism attractions.
Third, spatial network analysis was conducted in order to measure the exact distances from the tourism attractions to the individual vegetarian restaurants and common restaurants. The spatial network is represented by the pedestrian routes obtained from the Geoportal Prague (Citation2020). All the procedures were developed in the ESRI (Citation2019) software.
Further statistical techniques that model spatially varying relationships were considered. However, the quadrats containing vegetarian restaurants and tourism attractions are in a significant minority, which is not suitable for statistical tests (e.g. Arcgis, Citationn.d.). In conclusion, it can be stated that the spatial network analysis is the most detailed procedure to identify the proximity of restaurants to tourist attractions.
Qualitative investigation
Qualitative investigation was carried out in order to confirm the findings of the quantitative investigation, e.g. because the HappyCow and the Open Street Map data may not contain all the restaurants. Moreover, the aim of the qualitative analysis is to investigate menu compositions and the way in which meatless dishes are presented in order to examine to what extent menus of the food service establishments in the immediate vicinity of the most popular tourist attractions condition the consumption of meat-based (or, for that matter, plant-based) dishes.
In the first part, the attention was paid to the share of meatless dishes in menus for the reason of identification of vegetarian restaurants and also because the lack of meatless variations can result in the selection of meat-based dishes (Peters & Remaud, Citation2020; Rivera & Shani, Citation2013). On the basis of relevant literature, the following aspects of menus were examined in the second part of the qualitative investigation:
the recommendation or highlighting of meatless dishes,
a separate section for meatless dishes,
the position of the section with meatless dishes or the position of individual meatless dishes when there is no such section on the menu,
the presentation of environmental impacts of offered dishes.
The Old Town Square and the adjacent part of the Royal Way, where congestion usually begins to appear, were selected as the site for the qualitative research. The selection of the Old Town Square is due to its central position, located between Wenceslas Square, Charles Bridge, Republic Square and the popular Jewish Ghetto (CzechTourism, Citation2020b). Moreover, the Royal Way passes through the square and famous attractions such as the medieval astronomical clocks and the Old Town Hall are located there. During December the square hosts its famous Christmas markets, visited by approximately 700 thousand tourists (Lidovky, Citation2019).
In total, 21 restaurants were investigated in February 2021. The primary aim was to include all the establishments located in the Old Town Square. However, only 21 of them have a publicly available menu. The COVID-19 pandemic affected the investigation: several establishments were closed or went bankrupt due to the lockdowns. Thus, determining the percentage of restaurants in the Old Town Square and the adjacent part of Royal Way area that are included in the sample is difficult.
Results
Quantitative investigation
Exploratory analysis
Exploratory analysis did not generate any relevant findings. The geographic means showed that the average coordinates of vegetarian restaurants and common restaurants are almost the same (see ). The geographic means of both are located on the very edge of Prague’s UNESCO area, whereas tourist attractions are located more to the centre of the UNESCO area, specifically between the Charles Bridge and the Old Town Square.
Figure 1. Exploratory analysis outputs.
Note: CRs refers to common restaurants and VVRs refers to vegan and vegetarian restaurants.
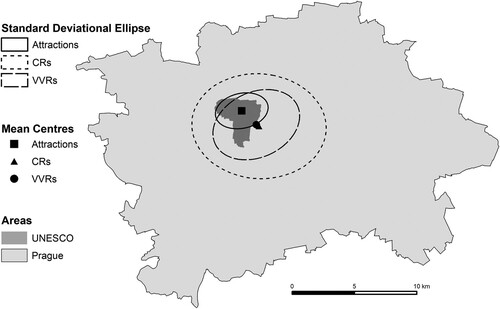
However, the common restaurants are more concentrated in the UNESCO area: 813 out of 2607 (31%) restaurants are located there. The share of vegetarian restaurants in the UNESCO area is exactly one quarter (25%). Moreover, within the UNESCO area (which covers 8.3 km2) the density of vegetarian restaurants is 3.3 per km2 whereas that of common restaurants is nine times higher (29.8 per km2).
The standard deviational ellipses showed that the spatial distribution of vegetarian restaurants exhibits a directional trend from the south west to the north east of the east edge of the UNESCO area. The common restaurants’ spatial distribution is concentrated in a more concentric shape and covers the entire UNESCO area.
Quadrat analysis
A higher spatial concentration of common restaurants can be observed from the developed quadrats (see ). In the case of common restaurants, almost all the quadrats with the highest concentration are located in Prague’s UNESCO area. Otherwise, the quadrats with the highest concentration of vegetarian restaurants are visually more dispersed. This conclusion was further confirmed with the spatial autocorrelation of Getis-Ord General G analysis, conducted on the quadrats of side length 500 m. This proved (at the 95% level of significance) that the quadrats with a higher quantity of both types of restaurants are clustering (see ). However, the z-scores illustrate that the common restaurants’ spatial clustering is significantly higher, since the z-score value is more than twofold compared to the vegetarian restaurants.
Figure 2. Quadrat analysis outputs.
Note: CRs refers to common restaurants and VVRs refers to vegan and vegetarian restaurants.
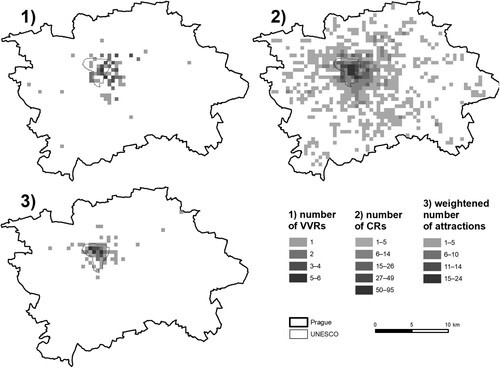
Table 1. Getis-ord Gi, high-low clustering report.
The correlation analysis showed a higher spatial dependency among the tourist attractions and common restaurants. Pearson correlation coefficient of the relation amounts to 0.62 in the case of 500 m quadrats, which indicates moderately strong correlation. This value is the highest among the conducted correlation analyses (see ). However, the R squared value – that represents the proportion of the variance for a dependent variable that's explained by an independent variable – amounts to only 38%. The low R squared value could be a result of a small number of tourist attractions compared to a high number of common restaurants. Nevertheless, the dependency between the vegetarian restaurants and tourist attractions amounts to a maximum of 0.29 in the case of 500 m quadrats with an R squared value of 9%. The value of both the Pearson correlation coefficient and the R squared value gradually decreases in accordance with the decreasing size of quadrats. The milder decrease of values of both indicators indicates higher spatial proximity of common restaurants.
Table 2. Correlation statistics in selected quadrats.
Therefore, in general, it is concluded that the vegetarian restaurants are not concentrated towards Prague’s historical city centre to the extent of the common restaurants. The vegetarian restaurants are more dispersed with a less significant clustering. The dispersion includes the distribution of vegetarian restaurants in a residential area of Prague, i.e. the city district of Vinohrady, which lies on the eastern border of the UNESCO area. The dispersion is not city-wide – there is a lack of vegetarian restaurants in the housing estates in the city periphery. However, the R squared value for all grids is relatively low and thus it is necessary to further examine the proximity of both types of restaurants to tourist attractions.
Network analysis
A spatial network analysis was conducted in order to observe the exact distances of the investigated vegetarian and common restaurants from Prague’s most popular tourist attractions. In general, the average distance from tourist attractions to each common restaurant is higher by 1153 m compared to the vegetarian establishments (). The higher average spatial vicinity confirms that vegetarian restaurants are almost non-existent on the city periphery.
Table 3. Results of the spatial network analysis – distances from tourist attractions to the nearest vegan and vegetarian restaurants (VVRs) and common restaurants (CRs).
Other developed indicators, however, suggest the spatial disadvantage of vegetarian restaurants. In the case of the average distance from tourist attractions, the difference is more than fourfold in favour of common restaurants. Specifically, the average distance from each tourist attraction to its nearest vegetarian and common restaurant is 612 m and 150 m respectively. The difference is even higher, 4.9 times, when the median values are considered. The median distance to the fifth nearest common restaurants is approximately two times lower compared to the median distance to the nearest vegetarian restaurants. Furthermore, significantly lower distances to common restaurants could be observed on the interquartile range, since the nearest vegetarian restaurants’ lower quartile value is higher by 69 m compared to the nearest common restaurants’ upper quartile value. In addition, the common restaurants’ lower quartile amounts to 31 m, which is 3 m less than the minimum distance from a tourist attraction to a vegetarian restaurant.
It is difficult to determine the tourist attraction with the best access to vegetarian restaurants. The tourist attraction with the lowest average distance of 2816 m is the National Museum located on the eastern edge of Prague’s UNESCO area. The minimum distance value of 34 m is linked to the Lucerna Palace. The Head of Franz Kafka has the lowest average distance, 355 m, when considering the fifth nearest vegetarian restaurant, which is comparable with the distance to the 100th nearest common restaurant from the medieval astronomical clocks at the Old Town Square.
Among the main tourist attractions, i.e. Prague Castle, Petřín Tower, the medieval astronomical clocks and Charles Bridge, the presence of common and vegetarian restaurants is below average in the case of Prague Castle and Petřín Tower. This is associated with their location – Prague Castle primarily consists of St. Vitus Cathedral and the presidential residence which implies a lack of capacity for tourist services. Similarly, the Petřín Tower is located at the centre of an extensive park. The Charles Bridge has shorter distances compared to the overall average distance between all vegetarian restaurants and tourist attractions, whereas the medieval astronomic clocks have the best access to vegetarian restaurants among Prague’s key sights: the distance of the fifth nearest one amounts to 530 m, which is still 10.2 times more compared to its fifth nearest common restaurant.
Qualitative analysis
The quantitative study determined that vegetarian restaurants have a significantly lower access to the tourist market compared to common restaurants. However, the quantitative analysis faces several issues that could lower the relevance of its findings. First, the HappyCow and the Open Street Map data could be incomplete. Second, the menus of certain common restaurants could contain enough meatless dishes to be considered environmentally sustainable. Third, the qualitative investigation suppresses the lower number of vegetarian restaurants in the city.
Presence of vegetarian restaurants and menu composition of common restaurants
An analysis of 21 menus found that none of the sampled restaurants is vegan or vegetarian. The nearest vegetarian restaurant is located exactly 157 m from the medieval astronomic clocks in Melantrichova Street connecting the Old Town Square and Wenceslas Square. There are only three more within a distance of 500 m; located out of the view of the crowds of tourists.
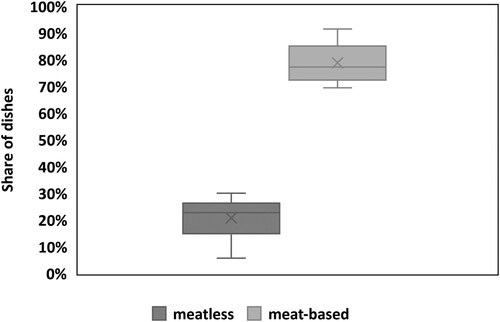
The 21 investigated restaurants offer a total of 524 main dishes (excluding starters, soups, tapas and focaccias), of which 415 (79%) contained meat and 106 (20%) were identified as meatless. The remaining three could not be identified. All of the restaurants offer at least two meatless options.
The share of meatless dishes in the menu varies between 6% and 30% – the maximum share of meatless dishes is 39 percentage points less than the minimum share of meat-based dishes (see ). In absolute numbers, the highest number of meatless dishes is 10. On average, 5.0 meatless main dishes are offered by restaurants at the Old Town Square. The median value is slightly lower (4.0). On the contrary, 19.8 (median is 20.0) meat-based dishes are offered on average in the same establishments.
Figure 3. Meatless and meat-based dishes in menus of common restaurants.
Typically, the vegetarian dishes offered are cheese-based (65%), cheese having a higher environmental impact than pork or poultry. It can be stated, therefore, that due to the lack of dishes variations the environmental impact of vegetarians can be in some cases higher compared to carnivores.
To examine the sustainability of the restaurants’ menus, using type of meat as a proxy, the variations of the meat on offer were determined. The most common type of meat is pork (27% of dishes). On average, 6.62 main dishes per menu contain pork, which is higher by 1.62 compared to the average number of meatless dishes (see ). It needs to be noted that pork is the most common meat primarily due to the fact that it is frequently added as a supplement – e.g. bacon in a hamburger. The second most common meat to be found on menus is beef. The values for beef are similar to those of pork. Lamb and mutton, which have comparable environmental impacts to beef, are offered on average only on almost every third menu. The share of meatless dishes in menus is comparable with the share of dishes based on poultry.
Table 4. Variations of dishes in menus.
The structure of menus
Out of 106 meatless dishes, only one was highlighted on the menus (contained goat cheese). In seven menus, solely meat-based dishes were highlighted. The most frequently recommended dishes contained beef – 19 out of 39 recommended dishes. The second most recommended dishes contained pork (13 dishes).
A lower level of sustainability was also revealed in terms of sectionalization. Exactly nine menus presented meatless dishes in a separate section. In other four, meatless dishes were marked with a specific symbol or they were called vegetarian or meatless, which can be considered the same as sectionalization. Meatless dishes were presented among meat-based ones on eight menus (38%).
When meatless dishes were classified in their own section, they were mostly placed at the bottom of the menu. From out of nine menus that contained a meatless section, in only two the section was placed at the top of the menu. Among the twelve menus without a meatless section, including four menus in which dishes were marked as meatless, the position of the dishes on the menu was mostly random. Meatless dishes were situated at the bottom on three menus and only in one they were situated at the top.
None of the researched restaurants presented information on the ecologic footprint, or any other indicator showing the environmental impacts, of the offered dishes.
Discussion and conclusion
The significant spatial concentration of food service establishments observed in Prague’s historical centre corresponds with previous literature focused on spatial distribution patterns in urban environments (Zee & Bertocchi, Citation2015). Vegetarian restaurants are concentrated towards the centre and also to the residential area located on the eastern border of UNESCO area. On the contrary, the vegetarian restaurants do not occur in the peripheral housing estates. This phenomenon may be a result of the different socio-economic structure of housing estate populations (Temelová et al., Citation2010) and vegetarian populations (Alles et al., Citation2017; Cramer et al., Citation2017; Hargreaves et al., Citation2020).
Regarding the first research question, vegetarian restaurants are found to be spatially disadvantaged with no direct access to the tourism market. The nearest vegetarian restaurant to any tourist attraction is on average 4.1 times more distant than the nearest common restaurant. When the median value is considered, the difference is almost fivefold. To the second nearest vegetarian restaurant, tourists must walk more than half a kilometre and to the third, more than a kilometre, when the median value is considered. Such spatial disadvantage was further confirmed with the quadrat analysis. Pearson correlation coefficient between the location of vegetarian restaurants and tourist attractions, and between the common restaurants and tourist attractions, determined that the distribution of common restaurants is more related to the location of tourist attractions. The dependency of common restaurants, in the highest case, amounts to 0.62 with 38% variance explained, whereas the vegetarian restaurants’ coefficient for the same grid amounts to 0.29 with 9% explained variance.
The spatial disadvantage of vegetarian restaurants was confirmed by the qualitative investigation. None of the 21 sampled food service establishments located in the Old Town Square is vegan or vegetarian. However, the nearest vegetarian restaurant is located on a frequented street between the Old Town Square and Wenceslas Square. The fifth nearest vegetarian restaurant is located 530 m from the central sight of the square, the medieval astronomical clock, whereas the 200th nearest common restaurant is located just 522 m away.
The qualitative investigation further addresses the second research question. It is found that meatless dishes made up 20% of the menus (of which 65% contained cheese), which is 4 percentage points less compared to dishes that include beef, and almost identical with those that include poultry. The most frequently offered meat is pork (27% of dishes). It was therefore confirmed that restaurants were not attentive to the needs of vegetarians (Rivera & Shani, Citation2013; Santos & Booth, Citation1996). This lack of meatless alternatives and, for that reason, a lack of combinations of ingredients could drive tourists to consume more meat (Peters & Remaud, Citation2020). The considerable presence of meat-based dishes on restaurant menus may be a response to the socio-economic structure of tourists. Given that tourists in Prague come mainly from Western countries, the significant demand for meat is expected (Milford et al., Citation2019). Nevertheless, Rivera and Shani (Citation2013) argue that restaurants recognizing a trend towards plant-based diet can gain a competitive edge over restaurants that do not support this veggie trend.
Regarding the third research question, it was found that the structure of menus rather nudges customers to order meat-based dishes since:
meatless dishes were mostly set aside into a separate section,
there was barely no recommendation of meatless dishes,
meatless dishes tended to be situated at the bottom of the menus.
none of the investigated restaurants presented environmental impacts of the offered dishes.
Moreover, the most recommended dishes were based on beef, which was contained in almost every second recommended dish. According to Gössling et al. (Citation2011), Apostolidis and McLeay (Citation2016), Filimonau and Krivcova (Citation2017), Bacon and Krpan (Citation2018) and Kurz (Citation2018), all these aspects lead to a less environmentally sustainable customers’ diets. Hall (Citation2020) also urges that it is time to change the structure of menus; the environmental impacts of the food that tourists eat must be taken into account.
There is a growing, global trend towards sustainable consumption habits. The number of vegans, vegetarians and flexitarians is growing primarily in the developed countries (Dagevos & Voordouw, Citation2013; Hancox, Citation2018; Richmonds, Citation2021; Sabate & Sabaté, Citation2019; Veganz, Citation2020). Such growing demand for meatless food means that a low-carbon image can positively influence the popularity of a destination (Pongthanaisawan et al., Citation2018). However, there is still some way to go before environmental protection can be reconciled in Prague – so far, restaurants have not responded to the recent trend of the society to opt more for a meatless diet. Alternatively, the lack of vegetarian restaurants in the areas with access to the tourist market may result from the fact that current restaurants have been operating for a long time and the city planning rules do not allow more restaurants to be situated in the city centre. The recent trend of opening vegetarian restaurants, therefore, has no opportunity to get close to the tourist market as spaces intended for establishing restaurants are already saturated.
COVID-19’s impact on future direction of tourism
The exploitation of natural resources in tourism is primarily relevant in relation to the later stages of tourism area life cycle (Butler, Citation1980) and the recent phenomena, the so-called overtourism (Mihalic, Citation2020). Due to COVID-19 crisis, the estimated drop in the number of international tourists in the world in 2020 is close to 70% in comparison with the previous year (UNWTO, Citation2020). Additionally, the crisis caused that people may avoid travelling due to the fear of being infected by COVID-19 long after any travel ban removal (Zheng et al., Citation2021). In Prague, international tourist arrivals declined by 3.7 million (i.e. a 73.5% decrease) between January and September in comparison with the same period in 2019 (CSO, Citation2020). With such a decrease, the exploitation of natural resources loses its importance. Nevertheless, tourism is a resistant industry. Pizam and Fleischer (Citation2001), Bonham et al. (Citation2006) or long-term UNWTO (Citation2018) data illustrate that tourism growth occurs after any major event (e.g. the September 11 attacks, the Great Recession in 2008 or terrorism acts in the 1990s in Israel).
Gössling et al. (Citation2020) urge that there should be no return to the usual practice of tourism of the pre-pandemic years. Rather, tourism practices need to be strongly aligned to the sustainable development goals. Such a sustainable shift, however, depends primarily on local governments rather than direct stakeholders. Post-COVID-19 green recovery is also urged by Mansuy (2020), who argues that a shift towards healthy and resilient landscape can be attained by innovative funding strategies. Regarding food, the environmentally sustainable direction of tourism can be achieved in various ways. For example in 2019, German Green and Social Democrats proposed to increase taxation of meat from 7% to 19% to tackle harm caused by methane emissions from livestock and destruction of forests (BBC, Citation2019). A higher taxation that would increase the price of a steak by about 25% is also under consideration in the European Union (Carrington, Citation2020). Higher taxation along with increased availability and affordability of plant-based ready-made products can be an effective way to reduce excessive consumption of meat products (Milford et al., Citation2019). The initial environmental taxation may motivate firms to switch to environmental technology (Krass et al., Citation2013) and so does, on the contrary, environmental subsidies (Bai et al., Citation2018). Higher environmental awareness of consumers is a further effective way to stimulate the firm’s environmental shift (Gao & Zheng, Citation2017). Therefore, it is also required to introduce specific educational measures at national level. At the level of individual establishments, Gössling et al. (Citation2011) argue that it is necessary for food service establishments in tourist destinations to introduce what is termed ‘food management’. This includes the option of at least one attractive vegetarian alternative, the offer of dishes that use less meat and more vegetables, as little as possible imported beef, but also dishes that use less rice and seasonal foods out of their season. The food management also focuses on the preparation and presentation: e.g. purchase energy from renewable sources or arrange buffets so that less carbon-intensive foods are at the centre. Discussing the role of local food, Duram and Cawley (Citation2012) show that strengthening the links between chefs and local producers can improve environmental sustainability rising from the shorter distances travelled between the farm and the restaurant. Pongthanaisawan et al. (Citation2018) argue that the low-carbon image associated with the offer of local food would, in addition, have a positive impact on the popularity of a destination.
Future research
This article and its conclusions provide an empirical background to the unsustainable consumption of tourists at any destination. Associated with the urgent need to restructure tourism, policy makers should consider the implementation of appropriate measures to reduce the environmental impact of food to mitigate the climate change. New investigations have to be conducted in order to identify the most effective measures to enhance environmentally friendly consumption on the one hand, but not affecting restaurant owners significantly on the other.
Research into the willingness of restaurant owners to incorporate sustainable catering should also be considered. If, after learning about the benefits of sustainable gastronomy, the owners themselves are willing to change their offer, there would be no need for supportive or restrictive measures.
Current literature indicates that consumers tend to select dishes with a satisfactory combination of ingredients (Peters & Remaud, Citation2020). The higher proportion of meatless dishes on a menu, the higher the possibility, therefore, that customers may select such a dish. However, the potential effect of a larger offer of vegetarian dishes on increasing their consumption has not yet been investigated. Also, data from restaurants containing all customers’ individual selections would provide relevant findings for future research.
Study limitations
The main limitation to this research is the menu composition investigation. If the exact number of consumed dishes, including the weight of consumed foodstuffs, could have been included, a more exact environmental impact could have been calculated. However, the aim of the qualitative investigation was not to calculate the exact environmental footprint of menus but rather to analyse the access of sustainable gastronomy to tourism market and the choices made available to tourists. Moreover, the insufficient description of dishes could cause, to some extent, a deviation in the results.
The second identified limitation is the existence of other variables that may influence availability of restaurants such as opening hours, popularity or capacity. Nevertheless, due to an enormous difference in the quantity of vegetarian and common restaurants, such variables are rather of secondary importance – common restaurants are more available whether or not they are, on average, open more frequently, are more popular and have more seats.
Disclosure statement
No potential conflict of interest was reported by the author(s).
Correction Statement
This article has been corrected with minor changes. These changes do not impact the academic content of the article.
Additional information
Funding
Notes on contributors
Josef Lochman
Josef Lochman is a PhD student in the field of Regional and Political Geography at Charles University in Czechia. He focuses on environmental tourism, especially with regard to food and the exploitation of natural resources.
References
- Alexander, P., Brown, C., Arneth, A., Finnigan, J., & Rounsevell, M. D. A. (2016). Human appropriation of land for food: The role of diet. Global Environmental Change, 41, 88–98. https://doi.org/10.1016/j.gloenvcha.2016.09.005
- Alles, B., Baudry, J., Méjean, C., Touvier, M., Péneau, S., Hercberg, S., & Guyot, E. K. (2017). Comparison of sociodemographic and nutritional characteristics between self-reported vegetarians, vegans, and meat-eaters from the NutriNet-Santé study. Nutrients, 9(9), 1–18. https://doi.org/10.3390/nu9091023
- Apostolidis, C., & McLeay, F. (2016). Should we stop meating like this? Reducing meat consumption through substitution. Food Policy, 65, 74–89. https://doi.org/10.1016/j.foodpol.2016.11.002
- Arcgis. (n.d.). Geographically weighted regression. https://desktop.arcgis.com/en/arcmap/10 .3/tools/spatial-statistics-toolbox/geographically-weighted-regression.htm
- Ashworth, G., & Page, S. J. (2011). Urban tourism research: Recent progress and current paradoxes. Tourism Management, 32(1), 1–15. https://doi.org/10.1016/j.tourman.2010.02.002
- Babbie, E. R. (2013). The practice of social research. Wadsworth Cengage Learning.
- Bacon, L., & Krpan, D. (2018). (Not) eating for the environment: The impact of restaurant menu design on vegetarian food choice. Appetite, 125, 190–200. https://doi.org/10.1016/j.appet.2018.02.006
- Bai, Y., Hua, C., Jiao, J., Yang, M., & Li, F. (2018). Green efficiency and environmental subsidy: Evidence from thermal power firms in China. Journal of Cleaner Production, 188, 49–61. https://doi.org/10.1016/j.jclepro.2018.03.312
- BBC. (2019, August 8). Climate change: German MPs want higher meat tax. BBC. https://www.bbc.com/news/world-europe-49281111
- Beardsworth, A. D., & Keil, E. T. (1991). Vegetarianism, veganism, and meat avoidance: Recent trends and findings. British Food Journal, 93(4), 19–24. https://doi.org/10.1108/00070709110135231
- Bellarby, J., Tirado, R., Leip, A., Weiss, F., Lesschen, J. P., & Smith, P. (2012). Livestock greenhouse gas emissions and mitigation potential in Europe. Global Change Biology, 19(1), 3–18. https://doi.org/10.1111/j.1365-2486.2012.02786.x
- Bonham, C., Edmonds, C., & Mak, J. (2006). The impact of 9/11 and other terrible global events on tourism in the United States and Hawaii. Journal of Travel Research, 45(99), 99–110. https://doi.org/10.1177/0047287506288812
- Boros, L., Dudás, G., Kovalcsik, T., Papp, S., & Vida, G. (2018). Airbnb in Budapest: Analysing spatial patterns and room rates of hotels and peer-to-peer accommodations. GeoJournal of Tourism and Geosites, 21(1), 26–38.
- Borruso, G. (2008). Network density estimation: A GIS approach for analysing point patterns in a network space. Transactions in GIS, 12(3), 377–402. https://doi.org/10.1111/j.1467-9671.2008.01107.x
- Butler, R. W. (1980). The concept of a tourist area cycle of evolution: Implications for management of resources. Canadian Geographer, 24(1), 5–12. https://doi.org/10.1111/j.1541-0064.1980.tb00970.x
- Capocchi, A., Vallone, C., Pierotti, M., & Amaduzzi, A. (2019). Overtourism: A literature review to assess implications and future perspectives. Sustainability, 11(12), 1–18. https://doi.org/10.3390/su11123303
- Carrington, D. (2020, February 4). EU urged to adopt meat tax to tackle climate emergency. The Guardian. https://www.theguardian.com/environment/2020/feb/04/eu-meat-tax-climate-emergency
- Chen, D. J. (2018). Couchsurfing: Performing the travel style through hospitality exchange. Tourist Studies, 18(1), 105–122. https://doi.org/10.1177/1468797617710597
- Cramer, H., Kessler, C. S., Sundberg, T., Leach, M. J., Schumann, D., Adams, J., & Lauche, R. (2017). Characteristics of Americans choosing vegetarian and vegan diets for health reasons. Journal of Nutrition Education and Behavior, 49(7), 561–567. https://doi.org/10.1016/j.jneb.2017.04.011
- Crowe, S., Cresswell, K., Robertson, A., Huby, G., Avery, A., & Sheikh, A. (2011). The case study approach. BMC Medical Research Methodology, 11(1), 1–9. https://doi.org/10.1186/1471-2288-11-100
- CSO. (2020). Tourism: Collective accommodation establishments [Data set]. Public Database. https://vdb.czso.cz/vdbvo2/faces/cs/index.jsf?page=statistiky
- CzechTourism. (2010). Výroční zpráva 2009 [Annual report 2009]. https://www.czechtourism.cz/cms/getmedia/0c1f6345-19b1-4d80-8958-02792e185d88/22_06_10_vyrocni_zprava_2009.pdf
- CzechTourism. (2019). Domácí a příjezdový cestovní ruch [Domestic and inbound tourism]. https://tourdata.cz/wp-content/uploads/2019/08/DCR-a-PCR_GfK_15-08-2019_PREZENTACE.pdf
- CzechTourism. (2020a). Gastronomie jako motivátor návštěvy ČR [Gastronomy as a motivator for a visit to the Czech Republic]. https://tourdata.cz/data/gastronomie-jako-motivator-cesty-do-cr/
- CzechTourism. (2020b). Návštěvnost turistických cílů 2019: Praha [Attendance of tourists destinations 2019: Prague]. https://tourdata.cz/data/navstevnost-turistickych-cilu-praha/
- CzechTourism. (2021). Marketingový plán 2021 [Marketing plan 2021]. https://www.czechtourism.cz/cms/getmedia/5b1d58a8-4dc9-4199-9b5c-bfcd376fba47/Marketinove_planovani_2021.pdf
- Dagevos, H., & Voordouw, J. (2013). Sustainability and meat consumption: Is reduction realistic? Sustainability: Science, Practice and Policy, 9(2), 60–69. https://doi.org/10.1080/15487733.2013.11908115
- Dixit, S. K. (2019). Gastronomic tourism: A theoretical construct. In S. K. Dixit (Ed.), The Routledge handbook of gastronomic tourism (pp. 13–23). Routledge. https://doi.org/10.4324/9781315147628
- Dixit, S. K. (2020). Marketing gastronomic tourism experiences. In S. K. Dixit (Ed.), The Routledge handbook of tourism experience management and marketing (pp. 322–335). Routledge.
- Dixit, S. K., & Mawroh, H. (2019). Cultural manifestation of food in branding destination: A case of Khasi food of Meghalaya, India. In E. Park, S. Kim, & I. Yeoman (Eds.), Food tourism in Asia (Chapter 10, pp. 143–154). Springer. https://doi.org/10.1007/978-981-13-3624-9_10
- Dodds, R., & Butler, R. (2019). The phenomena of overtourism: A review. International Journal of Tourism Cities, 5(4), 519–528. https://doi.org/10.1108/IJTC-06-2019-0090
- Domenech, A., Mohino, I., & Moya-Gómez, B. (2020). Using Flickr geotagged photos to estimate visitor trajectories in world heritage cities. International Journal of Geo-Information, 9(11), 1–28. https://doi.org/10.3390/ijgi9110646
- Dumbrovská, V. (2016). Urban tourism development in Prague: From tourist Mecca to tourist Ghetto. In N. Bellini & C. Pasquinelli (Eds.), Tourism in the city: Towards an integrative agenda on urban tourism (pp. 275–283). Springer.
- Dumbrovská, V., & Fialová, D. (2020). The city of one hundred souvenir shops: Authenticity of souvenirs in Prague. Journal of Tourism and Cultural Change, 18(2), 187–200. https://doi.org/10.1080/14766825.2019.1606228
- Duram, L. A., & Cawley, M. (2012). Irish chefs and restaurants in the geography of “local” food value chains. The Open Geography Journal, 5(1), 16–25. https://doi.org/10.2174/1874923201205010016
- Enthoven, M. P. M., & Brouwer, A. E. (2019). What fires up my cooking? The choice for a sustainable cuisine: Passion and self-transcendence in the restaurant business. Research in Hospitality Management, 9(1), 69–76. https://doi.org/10.1080/22243534.2019.1653587
- ESRI. (2019). ArcGIS desktop (Version 10.7.1) [Computer software]. Environmental Systems Research Institute.
- Euridice. (2019). Czech Republic: Population: demographic situation, languages and religions. https://eacea.ec.europa.eu/national-policies/eurydice/content/population-demographic-situation-languages-and-religions-21_en
- Filimonau, V., & Krivcova, M. (2017). Restaurant menu design and more responsible consumer food choice: An exploratory study of managerial perceptions. Journal of Cleaner Production, 143, 516–527. https://doi.org/10.1016/j.jclepro.2016.12.080
- Friel, S., Dangour, A. D., Garnett, T., Lock, K., Chalabi, Z., Roberts, I., Butler, A., Butler, C. D., Waage, J., McMichael, A. J., & Haines, A. (2009). Public health benefits of strategies to reduce greenhouse-gas emissions: Food and agriculture. Lancet, 374(9706), 2016–2025. https://doi.org/10.1016/S0140-6736(09)61753-0
- Gao, X., & Zheng, H. (2017). Environmental concerns, environmental policy and green investment. International Journal of Environmental Research and Public Health, 14(2), 1–13. https://doi.org/10.3390/ijerph14121570
- Garcia-Hernández, M., Ivars-Baidal, J., & Mendoza, S. (2019). Overtourism in urban destinations: The myth of smart solutions. Boletín de la Asociación de Geógrafos Españoles [Bulletin of the Association of Spanish Geographers], 83, 1–38. https://doi.org/10.21138/bage.2830
- Garnett, T. (2011). Where are the best opportunities for reducing greenhouse gas emissions in the food system (including the food chain)? Food Policy, 36(1), S23–S32. https://doi.org/10.1016/j.foodpol.2010.10.010
- Geoportal Praha. (2020). Pěší trasy [Data set]. Opendata. https://www.geoportalpraha.cz/cs/data/metadata/07092410-15B2-47A0-BAC9-5BA260F8703B
- Godfray, H. C. J., Beddington, J. R., Crute, I. R., Haddad, L., Lawrence, D., Muir, J. F., Pretty, J., Robinson, S., Thomas, S. M., & Toulmin, C. (2010). Food security: The challenge of feeding 9 billion people. Science, 327(5967), 812–818. https://doi.org/10.1126/science.1185383
- González-García, S., González-García, R., Vázquez, L. G., Moreira, M. T., & Leis, R. (2020). Tracking the environmental footprints of institutional restaurant service in nursery schools. Journal of Total Environment, 728, 1–13. https://doi.org/10.1016/j.scitotenv.2020.138939
- Gössling, S. (2015). New key performance indicators for water management in tourism. Tourism Management, 46, 233–244. https://doi.org/10.1016/j.tourman.2014.06.018
- Gössling, S., Garrod, B., Aall, C., Hille, J., & Peeters, P. (2011). Food management in tourism: Reducing tourism’s carbon ‘foodprint’. Tourism Management, 32(3), 534–543. https://doi.org/10.1016/j.tourman.2010.04.006
- Gössling, S., & Peeters, P. (2015). Assessing tourism’s global environmental impact 1900–2050. Journal of Sustainable Tourism, 23(5), 639–659. https://doi.org/10.1080/09669582.2015.1008500
- Gössling, S., Scott, D., & Hall, M. (2018). Global trends in length of stay: Implications for destination management and climate change. Journal of Sustainable Tourism, 26(12), 2087–2101. https://doi.org/10.1080/09669582.2018.1529771
- Gössling, S., Scott, D., & Hall, C. M. (2020). Pandemics, tourism and global change: A rapid assessment of COVID-19. Journal of Sustainable Tourism, 29(1), 1–20. https://doi.org/10.1080/09669582.2020.1758708
- Gutiérrez, J., García-Palomares, J. C., Romanillos, G., & Salas-Olmedo, M. H. (2017). The eruption of Airbnb in tourist cities: Comparing spatial patterns of hotels and peer-to-peer accommodation in Barcelona. Tourism Management, 62, 278–291. https://doi.org/10.1016/j.tourman.2017.05.003
- Hall, C. M. (2020). Improving the recipe for culinary and food tourism? The need for a new menu. Tourism Recreation Research, 45(2), 284–287. https://doi.org/10.1080/02508281.2019.1694243
- Hall, C. M., & Sharples, L. (2003). The consumption of experiences or the experience of consumption? An introduction to the tourism of taste. In C. M. Hall, L. Sharples, R. Mitchell, N. Macionis, & B. Cambourne (Eds.), Food tourism around the world (pp. 1–24). Butterworth-Heinemann.
- Hallström, E., Carlsson-Kanyama, A., & Börjesson, P. (2015). Environmental impact of dietary change: A systematic review. Journal of Cleaner Production, 91, 1–11. https://doi.org/10.1016/j.jclepro.2014.12.008
- Hancox, D. (2018, April 1). The unstoppable rise of veganism: How a fringe movement went mainstream. The Guardian. https://www.theguardian.com/lifeandstyle/2018/apr/01/vegans-are-coming-millennials-health-climate-change-animal-welfare
- HappyCow. (n.d.). World veggie map. Retrieved July 10, 2020, from https://www.happycow.net/veggiemap?zoom=6&clat=49.80379914478347&clng=15.018310546875002
- Hargreaves, S. M., Nakano, E. Y., & Zandonadi, R. P. (2020). Brazilian vegetarian population—Influence of type of diet, motivation and sociodemographic variables on quality of life measured by specific tool (VEGQOL). Nutrients, 15(5), 1–22. https://doi.org/10.3390/nu12051406
- Hayllar, B., & Griffin, T. (2009). Urban tourist precincts as sites of play. In G. Maciocco & S. Serreli (Eds.), Enhancing the city: New perspectives for tourism and leisure: Vol. 6. Urban and landscape perspectives (pp. 65–81). Springer.
- Henderson, J. C. (2009). Food tourism reviewed. British Food Journal, 111(4), 317–326. https://doi.org/10.1108/00070700910951470
- Hendl, J. (2005). Kvalitativní výzkum: Základní metody a aplikace [Qualitative research: basic methods and applications]. Portál.
- IPCC. (2014). Climate change 2014: Mitigation of climate change. Contribution of working group III to the fifth assessment report of the Intergovernmental Panel on Climate Change. Cambridge University Press.
- Juvan, E., Grün, B., & Dolnicar, S. (2018). Biting off more than they can chew: Food waste at hotel breakfast buffets. Journal of Travel Research, 57(2), 232–242. https://doi.org/10.1177/0047287516688321
- Karim, S. A., & Chi, C. G. Q. (2010). Culinary tourism as a destination attraction: An empirical examination of destinations’ food image. Journal of Hospitality Marketing & Management, 19(6), 253–261. https://doi.org/10.1080/19368623.2010.493064
- Kádár, B. (2013). Differences in the spatial patterns of urban tourism in Vienna and Prague. Urbani Izziv, 24(2), 96–111. https://doi.org/10.5379/urbani-izziv-en-2013-24-02-002
- Khan, N. U., Wan, W., & Yu, S. (2020). Spatiotemporal analysis of tourists and residents in Shanghai based on location-based social network’s data from Weibo. International Journal of Geo-Information, 9(2), 1–15. https://doi.org/10.3390/ijgi9020070
- Ki, D., & Lee, S. (2019). Spatial distribution and location characteristics of Airbnb in Seoul, Korea. Sustainability, 11(5), 1–16. https://doi.org/10.3390/su11154108
- Kivela, J., & Crotts, J. C. (2005). Gastronomy tourism. Journal of Culinary Science & Technology, 4(2-3), 39–55. https://doi.org/10.1300/J385v04n02_03
- Krass, D., Nedorezov, T., & Ovchinnikov, A. (2013). Environmental taxes and the choice for green technology. Productions and Operations Management, 22(5), 1035–1055. https://doi.org/10.1111/poms.12023
- Kurz, V. (2018). Nudging to reduce meat consumption: Immediate and persistent effects of an intervention at a university restaurant. Journal of Environmental Economics and Management, 90, 317–341. https://doi.org/10.1016/j.jeem.2018.06.005
- Lee, Y. J., Pennington-Gray, L., & Kim, J. (2019). Does location matter? Exploring the spatial patterns of food safety in a tourism destination. Tourism Management, 71(1), 18–33. https://doi.org/10.1016/j.tourman.2018.09.016
- Li, Y., Filimonau, V., Wang, L., & Cheng, S. (2020). Tourist food consumption and its arable land requirements in popular tourist destination. Resources, Conservation & Recycling, 153, 1–12. https://doi.org/10.1016/j.resconrec.2019.104587
- Li, Y., Wang, L., & Cheng, S. (2019). Tourists’ food consumption characteristics and influencing factors in tourism cities on the plateau: An empirical study of Lhasa. Resources Science, 41(3), 494–508. https://doi.org/10.18402/resci.2019.03.08
- Li, Y., Wang, L., Liu, X., & Cheng, S. (2018). Structure and characteristics of food consumption of rural households in Shandong Province based on household tracking survey. Journal of Natural Resources, 33(6), 978–991. https://doi.org/10.31497/zrzyxb.20180216
- Lidovky. (2019, December 13). Praha očekává o Vánocích okolo 700 tisíc turistů. Magistrát do osvětlení investoval přes 4 miliony korun. Lidové noviny [Prague expects 700 thousand tourists around Christmas: The municipality has invested over 4 million crowns. Lidové Noviny]. https://www.lidovky.cz/domov/praha-ocekava-o-vanocich-okolo-700-tisic-turistu-magistrat-do-osvetleni-investoval-pres-4-miliony-ko.A191213_174421_ln_domov_ele
- Lin, M., Chu, L., Tsai, C. M., Chen, C. H., & Chen, C. C., & I, C. (2009). Geovisualization of tourist activity travel patterns using 3D GIS: An empirical study of Tamsui, Taiwan. World Academy of Science, Engineering and Technology, 36(s), 401–405. http://doi.org/10.5281/zenodo.1328974
- Lochman, J. (2019). Prostorové aspekty sdílené ekonomiky v cestovním ruchu: Případ Couchsurfingu [Spatial aspects of the sharing economy in Tourism: The case of Couchsurfing] [Master’s thesis, Charles University]. Charles University Thesis Repository. https://is.cuni.cz/webapps/zzp/detail/187243/?lang=en
- López-Guzmán, T., & Sánchez-Cañizares, S. (2012). Gastronomy, tourism and destination differentiation: A case study in Spain. Review of Economics & Finance, 2, 63–72.
- Machovina, B., Feeley, K. J., & Ripple, W. J. (2015). Biodiversity conservation: The key is reducing meat consumption. Science of Total Environment, 536, 419–431. https://doi.org/10.1016/j.scitotenv.2015.07.022
- Mak, A. H. N., Lumbers, N., Eves, A., & Chang, R. C. I. (2012). Factors influencing tourist food consumption. International Journal of Hospitality Management, 31(3), 928–936. https://doi.org/10.1016/j.ijhm.2011.10.012
- Mazanec, J. A. (1997). Segmenting city tourists into vacation styles. In G. Maier, J. A. Mazanec, K. Wober, & K. Grabler (Eds.), International city tourism: Analysis and strategy (pp. 114–128). Continuum.
- Mihalic, T. (2020). Conceptualising overtourism: A sustainability approach. Annals of Tourism Research, 84, 1–12. https://doi.org/10.1016/j.annals.2020.103025
- Milford, A. B., Mouël, C., Bodirsky, B. L., & Rolinski, S. (2019). Drivers of meat consumption. Appetite, 141, 1–11. https://doi.org/10.1016/j.appet.2019.06.005
- Mohamed, M. E. A., Hewedi, M. M., Lehto, X., & Maayouf, M. (2020). Egyptian food experience of international visitors: A multidimensional approach. International Journal of Contemporary Hospitality Management, 32(8), 2593–2611. https://doi.org/10.1108/IJCHM-02-2020-0136
- Molz, J. G. (2013). Social networking technologies and the moral economy of alternative tourism: The case of couchsurfing.org. Annals of Tourism Research, 43, 210–230. https://doi.org/10.1016/j.annals.2013.08.001
- Mueller-Warrant, G. W., Whittaker, G. W., & Young, W. C. (2008). GIS analysis of spatial clustering and temporal change in weeds of grass seed crops. Weed Science, 56(5), 647–669. https://doi.org/10.1614/WS-07-032.1
- Niederle, P., & Schubert, M. N. (2020). HOW does veganism contribute to shape sustainable food systems? Practices, meanings and identities of vegan restaurants in Porto Alegre, Brazil. Journal of Rural Studies, 78, 304–313. https://doi.org/10.1016/j.jrurstud.2020.06.021
- Nixon, H., & Doud, L. (2011). Do fast food restaurants cluster around high schools? A geospatial analysis of proximity of fast-food restaurants to high schools and the connection to childhood obesity rates. Journal of Agriculture, Food Systems, and Community Development, 2(1), 181–194. https://doi.org/10.5304/jafscd.2011.021.007
- OpenStreetMap. (2020). Czechia [Data set]. Open Street Map. http://download.geofabrik.de/
- Opio, C., Gerber, P., Mottet, A., Falcucci, A., Tempio, G., MacLeod, M., Vellinga, T., Henderson, B., & Steinfeld, H. (2013). Greenhouse gas emissions from ruminant supply chains – A global life cycle assessment. Food and Agriculture Organization of the United Nations.
- Osborne, R. H., Kazimour, J., & Carter, F. W. (2020). Prague. https://www.britannica.com/place/Prague
- Peeters, P., Gössling, S., Klijs, J., Milano, C., Novelli, M., Dijkmans, C., Eijgelaar, E., Hartman, S., Heslinga, J., Isaac, R., Mitas, O., Moretti, S., Nawijn, J., Papp, B., & Postma, A. (2018). Research for TRAN Committee – Overtourism: Impact and possible policy responses. European Parliament, Policy Department for Structural and Cohesion Policies.
- Peters, K., & Remaud, P. H. (2020). Factors influencing consumer menu-item selection in a restaurant context. Food Quality and Preference, 82, 1–10. https://doi.org/10.1016/j.foodqual.2020.103887
- Pieper, M., Michalke, A., & Gaugler, T. (2020). Calculation of external climate costs for food highlights inadequate pricing of animal products. Nature Communications, 11(1), 1–13. https://doi.org/10.1038/s41467-020-19474-6
- Pinke-Sziva, I., Smith, M., Olt, G., & Berezvai, Z. (2019). Overtourism and the night-time economy: A case study of Budapest. International Journal of Tourism Cities, 5(1), 1–16. https://doi.org/10.1108/IJTC-04-2018-0028
- Pizam, A., & Fleischer, A. (2001). Severity vs. frequency of acts of terrorism: Which has a larger impact on tourism demand? Journal of Travel Research, 40(3), 1–11. https://doi.org/10.1177/0047287502040003011
- Pongthanaisawan, J., Wangjiraniran, W., Chuenwong, K., & Pimonsree, L. (2018). Scenario planning for low carbon tourism city: A case study of Nan. Energy Procedia, 152, 715–724. https://doi.org/10.1016/j.egypro.2018.09.235
- Poore, J., & Nemecek, T. (2018). Reducing food’s environmental impacts through producers and consumers. Science, 360(6392), 987–992. https://doi.org/10.1126/science.aaq0216
- Privitera, D., Nedelcu, A., & Nicula, V. (2018). Gastronomic and food tourism as an economic local resource: Case studies from Romania and Italy. Geojournal of Tourism and Geosites, 21(1), 143–157.
- Quam, V. G. M., Rocklöv, J., Quam, M. B. M., & Lucas, R. A. I. (2017). Assessing greenhouse gas emissions and health co-benefits: A structured review of lifestyle-related climate change mitigation strategies. International Journal of Environmental Research and Public Health, 14(5), 1–19. https://doi.org/10.3390/ijerph14050468
- Quan, S., & Wang, N. (2004). Towards a structural model of the tourist experience: An illustration from food experiences in tourism. Tourism Management, 25(3), 297–305. https://doi.org/10.1016/S0261-5177(03)00130-4
- Reisch, L., Eberle, U., & Lorek, S. (2013). Sustainable food consumption: An overview of contemporary issues and policies. Sustainability: Science, Practice and Policy, 9(2), 7–15. https://doi.org/10.1080/15487733.2013.11908111
- Reisinger, A., & Clark, H. (2017). How much do direct livestock emissions actually contribute to global warming? Global Change Biology, 24(4), 1749–1761. https://doi.org/10.1111/gcb.13975
- Richards, G. (2002). Gastronomy: An essential ingredient in tourism production and consumption? In A. M. Hjalager & G. Richards (Eds.), Tourism and gastronomy (pp. 3–20). Routledge.
- Richmonds, S. (2021, January 8). More and more people turn to flexitarianism, poll reveals. The Independent. https://www.independent.co.uk/life-style/food-and-drink/uk-diet-flexitarianism-vegetables-b1784489.html
- Rivera, M., & Shani, A. (2013). Attitudes and orientation toward vegetarian food in the restaurant industry: An operator’s perspective. International Journal of Contemporary Hospitality Management, 25(7), 1049–1065. https://doi.org/10.1108/IJCHM-07-2012-0116
- Roelofsen, M. (2018). Exploring the socio-spatial inequalities of Airbnb in Sofia, Bulgaria. Erdkunde, 72(4), 313–327. https://doi.org/10.3112/erdkunde.2018.04.04
- Sabate, R. S., & Sabaté, J. (2019). Consumer Attitudes towards environmental concerns of meat consumption: A systematic review. International Journal of Environmental Research and Public Health, 16(7), 1–8. https://doi.org/10.3390/ijerph16071220
- Salas-Olmedo, M. H., Moya-Gómez, B., García-Palomares, J. C., & Gutiérrez, J. (2018). Tourists’ digital footprint in cities: Comparing big data sources. Tourism Management, 66, 13–25. https://doi.org/10.1016/j.tourman.2017.11.001
- Salehi, G., Carmona, E. D., & Redondo, R. (2020, July 2–4). Consumers’ switching to vegan, vegetarian, and plantbased (veg*an) diets: A systematic review of literature. 9th International Congress on Public and Nonprofit Marketing.
- Santos, M. L. S., & Booth, D. A. (1996). Influences on meat avoidance among British students. Appetite, 27(3), 197–205. https://doi.org/10.1006/appe.1996.0046
- Sayer, A. (2000). Realism and social science. Sage.
- Schuckert, M., Peters, M., & Pilz, G. (2018). The co-creation of host-guest relationships via Couchsurfing: A qualitative study. Tourism Recreational Research, 43(2), 220–234. https://doi.org/10.1080/02508281.2017.1384127
- Scott, L. M., & Janikas, M. V. (2009). Spatial statistics in ArcGIS. In M. M. Fischer & A. Getis (Eds.), Handbook of applied spatial analysis: 27 software tools, methods and applications (pp. 27–41). Springer.
- Shoval, N., McKercher, B., Ng, E., & Birenboim, A. (2011). Hotel location and tourist activity in cities. Annals of Tourism Research, 38(4), 1594–1612. https://doi.org/10.1016/j.annals.2011.02.007
- Shoval, N., & Raveh, A. (2004). Categorization of tourist attractions and the modelling of tourist cities: Based on the co-plot method of multivariate analysis. Tourism Management, 25(6), 741–750. https://doi.org/10.1016/j.tourman.2003.09.005
- Silvennoinen, K., Katajajuuri, J. M., Hartikainen, H., Jalkanen, L., Koivupuro, H. K., & Reinikainen, A. (2012, November 12–15). Food waste volume and composition in the Finnish supply chain: Special focus on food service sector. Fourth International Symposium on Energy from Biomass and Waste, Venice, Italy.
- Smith, P., Haberl, H., Popp, A., Erb, K. H., Lauk, C., Harper, R., Tubiello, F. N., Pinto, A. S., Jafari, M., Sohi, S., Masera, O., Ottcher, H. B., Berndes, G., Bustamante, M., Ahammad, H., Clark, H., Dong, H., Elsiddig, E. A., Mbow, C., … Rose, S. (2013). How much land-based greenhouse gas mitigation can be achieved without compromising food security and environmental goals? Global Change Biology, 19(8), 2285–2302. https://doi.org/10.1111/gcb.12160
- Stehfest, E., Bouwman, L., Vuuren, D. P., Elzen, M. G. J., Eickhout, B., & Kabat, P. (2009). Climate benefits of changing diet. Climate Change, 95(1–2), 83–102. https://doi.org/10.1007/s10584-008-9534-6
- Steinfeld, H., Gerber, P., Wassenaar, T., Castel, V., Rosales, M., & Haan, C. (2006). Livestock’s long shadow. FAO.
- Szromek, A. R., Kruczek, Z., & Walas, B. (2020). The attitude of tourist destination residents towards the effects of overtourism – Kraków case study. Sustainability, 12(1), 1–17. https://doi.org/10.3390/su12010228
- Tait, R. (2019, August 25). The fall of Prague: ‘Drunk tourists are acting like they’ve conquered our city’. The Guardian. https://www.theguardian.com/world/2019/aug/25/prague-drunk-tourists-conquer-our-city
- Tait, R. (2020, February 1). ‘I’m a stranger in my own city’: Prague takes on Airbnb to dam flood of tourists. The Guardian. https://www.theguardian.com/environment/2020/feb/01/overwhelmed-prague-tries-to-limit-airbnb-to-curb-tourism
- Temelová, J., Novák, J., Ouředníček, M., & Puldová, P. (2010). Housing estates in the Czech Republic after socialism: Various trajectories and inner differentiation. Urban Studies, 48(9), 1811–1834. https://doi.org/10.1177/0042098010379279
- Tilman, D., & Clark, M. (2014). Global diets link environmental sustainability and human health. Nature, 515(7528), 518–522. https://doi.org/10.1038/nature13959
- UNESCO. (n.d.). World heritage list. Retrieved August 11, 2020, from https://whc.unesco.org/en/list/
- UNWTO. (2017). Second global report on gastronomy tourism. UNWTO.
- UNWTO; Centre of Expertise Leisure, Tourism & Hospitality; NHTV Breda University of Applied Sciences; and NHL Stenden University of Applied Sciences (2018). Overtourism? Understanding and Managing Urban Tourism Growth beyond Perceptions. UNWTO.
- UNWTO. (2018). Tourism highlights. https://www.e-unwto.org/doi/pdf/10 .18111/9789284419876
- UNWTO. (2020). International travel plunges 70% in the first eight months of 2020. World Tourism Barometer, 18(6), 1–36. https://doi.org/10.18111/wtobarometereng.2020.18.1.6
- Veganz. (2020). Veganz nutrition study. https://veganz.com/blog/veganz-nutrition-study-2020/
- Wang, L., Xue, L., Li, Y., Liu, X., Cheng, S., & Liu, G. (2018). Horeca food waste and its ecological footprint in Lhasa, Tibet, China. Resources, Conservation & Recycling, 136, 1–8. https://doi.org/10.1016/j.resconrec.2018.04.001
- Wang, S., Lehto, X., & Cai, L. (2020). Creature of habit or embracer of change? Contrasting consumer daily food behavior with the tourism scenario. Journal of Hospitality & Tourism Research, 43(4), 595–616. https://doi.org/10.1177/1096348018817586
- Wansink, B., & Love, K. (2014). Slim by design: Menu strategies for promoting high-margin, healthy foods. International Journal of Hospitality Management, 42, 137–143. https://doi.org/10.1016/j.ijhm.2014.06.006
- WFP. (2011). Facts blasts. https://documents.wfp.org/stellent/groups/public/documents/communications/wfp187701.pdf
- World Food Travel Association. (2021). What is food tourism? https://worldfoodtravel.org/what-is-food-tourism/
- Xuan, Q., Zhou, M., Zhang, Z. Y., Fu, C., Xiang, Y., Wu, Z., & Filkov, V. (2018). Modern food foraging patterns: Geography and cuisine choices of restaurant patrons on yelp. IEEE Transactions on Computational Social Systems, 5(2), 508–517. https://doi.org/10.1109/TCSS.2018.2819659
- Yin, R. K. (2003). Case study research: Design and methods (3rd ed.). Sage.
- Yue, Q., Xu, X., Hillier, J., Cheng, K., & Pan, G. (2017). Mitigating greenhouse gas emissions in agriculture: From farm production to food consumption. Journal of Cleaner Production, 149, 1011–1019. https://doi.org/10.1016/j.jclepro.2017.02.172
- Yun, H., Kang, J., & Lee, D. J., & J, M. (2018). Spatiotemporal distribution of urban walking tourists by season using GPS-based smartphone application. Asia Pacific Journal of Tourism Research, 23(11), 1047–1061. https://doi.org/10.1080/10941665.2018.1513949
- Zee, E., & Bertocchi, D. (2018). Finding patterns in urban tourist behaviour: A social network analysis approach based on TripAdvisor reviews. Information Technology & Tourism, 20(1-4), 153–180. https://doi.org/10.1007/s40558-018-0128-5
- Zee, E., Bertocchi, D., & Vanneste, D. (2020). Distribution of tourists within urban heritage destinations: A hot spot/cold spot analysis of TripAdvisor data as support for destination management. Current Issues in Tourism, 23(2), 175–196. https://doi.org/10.1080/13683500.2018.1491955
- Zhai, S., Xu, X., Yang, L., Zhou, M., Zhang, L., & Qiu, B. (2015). Mapping the popularity of urban restaurants using social media data. Applied Geography, 63, 113–120. https://doi.org/10.1016/j.apgeog.2015.06.006
- Zheng, D., Luo, Q., & Ritchie, B. W. (2021). Afraid to travel after COVID-19? Self-protection, coping and resilience against pandemic ‘travel fear’. Tourism Management, 83(1), 1–13. https://doi.org/10.1016/j.tourman.2020.104261