
Abstract
On average low grain yields of less than 1.5 t ha-1 are obtained with canola in the Western Cape province of South Africa. Injudicious use of fertiliser has been suggested as a major cause, hence the study was done to determine the effect of soil and climatic conditions, as experienced at different localities, on grain yield and quality response of canola to nitrogen (N) and sulphur (S) applications in a three-year study. Treatments consisted of five N (0, 30, 60, 90 and 120 kg N ha-1) and three S (0, 15 and 30 kg S ha-1) rates laid out in a randomised complete block design with a factorial split-plot arrangement. The study showed that the effect of N supply increased with S supply and was greater in high rainfall areas and seasons than in drier conditions. Low rainfall during flowering and podding may limit yield responses to N applications, with applications of 120 kg N ha-1 and 15–30 kg S ha-1 needed in high rainfall areas to obtain yields of more than 2.0 t ha-1. Application of S also improves the oil content of canola though this compromises protein content.
Introduction
Canola (Brassica napus L.), an emerging oilseed crop, has become a plant of major economic importance, with global production increasing to almost 60 million metric tonnes worldwide in 2010 (Daku et al. Citation2012). The crop offers potential for use with production of high-quality edible oil, as a source of plant protein meal for feeds, or a potential alternative as biofuel (Rayner Citation2002; Abdallah et al. Citation2010).
Production of the crop in South Africa is still low compared to major global producers. The Monthly Food Security Bulletin of South Africa (DAFF Citation2012) reports on canola production statistics for the 2011 season with a total of 59 490 t on an area of 43 510 ha indicating a national average yield of 1.37 t ha-1. Increasing land area for canola production within the Western Cape, where the crop is mostly planted, is restricted due to competition with other winter crops, hence yield increases should focus on an increase per land area. Fertilisation with nitrogen (N) has been reported to increase yield considerably in other canola-growing regions of the world (Hocking et al. Citation1997; Jan et al. Citation2002; Svečnjak and Rengel Citation2006; Balint et al. Citation2008) and in controlled environments (Ngezimana and Agenbag Citation2013), but showed poor and or variable responses in the Western Cape production area (Hardy et al. Citation2004).
In order to obtain high grain yields with good quality in canola, it is necessary to balance the nutritional supply and the synthesis of oil and crude protein in the seeds (Ahmad et al. Citation2007). Canola is a heavy nutrient feeder such that the requirements of various macronutrients (particularly N and sulphur [S]) are higher in canola compared to cereals (Oplinger et al. Citation2000; Gan et al. Citation2008). Sulphur plays a very crucial role in canola, affecting growth and yields, with its requirements about four times higher than that of wheat or maize (Abdallah et al. Citation2010).
McGrath and Zhao (Citation1996) reported that low S supply suppresses the development of reproductive organs and may lead to silique abortion and decreased seed yield and oil content in canola. Sulphur forms an integral part of several amino acids and hence affects protein content of the seed (Jan et al. Citation2010). Malhi et al. (Citation2007) has shown the effects of S deficiency and applied S to be more pronounced on seed than straw yield. Grain yield responses to applied S only occurred when N was applied and tended to increase as more N was applied (Breennon and Bolland Citation2008). Producing high-yielding canola therefore is only possible with sufficient supply of both N and S. Usually, addition of S within the range of 10–30 kg S ha-1 has been found adequate for optimum seed and oil yield with 15–20 kg S ha-1 suggested per tonne yield per year (McGrath and Zhao Citation1996). Jackson (Citation2000) showed that about 20 kg S ha-1 was adequate for optimum seed and oil yields, and total plant N, phosphorus, potassium and S uptake averaged 140, 25, 170 and 60 kg ha-1, respectively. These results were obtained at the optimum levels of N and S to give a yield potential of 3 t ha-1. The optimum S supply and uptake, however, depends on the N:S supply ratio of 7:1 suggested by Janzen and Bettany (Citation1984), as well as soil and climatic conditions.
No research on the response of canola to S and N fertiliser applications has been done previously in the Western Cape canola-producing areas. The major aim of this research was to determine the effect of N and S interaction on the grain yield and quality of canola grown at different localities in the Western Cape province of South Africa.
Materials and methods
Locality
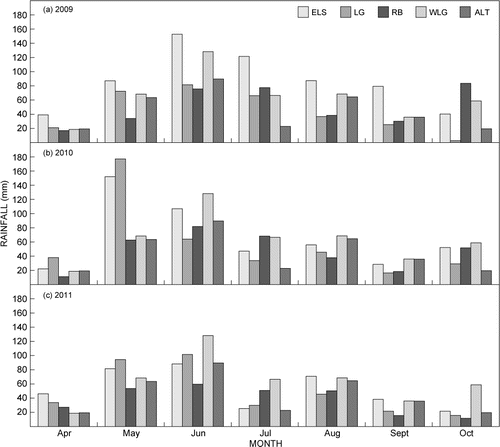
Field experiments were conducted at the Elsenburg (33°51′ S, 18°51′ E; 117 m above sea level [asl]), Langgewens (33°17′ S, 18°40′ E; 91 m asl) and Roodebloem (34°22′ S, 19°52′ E; 132 m asl) experimental stations of the Western Cape province of South Africa during the canola seasons of 2009, 2010 and 2011, as well as at Welgevallen (33°52′ S, 18°42′ E; 119 m asl) during 2010 and at Altona (33°42′ S, 18°37′ E; 42 m asl) during 2011. In 2009, Elsenburg received the highest total rainfall (May to Ngezimana and Agenbag October) of 568.3 mm, whilst Roodebloem and Langgewens received a total rainfall of 339.4 and 285.2 mm, respectively (). In 2010, Elsenburg received more rain (442.9 mm) than Welgevallen (426.6 mm), Langgewens (366 mm) and Roodebloem (320.9 mm). During the canola growing season, the 2011 rainfall totals were far below that of previous years at most localities except at Langgewens (308.6 mm), which was higher than in 2009, although below that received in 2010 at the same locality. During 2011, Elsenburg received a higher total rainfall (325.8 mm) than Langgewens (308.6 mm), Altona (295.9 mm) and Roodebloem (241.5 mm). Temperatures were generally favourable for canola production even though the 2010 season was considerably warmer at all localities with temperatures experienced being above those of 2009 and 2011.
Soil characteristics at the localities were variable and the N-mineralisation potential in the 0–200 mm soil profile was calculated and found to be on average 56.8, 59.9, 92.0, 93.5 and 111.3 kg N ha-1 for the Langgewens (2009–2011), Roodebloem (2009–2011), Elsenburg (2009–2011), Welgevallen (2010 only) and Altona (2011 only) experimental sites, respectively. The present N-mineralisation potential is acceptable, provided that inorganic N fertiliser was added in production. These mineral-N values were calculated from nitrate and ammonium-N contents as measured at planting and mineralised during the first 40 d after planting, using the indophenol-blue (Keeney and Nelson Citation1982) and salicylic acid methods (Cataldo et al. Citation1975) to give an indication of the potential of the soil to supply N to the crops. Sulphur content of the soil decreased with depth at all localities and was on average below the required critical level of 6 mg S kg-1 required for canola production (Peverill et al. Citation1999) at all localities except for Elsenburg, Langgewens and Welgevallen (). However, soils at Roodebloem had higher values for carbon (2%) than at Altona (1.27%), Welgevallen (1.08%), Elsenburg (0.79%) and Langgewens (0.48%), and hence are likely to have a higher cation exchange capacity (Rowell Citation1994).
Table 1: Soil sulphur content at planting at Altona, Elsenburg, Langgewens, Roodebloem and Welgevallen. Mean values for the 2009–2011 period are presented. Sulphur < 6.0 mg kg-1 is the critical soil nutrient level at which the nutrient became deficient (Canola production manual, undated pamphlet sponsored by PNS and THRIP; Peverill et al. Citation1999)
Experimental design and treatments
The experiments were laid out in a randomised complete block design with a factorial split-plot arrangement. Treatments consisted of three S rates (0, 15 and 30 kg S ha-1) as a main factor and five N rates (0, 30, 60, 90 and 120 kg N ha-1) as a subfactor. All treatments were replicated four times. Nitrogen was applied in the form of limestone ammonium nitrate (LAN) with 28% N, whereas S was applied in the form of gypsum (CaSO4.2H2O) with 16% S. All S treatments were applied at planting whilst N was applied in 30 kg ha-1 splits at planting and after every 30 days after planting (DAP) depending on treatment. At crop maturity, canola crops were harvested with a plot harvester in 5 m × 3 m plots and, after cleaning and weighing, grain yields were converted to kilograms per hectare. The canola grain protein and oil contents were analysed at the Department of Agriculture: Western Cape at Elsenburg using near-infra-red technology.
Data recorded was analysed, using split-plot design analysis of variance (ANOVA) with two factors as main plots and one subplot factor using Statistica 11 (StatSoft, Inc., Tulsa, OK, USA). To find the response of the treatments on different localities, locality was considered as a factor. Considering the fact that different cultivars were planted in the three different seasons and also that three localities were planted for each year (Roodebloem, Elsenburg and Langgewens), whilst Welgevallen and Altona were included in 2010 and 2011, respectively, grain yield data for the three seasons was analysed separately. For grain oil and protein content of canola, growing seasons were used as replications to do the statistical analysis (only Langgewens, Roodebloem and Elsenburg, where data was available for three years). Main and interaction effects were compared using the least significant difference (LSD) test at the 5% level of probability. Any treatment means found to be significantly different were separated using Fischer's protected LSD0.05 and only statistically significant data is presented and discussed (). Means from the Statistica analyses were then subjected to best-fit regression curves plotted with Microsoft Office Excel, using polynomial equations to draw N and S response curves.
Table 2: Summary of results from ANOVA tables on yield data analysis
Results and discussion
Grain yield
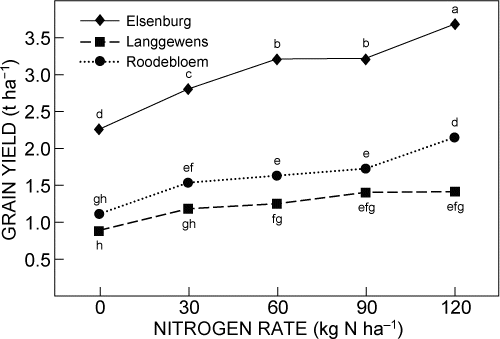
During 2009, grain yield was significantly affected by N application rate, but responses differed between localities (). Without any N fertiliser applied (N0), mean grain yield at Elsenburg (2 260 kg ha-1) were significantly higher compared to Roodebloem (1 123 kg ha-1) and Langgewens (890 kg ha-1). The highest canola yields of 3 683 kg ha-1 at Elsenburg and 1 631 kg ha-1 at Roodebloem were measured with the fertilisation rate of 120 kg N ha-1. However, yields at Langgewens (1 228 kg ha-1) did not increase significantly when more than 30 kg N ha-1 was applied (). This difference in response at different localities is most probably due to differences in soil moisture (rainfall during the grain-filling period) and to a lesser extent differences in soil N content, because moisture availability greatly affects the yield response of canola to N fertilisation (Jackson Citation2000; Al-Barrak Citation2006).
In 2009, Elsenburg received significantly more rain that was evenly distributed throughout the canola growing season compared with Langgewens where very low rainfall was experienced during the flowering and pod-filling stages (August, September and October) (). Roodebloem also experienced low rainfall during August and September, but because of the later planting date yields probably benefit from the high rainfall during October. These results supported that of earlier studies (Mendham and Salisbury Citation1995; Champolivier and Merrien Citation1996), which found that most of the yield components were highly affected by water shortage occurring from flowering to the end of the seed setting stage.
Grain yield also differed significantly due to S application rates at all localities because of the generally low S contents (<6 mg kg-1 soil) of the soil. In the 2009 season, the highest S application rate of 30 kg ha-1 produced a mean yield of 2 115 kg ha-1 compared to 1 805 kg ha-1 when no S was applied. However, as shown in , application of S beyond 15 kg ha-1 did not increase yield significantly at any of the localities except for Langgewens. Jackson (Citation2000) reported similar findings of increasing grain yields with addition of S, and recommended that optimum seed yield occurred at 20 kg S ha-1 in the western USA.
Table 3: Canola yields (kg ha-1) harvested at Langgewens, Roodebloem, Elsenburg, Welgevallen and Altona localities at sulphur fertilisation rates (0, 15 and 30 kg ha–1) in 2009, 2010 and 2011 season. Means for each season with at least one common superscript letter are not significantly different (LSD0.05). (–) Denotes location not used in that year
In 2010, grain yield was significantly affected by N and S applications and differed between localities due to a significant locality × N × S interaction. This significant interaction generally showed that yields tended to increase with an increase in application rate of N and S differently between localities (). If no S was applied, yields tended to level off or even decrease (Elsenburg) at N application rates of 60 and 90 kg N ha-1. At sulphur rates of 15 and 30 kg S ha-1, yields tended to level off with increasing N rates beyond 60 kg N ha-1 at Welgevallen only. With S rates of 15 kg S ha-1, yields at Elsenburg did not level off with even the highest N rates of 120 kg N ha-1, while at S rates of 30 kg S ha-1, yields at Langgewens did not level off at the highest N rate. These results clearly indicated that S requirements differed between localities tested due to soil and climatic differences in this year. There was, however, no L × N × S interactions in the other two years.
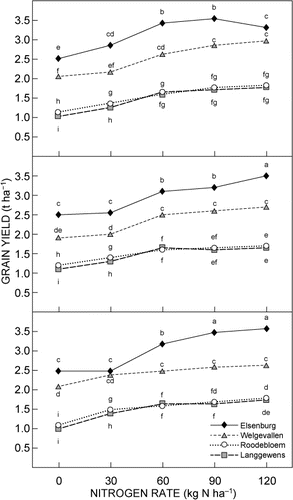
In 2011 grain yield differed between Altona, Langgewens, Elsenburg and Roodebloem, with significant responses to N and S application rates as well as significant L × S and N × S interactions. Grain yields showed a significant L × S interaction in 2011 because, in contrast to the other localities, yields at Roodebloem did not increase with an increase in S rate from 15 to 30 kg S ha-1 (). On average, grain yields were, however, significantly higher at Roodebloem (2 827 kg ha-1) compared to Altona (2 634 kg ha-1), Elsenburg (1 368 kg ha-1) and Langgewens (1 152 kg ha-1) during 2011. Significantly lower yields observed at Elsenburg in 2011 likely resulted from a combination of high rainfall during planting, which reduced the plant population, and lower rainfall received in July reducing the ability of the crop to compensate (Angadi et al. Citation2003) for the reduced population. At Langgewens sensitivity to water stress of canola during the flowering, pod-setting and grain-filling stages (Mendham and Salisbury Citation1995; Bagheri and Shahzad Citation2011) was clearly illustrated by lower grain yields obtained in all the seasons (), as this locality showed generally low rainfall from July to October in all seasons.
The significant N × S interaction in 2011 showed that in treatments where no S and N were added, yields increased from 1 575 kg ha-1 to a maximum of 1 878 kg ha-1 at 120 kg N ha-1, but yield increases with applications of more than 30 kg N ha-1 were not statistically significant (). When S rates of 15 kg S ha-1 and 30 kg S ha-1 were applied, grain yields were significantly increased with increasing N applications to reach yields of 2 310 kg ha-1 and 2 563 kg ha-1, respectively, when 120 kg N ha-1 was applied. This indicated that N applications >120 kg N ha-1 may be needed at high yielding (rainfall) localities.
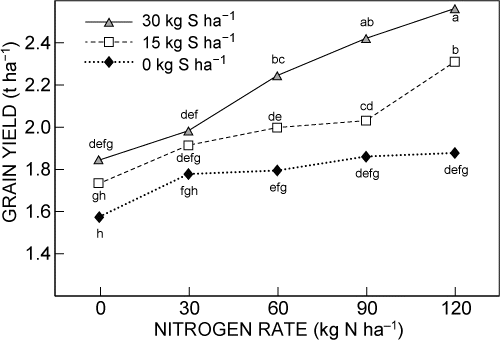
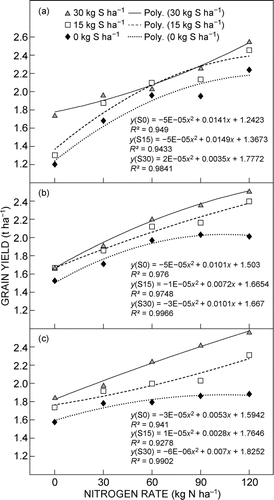
From the results it became clear that the grain yield responses to N were affected by S application rates. For this reason regression analyses were used to developed N × S response curves for each year. The regression curves () showed that, although N fertilisation increased canola grain yield at all S levels, the yields at 0 kg S ha-1 tend to level off at lower N rates. In all years best fits with R2 > 0.99 were obtained with S rates of 30 kg N ha-1. This clearly illustrates the importance of S applications to achieve maximum yield response to N applications.
Grain oil and protein content
Grain oil and protein content differed significantly between localities with canola grain at Roodebloem (41.4%) having significantly higher oil contents than at Elsenburg (39.2%) and Langgewens (36.5%) localities (). A significant negative correlation (R2 = 0.958) between the oil and protein content shows an inverse relationship such that increase in protein content lowers the oil content of the crop (Ahmad et al. Citation2007; Hassan et al. Citation2007).
Table 4: Effect of S-fertiliser rates on grain oil content (%) of canola grown at different localities. Mean values for the 2009–2011 period are presented. Means with at least one common superscript letter are not significantly different (LSD0.05)
Oil content was slightly increased at all localities as a result of applications of 30 kg S ha-1, but such increase was only significant at Langgewens (36.2% to 36.7%) and not at Roodebloem (41.3% to 41.5%) and Elsenburg (39.1% to 39.3%) (). However, without any S applied, canola oil content at Roodebloem (41.3%) was even higher than with 30 kg S ha-1 application rates at Langgewens (36.7%) and Elsenburg (39.3%). Sulphur application had no significant effect on the protein content at any of the three localities evaluated.
High N application rates lowered the oil content whilst increasing the protein content of canola grains (). Such effects of N on oil content were, however, highly dependent on locality such that application of 120 kg N ha-1 resulted in decreasing canola grain oil content from 40.9% where no N was applied to 36.7% at Elsenburg. At the same locality, increasing N application rates resulted in an increase in protein content from 20.5% where no N was applied to 23.7% at an application rate of 120 kg N ha-1 (). However, even though similar increases in protein and decreases in oil content with N fertilisation were shown at the other two localities (Langgewens and Roodebloem), these changes were not significant. This L × N interaction can therefore mainly be ascribed to the inherently different levels of N in the soil and effects of climatic conditions (especially soil moisture) on nutrient uptake and overall partitioning (Hocking et al. Citation1997; Jackson Citation2000; Malhi et al. Citation2007).
Table 5: Effect of N fertiliser rates on grain oil content (%) and grain protein content (%) of canola grown at different localities (Mean values for 2009–2011 period. From the table, oil and protein means with at least a common letter are not significantly different, LSD0.05)
Conclusions
The effect of N application on canola grain yields increased with availability of S and was greater in high rainfall localities. To obtain maximum responses to N applications, S applications of 15–30 kg ha-1 may be needed on some localities if S content of the soil is <6 mg kg-1. The N:S ratios that fall within 1:4 to 1:8 gave higher yields depending on inherent nutrient content and availability of moisture. It will, however, be worthy to investigate whether applications of >120 kg N ha-1 will increase profit margins. Sulphur rates of 15–30 kg ha-1 may also improve the canola grain oil content.
Acknowledgements
The authors are grateful to the Protein Research Foundation for financial support.
References
- Abdallah M, Dubousset L, Meuriot F, Etienne P, Avice JC, Ourry A. 2010. Effect of mineral sulphur availability on nitrogen and sulphur uptake and remobilization during the vegetative growth of Brassica napus L. Journal of Experimental Botany 61: 2635–2646.
- Ahmad G, Jan A, Arif M, Jan MT, Khattak RA. 2007. Influence of nitrogen and sulfur fertilization on quality of canola (Brassica napus L.) under rainfed conditions. Journal of Zhejiang University Science B 8: 731–737.
- Al-Barrak KM. 2006. Irrigation interval and nitrogen level effects on growth and yield of canola (Brassica napus L.). Scientific Journal of King Faisal University 7: 87–103.
- Angadi SV, Cutforth HW, McConkry BG, Gan Y. 2003. Yield adjustment by canola in different plant populations under semi-arid conditions. Crop Science 43: 1358–1366.
- Bagheri H, Shahzad J. 2011. Study of drought stress on agronomic traits of winter canola (Brassica napus L.). Scientific Research and Essays 25: 5285–5289.
- Balint T, Rengel Z, Allen D. 2008. Australia canola germplasm differs in nitrogen and sulphur efficiency. Australian Journal of Agriculture Research 59: 167–174.
- Breennon RF, Bolland MDA. 2008. Significant nitrogen by sulphur interactions occurred for canola grain production and oil concentration in grain on sandy soils in the Mediterranean-type climate of South-western Australia. Journal of Plant Nutrition 31: 1174–1187.
- Cataldo DA, Haroon H, Schrader LE, Young VL. 1975. Rapid colorometric determination of nitrate in plant tissue by nitrate of salicylic acid. Communications in Soil Science and Plant Analysis 6: 71–80.
- Champolivier L, Merrien M. 1996. Effects of water stress applied at different stages to Brassica napus L. var. oleifera on yield, yield components and seed quality. European Journal of Agronomy 5: 153–160.
- DAFF (Department of Agriculture, Forestry and Fisheries). 2012. Monthly Food Security Bulletin of South Africa: January 2012. Available at http://www.nda.agric.za/docs/Cropsestimates/RSA%20Food%20Security%20Bulletin%20JAN%202012.pdf [accessed 26 March 2012].
- Daku L, Peshin R, Norton GW, Taylor DB. 2012. Economic impact of oilseed IPM programs. In: Gupta SK (eds), Technological innovation in major world oil crops, vol. 2: Perspectives. Springer: New York. pp 175–208.
- Gan Y, Malhi SS, Brandt S, Katepa-Mupondwa F, Stevenson C. 2008. Nitrogen use efficiency and nitrogen uptake of juncea canola under diverse environments. Agronomy Journal 100: 285–295.
- Hardy MB, Hanekom D, Langenhoven W. 2004. Yield and quality of canola as affected by cultivar and nitrogen content. Canolafokus no. 24.
- Hassan FU, Abdul M, Ghulam Q, Basra SMA. 2007. Effects of sulphur on seed yield, oil, protein and glucosinolates of canola cultivars. International Journal of Agriculture and Biology 9: 504–508.
- Hocking PJ, Randall PJ, Demarco D. 1997. The response of dry land canola to nitrogen fertiliser: partitioning and mobilization of dry matter and nitrogen, and nitrogen effects on yield components. Field Crops Research 54: 201–220.
- Jackson GD. 2000. Effects of nitrogen and sulphur on canola yield and nutrient uptake. Agronomy Journal 92: 44–49.
- Jan A, Ahmad G, Arif M, Jan MT, Khan BM. 2010. Quality parameters of canola as affected by nitrogen and sulphur fertilisation. Journal of Plant Nutrition 33: 381–390.
- Jan A, Khan N, Khan IA, Khattak B. 2002. Chemical composition of canola as affected by nitrogen and sulphur. Asian Journal of Plant Science 1: 519–521.
- Janzen HH, Bettany JR. 1984. Sulfur nutrition of rapeseed. 1. Influence of fertiliser nitrogen and sulfur rates. Soil Science Society of America Journal 48: 100–107.
- Keeney DR, Nelson DW. 1982. Nitrogen: inorganic forms. In: Page AL, Miller RH, Keeney DR (eds), Methods of soil analysis. Part 2: Chemical and microbiological properties (2nd edn). Madison: American Society of Agronomy. pp 643–698.
- Malhi SS, Gan Y, Raney JP. 2007. Yield, seed quality, and sulphur uptake of Brassica oilseed crops in response to sulphur fertilisation. Agronomy Journal 99: 570–577.
- McGrath SP, Zhao FJ. 1996. Sulphur uptake, yield responses and the interactions between nitrogen and sulphur in winter oilseed rape (Brassica napus). Journal of Agricultural Science 126: 53–62.
- Mendham NJ, Salisbury PA. 1995. Physiology, crop development, growth and yield. In: Kimber DS, McGregor DI (eds), Brassica oilseeds: production and utilization. Wallingford: CAB International. pp 11–64.
- Ngezimana W, Agenbag GA. 2013. Effects of nitrogen and sulphur on canola (Brassica napus L.) vegetative and reproductive growth under controlled conditions. African Journal of Agricultural Research 8: 4887–4894.
- Oplinger ES, Hardman LL, Gritton ET, Doll JD, Kelling KA. 2000. Canola (rapeseed). Alternative Field Crops Manual. Madison: University of Wisconsin-Extension, Cooperative Extension; St Paul: University of Minnesota, Center for Alternative Plants and Animal Products and the Minnesota Extension Service.
- Peverill KI, Sparrow LA, Reuter DJ. 1999. Soil analysis: an interpretation manual. Collingwood: CSIRO Publishing.
- Rayner PL. 2002. Canola: an emerging oilseed crop. In: Janick J, Whipkey A (eds), Trends in new crops and new uses. Alexandria, Virginia: ASH Press. pp 122–126.
- Rowell DL. 1994. Soil science: methods and applications. Harlow: Longman Scientific and Technical.
- Svečnjak Z, Rengel Z. 2006. Canola cultivars differ in nitrogen utilization efficiency at vegetative stage. Field Crops Research 97: 221–226.