
Abstract
Diverse landraces of sorghum (Sorghum bicolor (L.) Moench) are widely grown by smallholder farmers in South Africa. The objective of the study was to assess the genetic diversity present in South African sorghum genotypes using genetic distances as measured by simple sequence repeat (SSR) markers. In total 103 diverse landraces and breeding lines were genotyped using 30 SSR primers. A wide genetic diversity was observed with the allele sizes ranging from 90 to 294 bp. The numbers of alleles ranged from 2 to 15 with an average of 6.4 per locus. The polymorphic information content ranged from 0.0192 to 0.8351 (average 0.5031) with heterozygosity values of 0.0194 to 0.8524 (average 0.5483). The Euclidian genetic distances varied from 0 to 8.4 (average 5.7). Genotypes Macia-SA and AS4 had the lowest dissimilarity index, whereas 05-POTCH-115 and MP2048 exhibited the highest value. The study established the existence of considerable genetic diversity among South African sorghum germplasm. This may enable breeders to exploit the potential of transgressive segregation and for strategic genetic conservation.
Introduction
Genetic diversity analysis of sorghum (Sorghum bicolor (L.) Moench; 2n = 2x = 20) germplasm is fundamental for breeding and conservation strategies. Genetic advancement during selection depends on the availability of genotypes possessing favourable alleles for desired traits, which relies on the available genetic diversity. Genetic diversity analysis can be carried out using phenotypic or molecular markers. DNA-based molecular markers are more efficient to analyse a greater number of genotypes (Reif et al. Citation2003). Furthermore, molecular markers detect the presence of favourable alleles among germplasm and allow estimation of genetic diversity more reliably and efficiently than phenotypic markers, which are subject to genotype by environment interaction. Summarily, the molecular marker technology aids conventional breeding in various aspects, such as to (1) assess of genetic diversity and establish heterotic patterns, (2) screen for useful genes, (3) accelerate backcross breeding programs via selection of gene(s) of interest and (4) identify and protect commercial cultivars through fingerprinting (Xiao et al. Citation1996).
Several DNA-based marker systems have been successfully used to assess genetic diversity in sorghum (Ng'uni et al. Citation2011). Simple sequence repeats (SSRs) are reportedly the marker of choice for diversity analysis because of their ability to produce informative multiallelic loci and greater genotypic differentiations. SSRs are highly polymorphic (Anas and Yoshida Citation2004) and provide wider genome coverage than amplified fragment length polymorphism (AFLP), restriction fragment length polymorphism (RFLP) and random amplified polymorphic DNA (RAPD) markers. Moreover, compared to single nucleotide polymorphisms (SNPs), SSR markers with moderate density are more informative than SNPs for assessment of genetic diversity in crops (Yang et al. Citation2011).
The sorghum genome sequence project identified 71 000 SSRs in the genome (Paterson et al. Citation2009). The availability of this large number of SSR markers provides a more cost-effective and rapid method for DNA profiling (Smith et al. Citation1997).
Sorghum is one of the most important crops worldwide after wheat, rice, maize and barley, providing food, fodder and bioenergy feedstock (FAO Citation2006). In sub-Saharan Africa sorghum ranks second after maize for preference and importance, and it remains a critical food security crop for the livelihoods of more than 100 million people. Sorghum grows in low-rainfall, arid to semi-arid environments considered to be marginal for other cereal crops such as maize and wheat. It has exceptional tolerance to drought, high temperature stresses and low soil fertility, making it the crop of choice by millions of farmers in marginal agroecologies.
In South Africa sorghum is grown by both small- and large-scale commercial farmers. Furthermore, sorghum has increasingly become a foundation crop in the food and beverage industries (Wenzel et al. Citation2001; Taylor Citation2003). Several landraces of sorghum are widely grown by small-scale farmers across different provinces in the country. Despite low yielding potential, the landraces are preferred by the smallholder farmers because of broad adaptation, tolerance to abiotic and biotic stresses, and suitable quality and agronomic attributes (DAFF Citation2010). In South Africa both wild and domesticated sorghum species and their hybrids are present. Mann et al. (Citation1983) reported that the South African sorghum race ‘Kafir’ might have arisen from introgression between domesticated and wild sorghum. Sorghum productivity in small-scale producing regions of South Africa could be enhanced through effective breeding using locally adapted and well-characterised germplasm.
Previous genetic diversity studies using SSR or RAPD markers from eastern and southern Africa (Nkongolo and Nsapato Citation2003) demonstrated the prevalence of wide genetic variation in sorghum collections. Uptmoor et al. (Citation2003) indicated the existence of high genetic diversity among South African sorghum accessions. The authors used 46 sorghum accessions and subjected them to SSR, RAPD and AFLP markers. Of the accessions 23 were landrace collections from four Southern Africa Development Cooperation countries, namely Botswana, Lesotho, Malawi and South Africa. Only five of the landraces were sampled from South Africa, each representing the North West, Mpumalanga, Gauteng, KwaZulu-Natal or Limpopo provinces. The remaining 23 accessions in the study were modern breeding lines acquired from Lesotho, Zimbabwe, Zambia, South Africa and International Crops Research Institute for the Semi-Arid Tropics (ICRISAT). The previous reports did not fully cover the landraces collected from various provinces in South Africa. An exhaustive assessment of the genetic diversity present in the South African sorghum germplasm is required using a relatively greater number of samples, representing the diverse sorghum growing provinces with a suitable and sufficient number of SSR markers. This may provide adequate information on the genetic relationship among the sorghum germplasm originating from South Africa for effective use of the national sorghum genetic resources and future conservation strategies. Thus, the objective of the study was to assess the genetic diversity present among 103 South African sorghum genotypes using genetic distances as measured by 30 SSR markers.
Materials and methods
Plant materials and study sites
The study used 103 sorghum genotypes obtained from the Department of Agriculture, Forestry and Fisheries (DAFF), the African Centre for Crop Improvement (ACCI) and Agricultural Research Council–Grain Crops Institute (ARC-GCI) in South Africa (). Sixty-nine genotypes from the DAFF were landraces collected from North West, Eastern Cape, Mpumalanga, Limpopo, KwaZulu-Natal and Free State provinces in South Africa. The landraces were selected on the basis of their morphological distinctiveness and homogeneity when evaluated for two cycles of selections. Twelve genotypes were breeding lines obtained from the ARC-GCI and 22 were from the ACCI. For DNA sampling, the genotypes were planted in the field in an alpha lattice design replicated twice at Ukulinga (29°37′ S, 30°22′ E), the Research Farm of the University of KwaZulu-Natal. Recommended cultural practices were followed to grow healthy and vigorous sorghum plants.
Table 1: List of sorghum genotypes used in the study
DNA extraction, purification and quantification
Young fresh leaves were harvested from 10 plants of each genotype four weeks after planting. The leaf samples were bulked per genotype and placed in a 1.5 ml eppendorf tube containing silica gel (Rogstad Citation2003). Samples were sent to the Biosciences eastern and central Africa - International Livestock Research Institute (BecA-ILRI), Kenya for SSR analysis. Accordingly, the DNA was extracted using a solvent extraction method and the quality of the extracted DNA was evaluated on a 1% agarose gel.
PCR and SSR analyses
PCR reactions were performed using a GeneAmp PCR system 9700 thermal cycler (Applied Biosystems, Foster City, CA, USA). The DNA concentrations of sorghum samples were diluted to a final concentration of 50 ng µl−1 TE buffer. Thirty SSR primers provided by the Generation Challenge Program-Genotyping Support Service were used for analysis of reactions (). The markers used in this study were selected from the SSR diversity kit (http://sat.cirad.fr/sat/sorghum_SSR_kit) from all the linkage groups of sorghum (). Genotyping was conducted at BecA-ILRI/Kenya using an ABI-3730 genetic analyser (Applied Biosystems).
Table 2: Descriptions of the 30 SSR markers used in the study. Chr. = Chromosome
Data analysis
Data were captured using the Genscan® software (Applied Biosystems) and the resulting fragments were analysed and the alleles scored using the GeneMapper® version 4.1 software (Applied Biosystems). PCR was done for all of the 30 primers (). A dissimilarity matrix was generated using DARwin 5.0 software (Perrier and Jacquemoud-Collet Citation2006). The data matrices of the genetic distances were used to create the dendrogram using the unweighted pair group method with arithmetic mean (UPGMA) algorithm. The assay efficiency index referred to as the polymorphic information content (PIC) was calculated using the formula PIC = 1 - Σfi, where fi is the frequency of the ith allele (Smith et al. Citation1997).
Results and discussion
Polymorphism and allelic diversity of SSR markers
The number of alleles and size ranges, heterozygosity and PIC values are summarised in . The SSR markers generated a total of 306 putative alleles (different fragment sizes) among the 103 sorghum genotypes. Most of the markers generated 2–7 alleles but nine markers generated 9–15 alleles each. In the current study, the average number of alleles was 6.4 per locus, which was similar to 6.5 alleles per locus reported by Reddy et al. (Citation2010) but higher than 4.9 alleles per locus reported by Pei et al. (Citation2010). In sorghum genetic diversity studies a greater number of alleles (27) were reported by Muraya et al. (Citation2011) and 7.6 by Wang et al. (Citation2009). Greater number of alleles generated by SSR markers suggests allelic richness, a useful indicator of genetic worthiness for subsequent selection and conservation strategies.
Table 3: Genetic information generated by 30 SSR markers on 103 sorghum genotypes. PIC = Polymorphic information content
The current analysis found heterozygosity values ranging from 0.02 to 0.85 with an average of 0.55. Marker Xisep0310 had the lowest, and Xtxp320 the highest, range of heterozygosity. The average heterozygosity observed in this study was fairly similar to that previously reported by Uptmoor et al. (Citation2003) at 0.60 in South Africa, who used 25 SSR markers and compared 46 sorghum accessions of diverse geographical collections. Low levels of heterozygosity (0.04) were recorded among Zambian sorghum genotypes (Ng'uni et al. Citation2011) and a comparatively high value (0.8) was reported by Thudi and Fakrudin (Citation2011) among rabi sorghum genotypes. The higher level of allelic diversity of SSR loci found in this study was probably associated with the wide range of genetic diversity represented in the germplasm of South African sorghum tested. Increased levels of heterozygosity indicate significantly greater proportion of genetic diversity, which will enhance selection response in breeding programs. The high level of heterozygosity observed among genotypes signified the fact that genotypes used in this study were collected from a wide range of geographic areas with different levels of selection pressure. Increased allelic number in the present study is probably attributed to significant genetic variation among the sampled sorghum gene pool. Farmers maintain a large number of landraces on a single plot to cope with the diverse environmental conditions, resulting in a continuous exchange of genes through pollen flow (Manzelli et al. Citation2007; Barnaud et al. Citation2008). In addition, farmers exchange seeds through gifts and via markets to renew old seed stocks or to acquire new varieties. Consequently, there may be a continuous exchange of genes among genotypes.
The SSR markers revealed marked genetic diversity among the sorghum genotypes. The PIC values ranged from 0.02 for the marker Xisep0310 to 0.84 for Xtxp320 with an average of 0.50. These estimates were fairly similar to the mean PIC ranges obtained in other sorghum genetic diversity studies by Ali et al. (Citation2008) and Geleta et al. (Citation2006). In sorghum genetic diversity studies, Thudi and Fakrudin (Citation2011) reported a greater mean PIC value than the present estimates. Assar et al. (Citation2005) found PIC values ranging from 0.46 to 0.87 among sorghum genotypes evaluated using 16 SSR markers. High PIC values suggest their informative potential to detect differences among the sorghum lines.
Genetic distance and dissimilarity analysis
The Euclidean dissimilarity matrix estimates as measures of genetic distances ranged from 0 to 8.4 with an average value of 5.7 (data not shown). This shows a wide diversity among the sorghum genotypes investigated. Among the 103 genotypes studied, SA-72 and AR-10 had the lowest dissimilarity index (0.0), whereas AR-4 and SA-35 exhibited the highest dissimilarity (8.4). SA-55 (AS66), SA-72 (Macia-SA) and SA-73 (M15) were distantly related to most genotypes tested. AS-66 was sourced from ACCI and the other two are breeding lines from the ARC-GCI. Among the landraces, SA-28, SA-42 and SA-59 were the most dissimilar among the tested genotypes. These landraces were sourced from Mpumalanga, Limpopo and KwaZulu-Natal provinces, respectively. The breeding lines, such as AR-2, AR-3, AR-4, AC-1, AC-6, AC-18 and SA-73, displayed high genetic dissimilarity in spite of continued selection of such genotypes that would result in narrow genetic diversity and low allelic richness when compared to the tested landraces (data not shown).
Reddy et al. (Citation2010) reported genetic dissimilarity estimates ranging from 0.384 to 0.728 with an average dissimilarity value of 0.54 among 14 sorghum accessions studied. Kumar and Khanna (Citation2009) reported genetic similarity values ranging from 0.261 to 0.762 among 10 diverse cultivated sorghum genotypes. The genetic dissimilarity estimates (genetic distances) assist in selection for parental lines and creation of a segregating population in order to maintain genetic diversity in crop breeding programmes. Genetic distance estimates are useful when assigning genotypes to heterotic groups in hybrid development from different intergroup crosses (Xiao et al. Citation1996). Djè et al. (Citation2000) estimated a wide genetic diversity when analysing 25 sorghum landraces assembled from a limited area of north-western Morocco using SSR markers. SSR markers also revealed wide genetic diversity among sorghum collections in Zambia. The wide genetic diversity is important in breeding programmes for selections and inclusion of landraces/genotypes with genes of novelty (Ng'uni et al. Citation2011).
Cluster analysis
The Euclidean dissimilarity matrix was used to cluster genotypes using the UPGMA algorithm. The resulting dendrogram revealed two major distinct clusters of sorghum genotypes: cluster I with 0.25 and cluster II with 0.48 Euclidian distances (). Cluster I comprised 35 genotypes that formed subgroups Ia and Ib. The genotypes were breeding lines obtained from the ARC-GCI and ACCI except for SA-61, SA-57, SA-37, SA-13 and SA-5. Genotypes in subgroup Ia (SA-61 and AC-9) were distantly related. In subgroup Ib genotypes SA-72 and AR-10 were closely related, whereas AC-12 and AC-16 were distinct from the remainder of the genotypes.
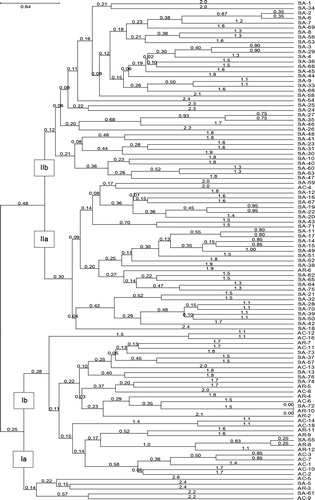
Cluster II was composed of two subgroups (IIa and IIb), which consisted of 68 sorghum genotypes, mainly landrace collections, from the DAFF and five breeding lines. Among the breeding lines, four lines (AR-6, SA-70, SA-71 and SA-75) from the ARC-GCI and AC-4 from the ACCI were grouped in this cluster. The subgroup IIa consisted of 31 genotypes and subgroup IIb of 37 genotypes. In the latter subgroup, the genotypes SA-47, SA-63, SA-60, SA-40, SA-10, SA-30, SA-31, SA-23, SA-41 and SA-48 were distantly related to the other genotypes. Interestingly, the genotypes in cluster II subgroup IIa were closely related with the widely cultivated South African landraces AR-6 (Manthate), SA-70 (Motlerane), SA-71 (Mammopane) and SA-75 (Maseka-a-swere) sourced from the ARC-GCI. This may suggest that the genotypes are genetically related as in the other four widely cultivated landraces obtained from the ARC-GCI. Farmers practice mass selections, i.e. healthy and large panicles are selected based on appearance, not considering the genetic purity every year, and this seed is used in the following planting season. According to Harlan (Citation1975), such practices exert a particular balance of selection pressure and allow for genetic variability within populations.
In general, the genotypes used in the study did not appear in the same cluster based on the source or area of collection. This suggests wide genetic variation among the germplasm. According to Barnaud et al. (Citation2008) farmers’ practices and historical factors affect patterns of genetic diversity. Despite the gene flow, farmers’ practices are key to maintenance of genetic diversity of landraces with related agronomic traits and agroecologies. For instance, Tukeswa et al. (Citation2000) reported specific selection pressure towards the brewing trait in sorghum selected by farmers. Similar results were reported in Somalia where farmers selected and preserved landraces on the basis of the phenotypic and agronomic traits (Manzelli et al. Citation2007). Ganesamurthy et al. (Citation2010) reported absence of relationship between the geographic and the genetic diversity, and concluded that the geographic location could not be used as a diversity index for selection.
Ng'uni et al. (Citation2011) reported that some of the sorghum genotypes from the same area of collection were grouped in different clusters, although most of them were grouped according to the area of collection. Several studies were conducted based on geographical location, either at country, regional, or agroclimatic level (Nkongolo and Nsapato Citation2003). The results of the present study concur with the report by Uptmoor et al. (Citation2003) who also found the clustering of genotypes studied did not agree based on the diverse origins of the sorghum genotypes. Breeders use different methods in selecting the best parents for making crosses and for assigning lines to a particular genetic group. These methods include (1) phenotypic performance for specific traits, (2) pedigree relationships, (3) adaptability and yield stability, (4) top crosses and (5) diallel crosses. Genetic distance estimates from molecular markers have been reported as very useful tools in selecting the best parent combination for new pedigree and for assigning lines into genetic groups (Reif et al. Citation2003; Ali et al Citation2008; Paterson et al. Citation2009). With complementary phenotypic traits, the genotypes showing distant genetic relationship across clusters and subclusters should be strategically selected as parental lines for subsequent crosses for genetic recombination and to improve genetic advancement in sorghum breeding programs. An understanding of genetic diversity among inbred lines can be particularly useful in planning crosses, in assigning lines to specific heterotic groups and for precise identification of plant material for strategic conservation (Deu et al. Citation2006; Geleta et al. Citation2006; Perumal et al. Citation2007).
The SSR markers used in this study were sampled from 10 different linkage groups of the sorghum genome (Dean et al. Citation1999), which collectively had moderate to high PIC values that provided information to uniquely identify most of the genotypes profiled in this study. All 30 SSR markers were polymorphic, confirming that each marker would be effective and valuable for genetic analysis. The degree of precision of molecular markers in estimating genetic relatedness between genotypes is strongly dependent on the type and number of markers that are used and their genome coverage (Menz et al. Citation2004; Geleta et al. Citation2006; Perumal et al. Citation2007). The use of SSRs for the analysis of population genetics and genetic diversity in sorghum could reduce the limitations in identifying polymorphisms and result in more complete genomic coverage (Perumal et al. Citation2007).
Given the high level of gene flow among genotypes and high level of variation, farmers’ traditional agricultural production system has played a vital role in maintaining and directing genetic diversity and evolution. Case et al. (Citation2005) studied genetic diversity analysis of sorghum using 98 SSR markers and found that local landraces captured 86% of the total variation found in wild species. Similarly, Deu et al. (Citation2006) pointed out the role of farmers in the management and preservation of genetic diversity over time. The high genetic variability among landraces provide enough genetic plasticity to adapt to the diverse environmental conditions in the tropical areas (Manzelli et al. Citation2007), and allow circumvention of crop failure by reducing vulnerability to environmental stresses.
Conclusions
The study examined the genetic diversity present in 103 sorghum genotypes collected from six administrative provinces and two breeding programs in South Africa using 30 polymorphic SSR markers. The SSR markers revealed wide genetic diversity among the sorghum genotypes studied. The analyses formed two major distinct clusters without allocating genotypes based on the source or origin. The results showed clear separation between the breeding lines and landrace collections from diverse provinces in South Africa. Further subgrouping showed close genetic relationship of genotypes SA-12, SA-16, SA-19, SA-20, SA-21, SA-22, SA-32, SA-38, SA-39, SA-43, SA-50, SA-51, SA-52, SA-62, SA-64, SA-65, SA-67 and AC-4 with the widely cultivated landraces Motlerane, Manthate, Maseka-a-swere and Mammopane in South Africa. The distantly related sorghum genotypes, such as SA-23, SA-28, SA-42, SA-44, SA-57 and SA-59, can be useful in introducing genes of novelty into sorghum breeding programmes. Given that the collection provinces are diverse with heterogeneous agroecologies, the selected lines with high genetic diversity could serve as important sources of novel alleles for breeding and genetic conservation. Furthermore, phenotypic evaluations are needed to select suitable agronomic traits associated with the genetic markers for breeding and conservation strategies.
Acknowledgements
The Generation Challenge Programme is sincerely thanked for financial support for the SSR analysis of the study. Incotec (Pty) Ltd is also appreciated for data analysis. The anonymous reviewers are acknowledged for insightful comments and suggestions.
References
- Ali ML, Rajewski JF, Baenziger PS, Gill KS, Eskridge KM, Dweikat L. 2008. Assessment of genetic diversity and relationship among a collection of US sweet sorghum germplasm by SSR markers. Molecular Breeding 21: 497–509.
- Anas T, Yoshida T. 2004. Genetic diversity among Japanese cultivated sorghum assessed with simple sequence repeat markers. Plant Production Science 7: 217–223.
- Assar AHA, Uptmoor R, Abdelmula AA, Salih M, Ordon F, Friedt W. 2005. Genetic variation in sorghum germplasm from Sudan, ICRISAT, and USA assessment by simple sequence repeats (SSRs). Crop Science 45: 1636–1644.
- Barnaud A, Trigueros G, McKey D, Joly HI. 2008. High outcrossing rates in fields with mixed sorghum landraces: how are landraces maintained? Heredity 101: 445–452.
- Case AM, Mitchell SE, Hamblin MT, Sun H, Bowers JE, Aquadro PCF, Kresovich S. 2005. Diversity and selection in sorghum: simultaneous analysis using simple sequence repeats. Theoretical and Applied Genetics 111: 23–30.
- DAFF (Department of Agriculture, Forestry and Fisheries). 2010. Sorghum production guidelines. Pretoria: DAFF.
- Dean RE, Dahlberg JA, Hopkins MS, Mitchell SE, Kresovich S. 1999. Genetic redundancy and diversity among ‘orange’ accessions in the U.S. national sorghum collection as assessed with simple sequence repeat (SSR) markers. Crop Science 39: 1215–1221.
- Deu M, Rattunde F, Chantereau J. 2006. A global view of genetic diversity in cultivated sorghums using a core collection. Genome 49: 168–180.
- Djè Y, Heuertz M, Lefèbvre C, Vekemans X. 2000. Assessment of genetic diversity within and among germplasm accessions in cultivated sorghum using microsatellite markers. Theoretical and Applied Genetics 100: 918–925.
- FAO (Food and Agriculture Organization of the United Nations) 2006. World agriculture: towards 2030/2050. Interim Report. Rome: Global Perspective Studies Unit, FAO.
- Ganesamurthy K, Punitha D, Elangovan M. 2010. Genetic diversity among the land races of sorghum collected in Tamil Nadu. Electronic Journal of Plant Breeding 1: 1375–1379.
- Geleta N, Labuschagne MT, Viljoen CD. 2006. Genetic diversity analysis in sorghum germplasm as estimated by AFLP, SSR and morpho-agronomical markers. Biodiversity and Conservation 15: 3251–3265.
- Harlan JR. 1975. Crops and man. Madison: American Society of Agronomy and Crop Science Society of America.
- Kumar P, Khanna VK. 2009. Assessment of genetic diversity in cultivated sorghum (Sorghum bicolor L. Moench) accesions using microsattelite markers. Pantnagar Journal of Research 7: 143–149.
- Mann JA, Kimber CT, Miller FR. 1983. The origin and early cultivation of sorghums in Africa. Bulletin 1454. College Station: Texas Agricultural Experiment Station, Texas A&M University System.
- Manzelli M, Pileri L, Lacerenza N, Bendettelli S, Vecchio V. 2007. Genetic diversity assessment in Somalia sorghum (Sorghum bicolor (L.) Moench) accessions using microsatellite markers. Biodiversity Conservation 16: 1715–1730.
- Menz M, Klein R, Unruh N, Rooney W, Klein P, Mullet J. 2004. Genetic diversity of public inbreds of sorghum determined by mapped AFLP and SSR markers. Crop Science 4: 1236–1244.
- Muraya MM, de Villiers S, Parzies HK, Mutegi E, Sagnard F, Kanyenji BM, Kiambi D, Geiger HH. 2011. Genetic structure and diversity of wild sorghum populations (Sorghum spp.) from different eco-geographical regions of Kenya. Theoretical and Applied Genetics 123: 571–583.
- Ng'uni D, Geleta M, Bryngelsson T. 2011. Genetic diversity in sorghum (Sorghum bicolor (L.) Moench) accessions of Zambia as revealed by simple sequence repeats (SSR). Hereditas 148: 52–62.
- Nkongolo KK, Nsapato L. 2003. Genetic diversity in Sorghum bicolor (L.) Moench accessions from different ecogeographical regions in Malawi assessed with RAPDs. Genetic Resources and Crop Evolution 50: 149–156.
- Paterson AH, Bowers JE, Maher CA, Narechania A, Zhang L, Ware D, Messing J, Rokhsar DS. 2009. The Sorghum bicolor genome and the diversification of grasses. Nature 457: 551–556.
- Pei Z, Gao J, Chen Q, Wei J, Li Z, Luo F, Shi L, Ding B, Sun S. 2010. Genetic diversity of elite sweet sorghum genotypes assessed by SSR markers. Biologia Plantarum 54: 653–658.
- Perrier X, Jacquemoud-Collet JP. 2006. DARwin software. Available at http://www.darwin.cirad.fr/darwin.html [accessed 2 August 2014].
- Perumal R, Krishnaramanujam R, Menz MA, Katile S, Dahlberg J, Magill CW, Rooney WL. 2007. Genetic diversity among sorghum races and working groups based on AFLPs and SSRs. Crop Science 47: 1375–1383.
- Reddy SVR, Khanna VK, Pant GB. 2010. Molecular fingerprinting of sorghum (Sorghum bicolor L. Moench) germplasm using simple sequence repeat markers. Pantnagar Journal of Research 8: 180–186.
- Reif JC, Melchinger AE, Xia XC, Warburton ML, Hoisington DA, Vasal SK, Beck D, Bohn M, Frisch M. 2003. Use of SSRs for establishing heterotic groups in subtropical maize. Theoretical and Applied Genetics 107: 947–957.
- Rogstad SH. 2003. Plant DNA extraction using silica. Plant Molecular Biology Reporter 21: 463.
- Smith JSC, Chin ECL, Shu H, Smith OH, Wall SJ, Senior ML, Mitchell SE, Kresovich S, Ziegle J. 1997. An evaluation of the utility of SSR loci as molecular makers in maize (Zea mays L.): comparison with data from RFLPs and pedigree. Theoretical and Applied Genetics 95: 163–173.
- Taylor JRN. 2003. Overview: importance of sorghum in Africa. In: Belton PS, Taylor JRN (eds), Proceedings of the AFRIPRO workshop on the proteins of sorghums and millets: enhancing nutritional and functional properties for Africa, April2–42003, Pretoria, South Africa. Paper 01.
- Thudi M, Fakrudin B. 2011. Identification of unique alleles and assessment of genetic diversity of rabi sorghum accessions using simple sequence repeat markers. Journal of Plant Biochemistry and Biotechnology 20: 74–83.
- Tukeswa AB, Mosha TCE, Laswai HS, Towo EE. 2000. Traditional alcoholic beverages of Tanzania: production, quality and changes in quality attributes during storage. International Journal of Food Science and Nutrition 51: 135–143.
- Uptmoor R, Wenzel W, Friedt W, Donaldson G, Ayisi K, Ordon F. 2003. Comparative analysis on the genetic relatedness of Sorghum bicolor accessions from southern Africa by RAPDs, AFLPs and SSRs. Theoretical and Applied Genetics 106: 1316–1325.
- Wang ML, Zhu C, Barkley NA, Chen Z, Erpelding JE, Murray SC, Tuinstra MR, Tesso T, Pederson GA, Yu J. 2009. Genetic diversity and population structure analysis of accessions in the US historic sweet sorghum collection. Theoretical and Applied Genetics 120: 13–23.
- Wenzel WG, van Loggerenberg M, Ordon F. 2001. Quick screening methods for sorghum quality traits. Journal of Applied Botany 73: 43–45.
- Xiao J, Li J, Yuan L, McCough S, Tanks SR. 1996. Genetic diversity and its relationship to hybrid performance and heterosis as revealed by PCR based markers. Theoretical and Applied Genetics 92: 637–643.
- Yang X, Xu Y, Shah T, Li H, Han Z, Li J, Yan J. 2011. Comparison of SSRs and SNPs in assessment of genetic relatedness in maize. Genetica 139: 1045–1054.