
Abstract
The individual effects of soil properties on soil erodibility are well understood. It is also known that various interactions between these properties exist, which creates the need for unique investigations into how soil properties influence soil stability. Quantile regression was used in this paper to determine which soil properties control gully erosion in a catchment in Lesotho. Samples of typical soil forms found in the catchment were analysed for properties related to soil erosion. Dispersion ratio had the best correlation with areas of severe gully erosion. No strong correlation was found for a single soil property with dispersion ratio. Quantile regression showed that a combination of effective cation exchange capacity (CEC), total carbon, exchangeable sodium percentage (ESP) and free iron influenced soil dispersion. When the aggregating agents (effective CEC, total carbon and free iron) are deficient in the soil sample, very small amounts of a dispersing agent (ESP > 0.67%) will lead to above-average dispersion. Soils with an increased amount of basaltic parent material tended to be more stable.
Introduction
Despite the numerous efforts to control soil erosion in Lesotho, little has been done to gain a local understanding of soil properties and their effects on gully erosion (Showers Citation2005). The effect of soil properties on soil erosion is relatively well understood, and it is also well known that in different situations different soil factors may cancel each other's effect out (Rienks et al. Citation2000). It is therefore necessary to understand the interaction of different soil properties at the location where gullying occurs. A recent geographical study into the factors controlling gully erosion in the catchment investigated in this current paper, found gullying between 1957 and 2004 to be confined to an area with duplex soils, with clear signs of piping present in the area (van Zijl et al. Citation2013). It is therefore expected that soil dispersion plays a role in gully formation within this catchment. This paper aims to determine which soil properties influenced soil dispersion the most within this catchment.
The aggregate stability of a soil determines whether or not it will disperse. A soil with stable aggregates has a low dispersibility, and therefore a low erodibility. Soil properties influencing dispersion are organic carbon (OC) content, ‘free’ iron (Fe) and aluminium (Al) present, the relative ratio of basic cations on the exchange sites, cation exchange capacity (CEC), dominant clay minerals, electrical conductivity (EC) and pH of the soil solution (Amézketa Citation1999; Rienks et al. Citation2000; Laker Citation2004; Bronick and Lal Citation2005; Bühmann et al. Citation2006).
Goldberg et al. (Citation1988) found OC to be negatively correlated with soil dispersion. Heil and Sposito (Citation1993a, Citationb) account this effect to the blocking of positively charged clay mineral edges by negatively charged organic carbon, the complexation of polyvalent cations by organic matter (OM) and overlap of adsorbed organic polymer layers causing steric repulsion.
There is good evidence that Fe and Al have a positive effect on micro-aggregate stabilisation through cationic bridging and formation of organo-metallic compounds and gels (Amézketa Citation1999; Bronick and Lal Citation2005). Therefore it is generally accepted that red soils are more stable than non-red soils (Thompson Citation1986; Smith Citation1990; van der Merwe et al. Citation2001). This is not true for all circumstances, with instances recorded of severely degraded red soils (Laker and Smith Citation2006).
Bivalent cations such as Ca2+ and Mg2+ improve soil structure by forming bridges between clay particles and OM, whereas Na+ is a highly dispersive agent that directly enhances break ups of aggregates (Bronick and Lal Citation2005). The relative amount of Na+ to stabilising cations on the cation exchange positions is expressed as the exchangeable sodium percentage (ESP). An ESP of 15% is used as the critical value above which a Natric horizon is defined in the Soil Taxonomy (Soil Survey Staff Citation1999) and World Reference Base (WRB; IUSS Working Group WRB Citation2007). However, much lower ESP values, such as 2% (Bloem and Laker Citation1994), 2.5% (D'Huyvetter and Laker Citation1985) and even 0.12% (van der Merwe et al. Citation2001) have led to dispersion. Contrary to this, Thompson (Citation1986) studied a highly weathered sesquioxidic soil that could not be dispersed at an ESP of 40%. Levy (Citation1988) categorised three functional soil groups pertaining to their response in changes of ESP, namely soils hardly affected by ESP, soils affected at high ESP levels only and soils affected at all ESP levels.
Despite being a divalent cation, a negative influence on soil structure by magnesium (Mg) has been observed (Sumner Citation1957; Bloem and Laker Citation1994). Under certain conditions this effect seems to be more pronounced (Yadav and Girdhar Citation1981), thus it is not always noticeable. Nel (Citation1989) warns that Mg will have a negative impact on the physical condition of the soil if interlayered silicates or illite is the dominant clay mineral, the exchangeable calcium SOUTH AFRICA (Ca):Mg ratio is low, there are no CaCO3 concretions in the soil, or Fe or OM has the most important influence on the stabilisation of soil aggregates.
Cation exchange capacity and specific surface area are related to stable aggregates (Dimoyiannis et al. Citation1998), when polyvalent cations act as bridges between negatively charged clay particles and organic molecules, thereby reducing the repellent electrostatic forces between them (Bronick and Lal Citation2005).
The susceptibility of a soil to disperse and crust decreases in the order of dominant clay mineral of smectite > illite > kaolinite (Levy Citation1988). Small amounts of smectite in a kaolinite-dominated soil increases dispersion of the soil (Frenkel et al. Citation1978; Stern Citation1990). Amorphous clay minerals, originating from volcanic rocks, are very stable (Bronick and Lal Citation2005) and have stable aggregates with high soil organic carbon (SOC) contents (Torn et al. Citation1997; Powers and Schlesinger Citation2002; Bronick and Lal Citation2005). Their properties, which include a high surface area and highly variable pH-dependent charge, generally increase aggregation (Powers and Schlesinger Citation2002). The weathering products of amorphous clay minerals, 1:1 clay minerals and oxides, are also very stable (Powers and Schlesinger Citation2002).
Dispersion decreases when the EC of the soil solution increases (Amézketa Citation1999), as there is a higher osmotic gradient causing cations to go into solution. Dispersion increases as the soil pH increases (Amézketa Citation1999), because the negative charge on the clay particles also increases. Calcareous soils have been found to be more stable than non-calcareous soils (Yadav and Girdhar Citation1981).
This paper uses quantile regression analysis to determine the interactions between soil properties that influence the gully distribution of a catchment in Maphutseng, Lesotho. To attain the aim, interim objectives need to be met, which are to determine which soil stability parameter yields the greatest difference between the duplex soils and the other soils, and to determine to what extent individual soil properties exert an influence on the soil stability parameter determined in the first objective.
Material and methods
Site description
The study site () is a 370 ha catchment located in the Maphutšeng valley of the Mohale's Hoek region in Lesotho. The site has a 624 m difference in altitude, with Thaba Linoha (2 044 m) being the highest point and the lowest point being at the Maphutšeng River (1 420 m). Slopes of up to 50° occur. The mean annual precipitation measured at the closest weather station in Mohale's Hoek, 5 km north of Maphutšeng, is 740 mm. Precipitation is predominantly intense thunderstorms occurring from October to April.
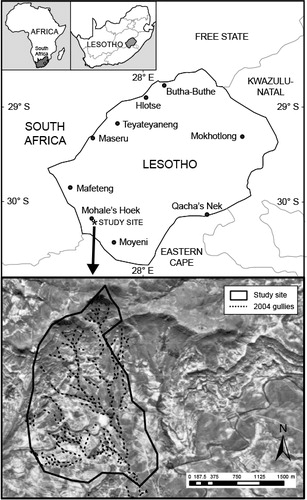
The catchment consists of four geological formations; basalt of the Lesotho formation, cave sandstones of the Clarens formation, sandstone and red shale beds of the Elliott formation, and the quartzite conglomerate of the Molteno formation (Directorate of Overseas Surveys Citation1981). Five distinct soil associations () formed on these geological formations. Basaltic soils occur on the Lesotho formation. The highly erodible duplex soils are found on the red beds of the Elliott formation. Three soil associations (blocky, red blocky and sandstone soils) occur on the sandstone of the Elliott and Molteno formations, due to different amounts of colluvium and depth of the sandstone parent material.
Table 1 Description of soil associations. Soil forms with similar properties regarding soil erosion were combined to create soil associations
Land use includes villages (Ha Tumane and Majakaneng), cultivation (mostly sorghum and maize), natural vegetation (grazing) and abandoned fields due to gully erosion.
Analytical methods
A soil map for the study site was created during a geographical investigation into gully erosion (van Zijl et al. Citation2013). Seventeen modal profile pits were sampled from each master horizon and the pedoderm (top 2 cm of the soil surface) for laboratory analysis. These profiles represent the most common soils occurring in the study site. Three samples were taken from mudstones exposed to the atmosphere on gully walls or floors, and another three were taken from the shallow basaltic soils on Thaba Linoha. This was done to have some reference to the properties of the parent materials of the soils.
All the samples were air dried and passed through a 2 mm sieve. Various physical and chemical properties related to soil erosion (Amézketa Citation1999; Rienks et al. Citation2000; Bronick and Lal Citation2005; Mills et al. Citation2006) were measured in the laboratory and are outlined below. Soil pH was determined in water and in 1 M KCl using a ratio of 1:2.5 soil:solution. If the pH measured in KCl was less than 4.5, the titratable acidity was determined using a 0.1 M NaOH solution and phenoftalien (White Citation2006). Calcium, Mg, sodium (Na) and potassium (K) were determined by atomic absorption spectroscopy from a filtered supernatant using a 1:10 soil:NH4OAc extract (White Citation2006), and from a filtered water-saturated paste extract (US Salinity Laboratory Staff Citation1954). Electrical conductivity (EC) was also measured on the saturated paste extract. ‘Free’ Fe, Al and manganese (Mn) were determined by the citrate bicarbonate dithionate (CBD) method (Mehra and Jackson Citation1960) on selected samples that expressed strong red and yellow colours, all top soil samples and the six parent material samples. Total carbon (C) and nitrogen (N) were measured in the topsoil and control samples by combustion using a EuroVector3000 elemental analyser. Particle size was determined with the pipette method (Gee and Bauder Citation1986). Munsell soil colour (Munsell Citation2000) was converted to a relative numerical value, using the method of Mellville and Atkinson (Citation1985), which calculates a soil colour value based on a reference colour. The reference colour used was 10YR2/1.
Soil stability indices were quantified using a laboratory infiltrability index (Mills and Fey Citation2004), water-dispersible (WD) silt and clay with the double pipette method (Soil Classification Working Group Citation1991), and macro-aggregate stability with the wet sieving method (Kemper and Rosenau Citation1986). Two clay dispersion indices could be calculated from the results of the water-dispersible silt and clay test, namely the total WD clay, which is the dispersible clay expressed as a percentage of the total soil mass, and the dispersion ratio, which is the dispersible clay expressed as a percentage of the total clay fraction. The wet-sieving aggregate stability test determined the percentage of water-stable aggregates (%WSA) in the 1–2 mm size fraction of the soil sample. The infiltrability was done only on the pedoderm and control samples. Both the infiltrability and macro-aggregate stability were done in triplicate.
The following calculations used the above data: exchangeable sodium percentage (ESP), exchangeable magnesium percentage (EMgP), exchangeable calcium percentage (ECaP), effective cation exchange capacity (ECEC), ECEC/Clay% and carbon-adjusted ECEC/ Clay%. ECEC was calculated by the summation of all the exchangeable cations, Ca2?, Mg2, K, Na and exchangeable acidity.
Statistical methods
The geographical investigation (van Zijl et al. Citation2013) determined that recent gullying in the study site was confined to the area covered by duplex soils. To meet the first objective a one-way analysis of variance (ANOVA) on the soil stability parameters for the different horizons of the soil map units was performed. This ANOVA showed that the dispersion ratio is the soil stability parameter that shows a clear difference between the duplex soils and the other soil map units. To account for objective 2, Pearson and Spearman correlations were determined for each soil property and the dispersion ratio. No soil property showed conclusively to exert the largest influence on clay dispersion. A forward stepwise regression was then conducted with ‘free’ Fe percentage, clay percentage, ESP, total C content, ECEC/Clay and carbon-adjusted ECEC/Clay with different combinations of stratification of the different samples. All of these analyses were done with Statistica (StatSoft, Inc., Tulsa, OK, USA). Segmented quantile regression was then used to determine the influence of the interaction between soil properties on soil dispersion, by applying the method described by Mills et al. (Citation2006), based on the DRIS approach developed by Beaufils (Citation1973).
Cade and Noon (Citation2003) state that quantile regression models are useful when the response variables are affected by more than one factor, when the response is different to different factors, when all applicable factors are not measured and when there is an interaction of multiple factors. It is therefore a powerful investigation tool for soil erosion studies where various complex interactions between contributing factors exist. Quantile regression has been used in a variety of environment-related studies, including plant self-thinning (Cade and Guo Citation2000), prey and predator size relationships (Scharf et al. Citation1998) and Mediterranean fruit fly survival (Koenker and Geling Citation2001).
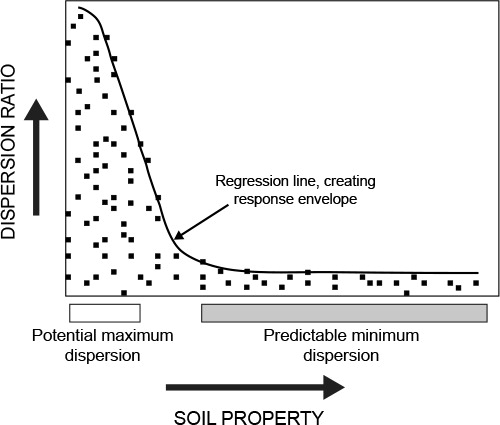
The theory behind quantile regression is to fit a regression line through a part of the data points to create a response envelope. Inside of this envelope will be the zone of reality, where actual data points occur and outside of this envelope is the imagination zone, where data points could, but do not, occur. The area inside the envelope represents the area where a certain percentage (depending on the quantiles chosen to create the envelope) of data points will occur. , adapted from Mills et al. (Citation2006), explains this graphically. On the y-axis is the dependent variable, in this case the dispersion ratio. On the x-axis is the soil property that is studied. The regression line creates the envelope wherein most of the data points will occur. The zones of where potential maximal dispersion and predictably minimal dispersion may occur are shown. It is important to remember that the zone of potential maximum dispersion does not mean that dispersion will be maximal, but rather that it may be. There are some data points showing a low dispersion in this zone (). It is also important to note that the graph does not necessarily show causality. The process with which the response envelopes are drawn is explained in detail by Medinski (Citation2007).
Results and discussion
Correlation between soil stability measures and soil map units
Only horizons from the blocky, red blocky and duplex soils were included in the ANOVA (), as there were more than one replicate of each of these. Large differences were obtained for total WD clay and dispersion ratio. For total WD clay, the B horizon of the duplex soils was significantly different compared to all the other horizons. In terms of dispersion ratio, the duplex soil horizons differed from all other soil horizons, except the red blocky A horizon. The E horizons associated with the duplex soils did not differ statistically from the red blocky B horizon. The average dispersion ratios of all the duplex soil horizons are much higher than that of the red blocky horizons. The results show that soil dispersion is the dependent soil variable that distinguishes the duplex soils from the other soils and can therefore be used to identify areas with a high gully erosion potential.
Table 2 Average values of soil stability properties for different horizons of the soil map units. Different superscript letters following an average indicates a statistical difference at the 95% confidence level. WSA = water-stable aggregates, WD = water dispersible
The conditions needed for piping to occur are soil with a dispersive nature, free water accumulating within the subsoil and an outlet for this free water (Fletcher and Carroll Citation1948; Thornes Citation1980). The dispersion ratio shows the largest difference between the area of high erosion and the area of low erosion, suggesting that piping is the probable mechanism of gullying on this site. This argument is strengthened by the lack of a significant difference for%WSA between the duplex and other soil horizons. The%WSA imitates the slaking forces exerted on a soil by flowing water (Truman et al. Citation1990). It is expected that when runoff is the main initiator of erosion that the%WSA will correlate well with erodibility, which was not the case in this study.
The basaltic soils have very stable aggregates, indicated by a very high%WSA, no clay dispersion, very little silt dispersion and a very high infiltrability (). This is typical of the volcanic parent material of the basaltic soils. Dispersion ratio opposed to total dispersible clay was used as the dependent soil variable to correlate with other soil properties, due to the dispersion ratio showing the tendency of clay to disperse, irrespective of the amount of clay present in the sample. Clay dispersion does not show in dispersive soils with only small amounts of clay present when measured as total dispersible clay, e.g. the A and E horizons of duplex soils.
The dispersion ratios of all samples varied between 0 and 70.4, with an average value of 19.1. According to Hazelton and Murphy (Citation2007) the minimum dispersion ratio falls in the negligible/aggregated category (<6%), the average in the slight category (6–30%) and the maximum dispersion in the very high (>65%) category. The soils in this catchment cover the whole range of possible dispersion ratios.
Correlations between soil properties and dispersion ratio
Several soil properties were correlated with the dispersion ratio at the p = 0.01 level (). None of the correlations were strong, with the highest coefficient of determination (R2) value being 0.53 (FeAl%). As expected, soil colour and ESP also showed stronger correlation values. The low R2 values add substance to the statement by Rienks et al. (Citation2000) that to some degree the effects of soil properties that influence dispersibility may cancel each other out.
Table 3 Correlations between soil properties and dispersion ratio
The forward stepwise regression analysis was inconclusive as it did not improve any of the R2 values when the analysis was carried out for the whole data set. When the data set was stratified and only topsoil samples analysed, an R2 value of 0.79 was obtained by combining ESP and carbon-adjusted ECEC/Clay. This shows that the type of clay mineral does affect the dispersion of the topsoils. Carbon-adjusted ECEC/Clay was not significantly correlated to the dispersion ratio, indicating that the type of dominant clay mineral alone does not determine the soil's susceptibility to dispersion.
Quantile regression analysis
Soil properties
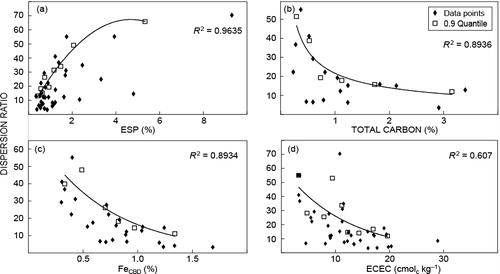
The best-fit boundary lines of the quantile regression are shown in . The environmental envelopes showed a good fit around the data, with only the ECEC graph () having an R2 value for the 0.9 quantile below 0.89. The graphs show that minimum dispersion will occur in samples with high C content, a high ECEC, a high ‘free’ Fe percentage and a low ESP. These results correspond well with the literature.
The average dispersion ratio of 19.1 was substituted into the equations for the 0.9 quantile trendlines, to calculate the property thresholds for below-average dispersion. shows the samples that had a below-average dispersion ratio and/or complied with at least one of the threshold values. The threshold values were compared to the values of the samples for these properties. Nearly all the samples showing a dispersion ratio below 19.1 complied with at least one threshold value (not including colour as it is also a response variable). Colour is included in as it is possibly an indicator of soil dispersion and is mentioned in discussions.
Table 4 Dispersion threshold values of some soil properties. The samples shown have a below-average dispersion ratio and/or comply with at least one threshold value. Threshold values are shown in parentheses and where a sample complies with a threshold value the value is highlighted. Omitted values were not determined. ECEC = effective cation exchange capacity, ESP = exchangeable sodium percentage; FeCBD = citrate bicarbonate dithionate extractable iron
The threshold value for ESP was very low at 0.67%. Hazelton and Murphy (Citation2007) deem the values of ESP below 5 to indicate non-sodic soils, 5–10 is marginally sodic to sodic, and above 10 is strongly sodic. Sample 12B was the only sample classified as sodic. The low Na levels confirm the view of Rooyani (Citation1985) and Yaalon (Citation1987) that sodicity is not needed for piping to occur.
Total C, ECEC and FeCBD are regarded as aggregating agents, as high values of these properties result in low dispersion. The threshold values of 1.17% for total C and 13.7 for ECEC are moderate values (Hazelton and Murphy Citation2007). The FeCBD threshold value of 0.90% is very low when compared to the soil Thompson (Citation1986) studied, which contained 10.4% Fe, and moderate when compared to the study of Six et al. (Citation2000), where the values varied between 0.32% and 1.4%. The threshold values indicate that aboveaverage dispersion occurs within soils with moderate amounts of aggregating agents and very low levels of dispersion agents.
Four samples with below-average dispersion ratios did not meet with any of the threshold values (). Two of these samples were B horizons (8B1 and 8B2) of an Oakleaf soil, which were not tested for C and Fe, but where the A horizon (8A) met the Fe threshold. As Fe increases with depth in all soil profiles where the subsoil was tested for Fe except profile 2, it can be assumed that these two samples will also comply with the threshold values for Fe. The other two samples with below-average dispersion that did not meet any threshold values were 7A (Glenrosa) and 9B (Valsrivier). The 7A sample had a carbon-adjusted ECEC/Clay value of 20.4 cmolc kg-1. The CEC value of kaolinite is 315 cmolc kg-1 clay and for illite it is 25–40 cmolc kg-1 clay (Rooyani and Badamchian Citation1986). As ECEC values can only be higher than CEC values, this means that 7A probably has a clay mineralogy comprising a considerable amount of kaolinite. Six et al. (Citation2000) reported a synergistic effect between oxides and kaolinite on aggregate stability. This same effect is probably active in sample 7A. Sample 9B is dark enough to comply with the colour threshold of 8.4 (). It was not tested for total C or FeCBD. Its topsoil also does not comply with the threshold values for these soil properties. It might be that it actually complies with the Fe threshold, as the FeCBD value of the 9A horizon (0.74%) is quite close to the FeCBD threshold value of 0.90%.
Interestingly, 9A was the only sample to show above-average dispersion and to comply with one of the thresholds, namely ESP. Its ESP was 0.57%, which was 11% below the ESP threshold value of 0.68%. It did not comply with any of the other threshold values. This shows that low concentrations of Na (indicated by the non-compliance to the ESP threshold) can cause dispersion of a soil when no aggregation agents are present (indicated by the non-compliance to the other thresholds).
The B horizon of Profile 5 (Estcourt soil form) had an ESP of 4.8% (the second highest) but a dispersion ratio of only 14.5 (), and a high Fe content (1.25%), which contributed to the stability of the aggregates. This sample is similar to the Smithdale sample from the study of Seta and Karathanasis (Citation1996), which had an ESP of 4.7% and Fe and Al concentrations of 1.9% and 1.6%, respectively, but a dispersion ratio of only 2.7. These scenarios show that a soil with a relatively high ESP will have relatively stable aggregates if sufficient stabilising agents are present.
Parent material effect
contradicts the literature. Low dispersion values were found at high EMgP () and low ECaP and Ca:Mg values ( and ). The coarse sand (500–2 000 µm) () should not influence soil dispersion, although it can clearly be seen that low dispersion occurs at the higher coarse sand fractions.
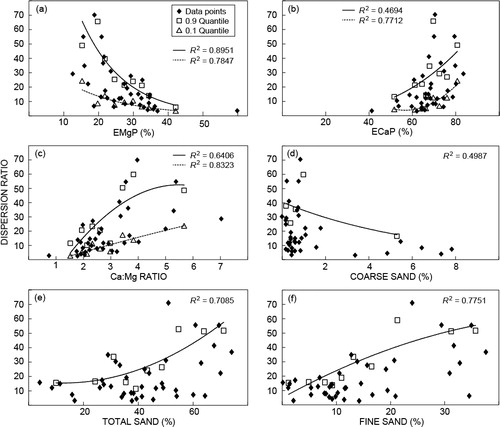
The explanation for these results is to be found in the parent material of the soils. As mentioned, soils of volcanic origin tend to be stable because of the amorphous nature of the clay minerals. Soils derived from mudstones and especially from Elliott red beds are notoriously unstable (Laker and Smith Citation2006). De Villiers (Citation1965)argues that one must view the parent material of a soil as the material wherein it forms, rather than the rock on which it forms. Soil from large parts of the catchment, although occurring on the Elliott or Molteno geological formation, will have an element of basaltic parent material through soil creep and surface wash from the upper slopes. These soils will exhibit some basaltic soil properties.
Soil derived from basaltic material will have more coarse sand, fine sand and total sand than a soil derived from mudstone (). Chemically, it will consist of higher exchangeable Mg (which leads to a higher EMgP) and less exchangeable Ca (leading to a lower ECaP), leading to a lower Ca:Mg ratio. The ESP value will be lower and basaltderived soils should show a darker colour than that of a mudstone-derived soil. Not all these properties are statistically different, but the trends are still clear. The differences are larger when the basaltic soils are compared to the Elliott red bed sample. When the basaltic soil properties are compared to the areas of low dispersion (–), it shows that the areas of minimum dispersion exist at the areas of maximum basaltic properties.
Table 5 Certain properties of the basaltic soils, mudstones and red bed sample. Different superscript letters within a column indicates a statistical difference at p < 0.05. ESP = exchangeable sodium percentage, EMgP = exchangeable magnesium percentage, ECaP = exchangeable calcium percentage, Ca:Mg =calcium:magnesium ratio
When clay is dispersed it will be eluviated, resulting in a relative enrichment of sand. Consequently, the fine sand and total sand graphs ( and ) indicate minimum levels of dispersion at low sand content levels. The inverse trend shown in the coarse sand graph () indicates that the coarse sand originated from basalt rather than from Molteno formation sandstone, which can contain coarsegrained sands.
Conclusions
Soil dispersion is the soil stability parameter that yielded the greatest difference between the duplex soil map unit and the other soil map units. The accelerated erosion on the duplex soils area is associated with piping.
Little insight into the soil properties controlling soil dispersion could be gained when evaluating individual soil properties, confirming previous studies that the effects of individual soil properties on soil dispersion could eliminate the effect of other soil properties. Minimum dispersion will occur in soil samples with high levels of aggregating soil properties, namely C content, ‘free’ Fe and ECEC, and low levels of dispersing agents, such as Na. Novel to this paper is the finding that in the absence of moderate values of aggregating soil properties, even very low (ESP 0.67%) levels of Na could cause soil dispersion and therefore gully erosion. Quantile regression was shown to be an excellent tool to analyse the effect of multiple soil properties on soil dispersion.
It was also determined that the soil's dispersion is determined by the soil's parent material, which means the transported material wherein the soil developed, rather than the geological formation on which it has formed. Soils with properties resembling the basaltic soils’ properties tend to be more stable than other soils.
Acknowledgements
We thank the reviewers for their constructive comments and Darren Bouwer for improving the English used in the manuscript.
References
- Amézketa E. 1999. Soil aggregate stability: a review. Journal of Sustainable Agriculture 14: 83–151.
- Beaufils ER. 1973. Diagnosis and recommendation integrated system (DRIS). Soil Science Bulletin no. 1, Pietermaritzburg: University of Natal.
- Bloem AA, Laker MC. 1994. Criteria for adaptation of the design and management of centre-pivot irrigation systems to the infiltrability of soils. Water SA 20: 127–132.
- Bronick CJ, Lal R. 2005. Soil structure and management, a review. Geoderma 124: 3–22.
- Bühmann C, Beukes DJ, Turner DP. 2006. Clay mineral associations in soils of the Lusikisiki area, Eastern Cape Province, and their agricultural significance. South African Journal of Plant and Soil 23: 78–86.
- Cade BS, Guo Q. 2000. Estimating effects of constraints on plant performance with regression quantiles. Oikos 91: 245–54.
- Cade BS, Noon BR. 2003. A gentle introduction to quantile regression for ecologists. Frontiers in Ecology and the Environment 1: 412–420.
- de Villiers JM. 1965. Present soil forming factors and processes in tropical and subtropical regions. Soil Science 99: 50–57.
- D'Huyvetter JHH, Laker MC. 1985. Determination of threshold slope percentages for the identification and delineation of arable land in Ciskei, Pretoria: Final report to the CSIR.
- Dimoyiannis DG, Tsadilas CD, Valmis S. 1998. Factors affecting aggregate instability of Greek agricultural soils. Communications in Soil Science and Plant Analysis 29: 1239–1251.
- Directorate of Overseas Surveys. 1981. 1:50 000 Lesotho geological sheet 12B (3027AB and part of 3027AA). Maseru: Department of Mines and Geology, Ministry of Water, Energy and Mining.
- Fletcher JE, Carroll PH. 1948. Some properties of soils associated with piping in southern Arizona. Proceedings of the Soil Science Society of America 13: 545–547.
- Frenkel H, Goertzen JO, Rhoades JD. 1978. Effects of clay type and content, exchangeable sodium percentage, and electrolyte concentration on clay dispersion and soil hydraulic conductivity. Soil Science Society of America Journal 48: 32–39.
- Gee GW, Bauder JW. 1986. Particle-size analysis. In: Klute A (ed.), Methods of soil analysis. Part 1: Physical and mineralogical methods (2nd edn). Madison: American Society of Agronomy and Soil Science Society of America. pp 383–411.
- Goldberg S, Suarez DL, Glaubig RA. 1988. Factors affecting clay dispersion and aggregate stability of arid-zone soils. Soil Science 146: 317–325.
- Hazelton P, Murphy B. 2007. Interpreting soil test results: what do all the numbers mean?, Collingwood: CSIRO Publishing.
- Heil D, Sposito G. 1993a. Organic matter role in illitic soil colloids flocculation. I. Counter ions and pH. Soil Science Society of America Journal 57: 1241–1246.
- Heil D, Sposito G. 1993b. Organic matter role in illitic soil colloids flocculation. II. Surface charge. Soil Science Society of America Journal 57: 1246–1253.
- IUSS Working Group WRB. 2007. World Reference Base for Soil Resources 2006, first update 2007. World Soil Resources Report no. 103. Rome: Food and Agriculture Organization of the United Nations.
- Kemper WD, Rosenau RC. 1986. Aggregate stability and size distribution. In: Klute A (ed.), Methods of soil analysis. Part 1: Physical and mineralogical methods(2nd edn). Madison: American Society of Agronomy and Soil Science Society of America. pp 425–442.
- Koenker R, Geling O. 2001. Reappraising medfly longevity: a quantile regression survival analysis. Journal of the American Statistical Association 96: 458–468.
- Laker MC. 2004. Advances in soil erosion, soil conservation, land suitability evaluation and land use planning research in South Africa, 1978–2003. South African Journal of Plant and Soil 21: 345–368.
- Laker MC, Smith HJ. 2006. Soil protecting strategy for South Africa: review of existing knowledge on soil erosion, Pretoria: Agricultural Research Council–Institute for Soil, Climate and Water.
- Levy GJ. 1988. The effects of clay mineralogy and exchangeable cations on some of the hydraulic properties of soils. DSc(Agric) thesis, University of Pretoria, South Africa.
- Medinski TV. 2007. Soil chemical and physical properties and their influence on the plant species richness of arid South-West Africa. MSc thesis, Stellenbosch University, South Africa.
- Mehra OP, Jackson ML. 1960. Iron oxide removal from soils and clays by a dithionide-citrate system buffered with sodium bicarbonate. In: Swineford A(ed.), Proceedings of the 7th National Conference on Clays and Clay Minerals. New York: Pergamon Press. pp 317–327.
- Melville MD, Atkinson G. 1985. Soil colour: its measurement and its designation in models of uniform colour space. Journal of Soil Science 36: 495–512.
- Mills AJ, Fey MV. 2004. Declining soil quality in South Africa: effects of land use on soil organic matter and surface crusting. South African Journal of Science 99: 429–436.
- Mills AJ, Fey MV, Gröngröft A, Petersen A, Medinski TV. 2006. Unravelling the effects of soil properties on water infiltration: segmented quantile regression on a large data set from arid south-west Africa. Australian Journal of Soil Research 44: 783–797.
- Munsell. 2000. Munsell soil color charts (rev. washable edn). New Windsor: Gretag Macbeth.
- Nel DJ. 1989. Die relatiewe invloed van kalsium en magnesium op fisiese eienskappe van grond. DSc thesis, Potchefstroom University for Christian Higher Education, South Africa ( with extended English summary).
- Powers JS, Schlesinger WH. 2002. Relationships among soil carbon distributions and biophysical factors at nested spatial scales in rain forests of northeastern Costa Rica. Geoderma 109: 165–190.
- Rienks SM, Botha GA, Hughes JC. 2000. Some physical and chemical properties of sediments exposed in a gully donga in northern KwaZulu-Natal, South Africa and their relationship to the erodibility of the colluvial layers. Catena 39: 11–31.
- Rooyani F. 1985. A note on soil properties influencing piping at the contact zone between albic and argillic horizons of certain duplex soils (Aqualfs) in Lesotho, southern Africa. Soil Science 139: 517–522.
- Rooyani F, Badamchian B. 1986. A simplified text on general soil science: with emphasis on soils of Lesotho, Maseru: Lesotho Agricultural College.
- Scharf FS, Juanes F, Sutherland M. 1998. Inferring ecological relationships from the edges of scatter diagrams: comparison of regression techniques. Ecology 79: 448–460.
- Seta AK, Karathanasis AD. 1996. Water dispersible colloids and factors influencing their dispersibility from soil aggregates. Geoderma 74: 255–266.
- Showers KB. 2005. Imperial gullies, Athens, Ohio: Ohio University Press.
- Six J, Elliott ET, Paustian K. 2000. Soil structure and soil organic matter: II. A normalized stability index and the effect of mineralogy. Soil Science Society of America Journal 64: 1042–1049.
- Smith HJC 1990. The crusting of red soils as affected by parent material, rainfall, cultivation and sodicity. MSc(Agric) thesis, University of Pretoria, South Africa.
- Soil Classification Working Group. 1991. Soil classification: a taxonomic system for South Africa. Pretoria: Department of Agricultural Development.
- Soil Survey Staff. 1999. Soil taxonomy (2nd edn). Washington, DC: US Department of Agriculture, Natural Resources Conservation Service.
- Stern R. 1990. Effects of soil properties and chemical ameliorants on seal formation, runoff and erosion. DSc(Agric) thesis, University of Pretoria, South Africa.
- Sumner ME. 1957. The physical and chemical properties of Tall Grass Veld soils of Natal in relation to their erodibility. MSc(Agric) thesis, University of Natal, Pietermaritzburg, South Africa.
- Thompson JG. 1986. Sodicity phenomena in red sesquioxic clay subsoils. South African Journal of Plant and Soil 3: 189–192.
- Thornes JB. 1980. Erosional processes of running water. In: Kirkby MJ, Morgan RPC (eds), Soil erosion. Chichester: Wiley. pp 129–182.
- Torn MS, Trumbore SE, Chadwick OA, Vitousek PM, Hendricks DM. 1997. Mineral control of soil organic carbon storage and turnover. Nature 389: 170–173.
- Truman CC, Bradford JM, Ferris JE. 1990. Antecedent water content and rainfall energy influence on soil aggregate breakdown. Soil Science Society of America Journal 54: 1385–1392.
- US Salinity Laboratory Staff. 1954. Diagnosis and improvement of saline and alkali soils. USDA Agricultural Handbook no. 60. Washington, DC: US Department of Agriculture.
- van der Merwe GME, van Zyl AJ, Bühmann C, Kertész A, Papp S, Huszár T, Laker MC. 2001. Interrill erodibilities of melanic soils from South Africa. In: Programme and Extended Abstracts, Joint Congress 2001 of the SASCP, SAWSS and SSSSA, 16–18
- van Zijl GM, Ellis FE, Rozanov DA. 2013. Emphasising the soil factor in geomorphological studies of gully erosion: a case study in Maphutseng, Lesotho. South African Geographical Journal 95: 205–216.
- White RE. 2006. Principles and practice of soil science: the soil as a natural resource (4th edn). Oxford: Blackwell Science.
- Yaalon DH. 1987. Is gullying associated with highly sodic colluvium? Further comment to the environmental interpretation of southern African dongas, Palaeogeography, Palaeoclimatology. Palaeoecology 58: 121–123.
- Yadav JSP, Girdhar IK. 1981. The effect of different magnesiumcalcium ratios and sodium adsorption values of leaching water on the properties of calcareous soils versus non-calcareous soils. Soil Science 131: 194–198.