
Abstract
Soil aggregates breakdown mechanisms depend on soil properties such as texture, clay mineralogy and organic matter content. Little is known about the effect of soil properties on aggregate breakdown mechanisms in South African soils. The objective of this study was to establish the relationship between aggregate breakdown mechanisms and selected soil properties in some South African soils dominated by primary minerals. Soil samples with varying properties were collected from the surface 0–0.2 m from 14 ecotopes in Eastern Cape province. Aggregate stability was determined following the fast wetting (FW), slow wetting (SW) and wet stirring (WSt) methods. Soils with high quartz were the least stable due to its inability to bond with other clay minerals or soil organic matter (SOM). In contrast, soils with high kaolinite were the most stable. Slaking was the dominant aggregate breakdown mechanism in most of the studied soils. Aggregate stability was significantly correlated with particulate organic matter (POM) for FW (r2 = 0.74, P < 0.05) and SW (r2 = 0.64, P < 0.05). It was concluded that increasing POM content in soils through SOM inputs and farming methods that reduce POM mineralisation can reduce slaking during rapid wetting by raindrops.
Introduction
Unstable soil aggregates breakdown upon wetting to yield microaggregates and primary soil particles prompting the process of seal formation and soil erosion if adequate amount of runoff is available for transport (Le Bissonnais and Arrouyas Citation1997). In general, seal formation reduces infiltration rate (de Jong et al. Citation2011), aeration and inhibits seedling emergence (Rapp et al. Citation2000). Therefore, the overall impact of aggregate breakdown is reduced soil productivity. The magnitude of disaggregation depends on soil characteristics such as texture (Wuddivira et al. Citation2009), mineralogy (Wakindiki and Ben-Hur Citation2002) and soil organic matter (SOM) (Unger et al. Citation1998) because these properties direct the aggregate breakdown mechanisms (Le Bissonnais and Arrouyas Citation1997). Particulate organic matter (POM) is the most active and labile pool of SOM promoting soil aggregate stability (Blanco-Canqui and Lal Citation2004). This transient pool of SOM accounted for 16–39% of total SOM in some South African soils (Nciizah and Wakindiki Citation2012), which was similar to 20–37% observed in some soils of eastern Canada and the USA (Carter et al. Citation2003).
Aggregate breakdown is often inferred from aggregate stability measurements or the effects of seal formation on soil surface processes such as erosion and infiltration rate. For example, Ramos et al. (Citation2003) obtained strong correlation between mean weight diameter (MWD) and hydraulic conductivity for some Spanish soils because seal formation causes a reduction in hydraulic conductivity of soil. Moreover, in a study relating topsoil aggregate stability in red soils from subtropical China to interill erosion, Shi et al. (Citation2010) concluded that soil aggregation characterisation was an appropriate indicator of a soil's susceptibility to interrill erosion. Le Bissonnais (Citation1996) characterised four aggregate breakdown mechanisms: (1) slaking, caused by compression of entrapped air, (2) breakdown by differential swelling of clay, (3) mechanical breakdown by raindrop impact and (4) physicochemical dispersion due to osmotic stress. These disaggregation mechanisms are differentiated by the nature of inter-particle bonds that are broken, the energy involved in the disruption, physicochemical conditions required for disaggregation, kinetics of the breakdown properties and the intrinsic soil properties (Le Bissonnais Citation1996; Taboada-Castro et al. Citation2004).
Consequently, Le Bissonnais (Citation1996) suggested that good procedures for measuring aggregate stability should mimic the breakdown mechanisms. The proposed methods were fast wetting (FW), slow wetting (SW) and wet stirring (WSt). Fast wetting measures the stability of aggregates subjected to slaking, slow wetting measures stability of aggregates subjected to microcracking, whilst wet stirring measures stability of aggregates exposed to wet mechanical cohesion (Le Bissonnais Citation1996). However, aggregate stability and breakdown mechanisms depend on soil properties such as soil texture, clay mineralogy and SOM content (Le Bissonnais and Arrouyas Citation1997; Legout et al. Citation2005). Legout et al. (Citation2005) compared the aggregate stability measurements with mechanisms of aggregate breakdown and obtained a significant correlation coefficient (r) of 0.87 for silt loam and 0.91 for clay soils. The soil properties may act independently or interact spatially or temporally with each other in their effects on aggregate breakdown (Bakker et al. Citation2004). Therefore, the relationships between aggregate breakdown and soil properties are not always consistent. For example, Six et al. (Citation2004) obtained weak correlations between SOM and aggregate stability in tropical soils. Elsewhere, crusting increased exponentially with increasing smectitic clay content up to 18% clay (FAO Citation1993). In contrast, Stern et al. (Citation1991) found no correlation between silt and clay content and the steady-state infiltration rate in 18 South African soils. This finding suggests that clay mineralogy may play an important role in determining aggregate breakdown dynamics. This assertion requires further studies, especially in some parts of the Eastern Cape, which are dominated by such primary minerals as quartz (Mandiringana et al. Citation2005), which in addition to being chemically inert is highly dispersive (Buhman et al. Citation2006).
In particular, the characterisation of aggregate breakdown dynamics during rainfall in these soils is important in soil erodibility studies. Therefore, the objective of this study was to establish the relationship between aggregate breakdown mechanisms and selected soil properties in some South African soils dominated by primary minerals. It was hypothesised that aggregate stability and breakdown mechanisms depend on soil texture and organic matter in soils dominated by primary minerals.
Materials and methods
Soil sampling
Soil samples with varying properties were collected from the surface 0–0.2 m with a spade from 14 ecotopes in Eastern Cape province, South Africa (). The soil samples were then transported to the laboratory in rigid containers to avoid breaking the soil aggregates. After air drying for a week, each of the 14 composite soil samples was divided into three subsamples for analysis. Prior to analysis, each subsample was passed through 5, 3 and 2 mm sieves. The 3–5 mm fraction was used for an aggregate stability test using the Le Bissonnais method (Le Bissonais Citation1996), whilst the <2 mm fraction was used for the initial soil characterisation, i.e.soil texture, SOM content and mineralogy. Soil pH and electrical conductivity (EC) in water following methods described by Okalebo et al. (Citation2000), particle size distribution according to Gee and Or (Citation2002), SOM content as described by Cambardella et al. (Citation2001) and soil mineralogy according to the Rietveld method as described by Zabala et al. (Citation2007). More information about soil sampling and initial characterisation is given in (Nciizah and Wakindiki Citation2012).
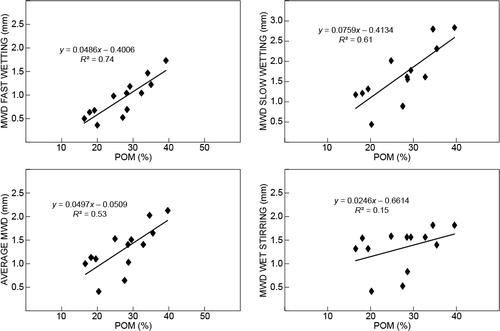
Table 1 Selected soil physical, chemical and mineralogical properties for the 14 ecotopes. EC = electrical conductivity, POM = particulate organic matter, SOM = soil organic matter
Aggregate stability determination
The 3–5 mm aggregates were oven dried at 40 °C for 24 h to bring them to a constant matric potential. For FW, a 5 g sample of aggregates was immersed in 50 ml deionised water for 10 min. A pipette was used to suck off the water. Afterwards, the soil material was gently transferred to a 0.05 mm sieve that was previously immersed in ethanol. The sieve was then gently moved up and down in ethanol five times to separate the <0.05 mm fragments from those <0.05 mm. The remaining aggregates were collected on a 0.05 mm sieve, dried in an oven at 40 °C, and their size distribution was measured by dry sieving with sieves with 2.0, 1.0, 0.5, 0.25, 0.1 and 0.05 mm apertures. The mass of the <0.05 mm fraction was calculated as the difference between the initial weight and the sum of the mass of the six other fractions. Slow wetting was done by placing 5 g of the aggregates on a filter paper and maintaining a matric suction of c. 30 kPa for 30 min (Le Bissonnais Citation1996). Aggregate size distribution was determined as described for the FW method. For the WSt treatment, a 5 g sample of aggregates was first immersed in 50 ml ethanol for 10 min to preserve the soil structure. The ethanol was sucked off with a pipette, then the aggregates were immersed in 50 ml deionised water in a 250 ml volumetric flask. The flask was then filled with 200 ml deionised water, corked and agitated end to end 20 times and left to stand for 30 min to allow the sedimentation of coarse particles. Excess water was sucked off with a pipette and the remaining aggregates were collected and treated as explained for the FW treatment. The aggregate stability was expressed using the mean weight diameter (MWD) of the seven classes as follows:
where wi was the mass fraction of aggregate in the size class i with a diameter X (Le Bissonnais Citation1996).
Soil mineralogy and SOM fractions
Soil mineralogy, total SOM and POM data were obtained from Nciizah and Wakindiki (Citation2012). The data were obtained following methods described by Zabala et al. (2010) and Cambardella et al. (Citation2001).
Data analysis
A one-way analysis of variance (ANOVA) was performed using JMP 10 (SAS Institute Citation2012). Mean separations were done using Fisher's protected least significant differences (LSD) at P < 0.05.
Results and discussion
Some chemical, physical and mineralogical properties of the 14 soils used in this study are shown in . The soil mineralogy was dominated by primary minerals, mainly quartz. The soils were mostly of medium texture with the most dominant textural classes being sandy clay loam and sandy loam (). Most of the ecotopes were under cultivation but few were under pasture. Climatic conditions were mostly semi-arid whilst a few were subhumid.
Effect of soil texture and mineralogy on aggregate stability
Aggregate stability, represented by the MWD among the ecotopes was significantly different (P < 0.05) within each of the three wetting methods (). The average MWD ranged from 0.41 to 2.87 mm, whilst ranges of 0.36 to 2.73 mm were observed for FW, 0.44 to 3.23 for SW, and 0.42 to 2.64 mm for WSt (). Generally, aggregate breakdown followed the order slaking < mechanical breakdown < microcracking for most ecotopes except Lujiko Leeufontein and Amatola Jozini, where SW and WSt resulted in the lowest MWD.
Table 2 Aggregate stability expressed as mean weight diameter and coefficient of vulnerability (KV). FW = fast wetting, SW = slow wetting, WSt = wet stirring, P = pasture
Alice Jozini had the lowest MWD and was therefore the most unstable soil (Le Bissonnais Citation1996) for each treatment with MWD values of 0.36 after FW, 0.44 after SW and 0.42 mm after WSt (). This soil had 35.70 g kg-1 SOM content, 12% clay and 77.01% quartz. Quartz increases susceptibility to crusting and erosion across much of South Africa (Buhman et al. 1996). These authors showed that even mild shaking in distilled water resulted in high soil disaggregation. Moreover, quartz is chemically inert (Zelazny et al. Citation1996) and is therefore unable to bond with other clay minerals or SOM and is consequently highly dispersive (Buhman et al. 1996). Lujiko had the highest MWD for all three treatments with values of 2.73 after FW, 3.23 after SW and 2.87 mm after WSt (). According to classes of stability and crustability given by Le Bissonnais (Citation1996), these soils are very stable with no crusting expected to occur. This was a rather unusual result given the high amount of quartz (75.14%) and relatively low SOM (38.2 g kg-1) identical to the most unstable soil. This outcome suggested that some other factors contributed to the stability and thus overwhelmed the effect of quartz in causing soil dispersion and subsequent aggregate breakdown. Consequently, high quartz content may not always result in low soil aggregate stability. The second-most stable soil was from Debenek and had MWD of 1.73 after FW, 2.84 after SW and 1.82 mm after WSt (). No quartz was detected from this sample but it had a kaolinite content of 2.1%, which could have increased its stability. Kaolinite promotes aggregate stability and reduces aggregate breakdown (Wakindiki and Ben-Hur Citation2002). Similarly, the third-most stable sample, Phandulwazi Jozini, had the highest quartz content and the lowest SOM content.
To determine the most dominant disaggregation mechanism with more certainty, soil structural stability was also reported in terms of the coefficient of vulnerability (KV). The KV shows how many times the initial average size decreases under the influence of a particular disaggregation mechanism (Valla et al. Citation2000). The initial MWD for all aggregates, which was 3.5, was divided by the respective MWD after the three tests. The closer the KV value is to 1, the less vulnerable the aggregates are to a given disaggregation method. KV1 corresponded to vulnerability after FW, KV2 to SW and KV3 to WSt. Alice Jozini had the lowest MWD values for all three wetting methods and was the most susceptible soil to slaking with a KV1 of 10.06. Susceptibilities of the aggregates to breakdown due to microcracking (KV2) was 8.18 and mechanical breakdown (KV3) was 8.3, which was higher than the remainder of the soils. The lowest KV to all breakdown methods was observed in the Lujiko Leeufontein ecotope. The aggregates were broken down by FW only 1.28 times, 1.08 times by SW and 1.33 times by WSt. However, unlike the remainder of the ecotopes, Lujiko Leeufontein was most susceptible to microcracking. The second-most susceptible soil to FW with a KV1 of 7.13 was Ncera Kinross. Although this ecotope had appreciable amounts of kaolinite (9.3%), it had a similar amount of smectite (9.9%), which could have rendered the soil highly dispersible (Buhman et al. Citation2006).
Relationship between aggregate stability and SOM fractions
There were no discernible relationships between the MWD measured after the three wetting methods (i.e. FW, SW and WSt) and total SOM, soil texture and mineralogy. Similar findings were reported by Levy and Mamedov (Citation2002), who observed a lack of a significant relationship between aggregate stability indices and SOM content. Levy and Mamedov (Citation2002) went on to suggest that if SOM is limiting other soil properties such as clay content and Fe oxides may have a greater impact on aggregate stability and, hence, overshadow effects of organic matter. This was not the case in this study since even clay content had poor relationships with aggregate stability. Therefore, some soil properties may support or inhibit the influence of each other. For instance, soils with high SOM, low quartz and appreciable kaolinite had high smectite and hence the smectite probably decreased the aggregate stability (Lado et al. Citation2004). Therefore, a specific fraction of the organic pool may be the main stabilising agent in these soils. In this case, significant relationships were observed between percentage POM and MWD after FW and SW. The highest r2 value (r2 = 0.74, P <0.05) was observed between percentage POM and MWD after FW, followed by 0.64 after SW and 0.15 after WSt. Therefore, POM explained more than 70% of the observed variation in MWD values for these soils during FW and 64% during SW conditions, and 15% during mechanical agitation (). Therefore, POM, which is the active part of total SOM, plays a greater part in determining the stability of soil aggregates against slaking, which was the dominant aggregate breakdown mechanism, and microcracking in the field than total SOM for these soils. However, a study by Nciizah and Wakindiki (Citation2012) on the same soils showed strong positive linear relationships between SOM and POM. Consequently, increases in SOM are likely to increase POM content in these soils and subsequently aggregate stability. Particulate organic matter exerts greater influence on soil behaviour, especially aggregate stability, than other fractions (Cambardella et al. Citation2001; Blanco-Canqui and Lal Citation2004). Particulate organic matter forms an organic core surrounded by clay, silt and microaggregates, which improves aggregation (Blanco-Canqui and Lal Citation2004). In this study, soils that had low total SOM, but higher percentage POM, for example Phandulwzi Jozini and Debenek, were more stable than soils with higher total SOM but lower percentage POM, such as Amatola Jozini and Ncera Kinross. However, for FW and WSt, the soils were clustered into two distinct groups, i.e. ±20% POM and 25% to c. 45% POM. For FW, the first group had MWD values ranging from 0.36 to 0.63, whilst the second group had higher MWD values ranging from 0.52 to 1.73. The values for SW were higher than those for FW for both groups, i.e. 0.44 to 1.32 for the first group and 0.89 to 2.84 for the second group. Consequently, a threshold of 20% POM is required for significant improvement in aggregate stability. A similar grouping was observed by Le Bissonnais and Arrouyas (Citation1997) after correlating MWD and organic carbon. They observed a threshold of 15 g kg-1 organic carbon.

Correlations were also done to determine the relationships between MWD after each of the three breakdown mechanisms, as suggested by Taboada-Castro et al. (Citation2004). Coefficients of determination (r2) among all three methods were statistically significant, i.e. 0.71 between SW and WSt, 0.84 between FW and SW, and 0.74 between FW and WSt. Therefore, the three wetting methods disintegrated the aggregates by breaking union points between the particles of the aggregates of similar nature (Taboada-Castro et al. Citation2004). However, there was a difference in the magnitude of the breakdown ().
Conclusions
Fast wetting resulted in lower aggregate stability than slow wetting and wet stirring for most of the soils used in this study, which is consistent with soils high in quartz and an inability to bond with other minerals or SOM. This indicated that the soils were highly susceptible to breakdown due to compression of entrapped air during wetting. This was further confirmed by the higher vulnerability coefficient for FW than SW and WSt. Meanwhile, aggregate stability after the three breakdown mechanisms was similar. Thus, it is imperative to protect the soils from rapid wetting and raindrop impact as well as microcracking. Aggregate stability was significantly correlated with POM only for FW and SW, and positively but non-significantly correlated for WSt. This outcome confirmed the importance of POM in soil aggregation. Therefore, increases in POM content in these soils through high SOM inputs and farming methods that reduce POM mineralisation are likely to increase soil aggregation. In this regard, maintenance of POM at over 20% of total SOM has the potential to significantly improve aggregate stability in these soils. The lack of discernible relationships between MWD and SOM and mineralogy and clay content warrants further studies.
Acknowledgements
Funding for this study was provided by the Govan Mbeki Centre for Research and Development of the University of Fort Hare through grant number C104 to IICW.
References
- Bakker MB, Govers G, Rounsvell MDA. 2004. The crop productivityerosion relationship: an analysis based on experimental work. Catena 57: 55–76.
- Blanco-Canqui H, Lal R. 2004. Mechanisms of carbon sequestration in soil aggregates. Critical Reviews in Plant Science 23: 481–505.
- Buhman C, Beukes DJ, Turner DP. 2006. Clay mineral associations in soils of the Lusikisiki area, Eastern Cape province, and their agricultural significance. South African Journal of Plant and Soil 23: 78–86.
- Cambardella CE, Gajda AM, Doran JW, Wienhold BJ, Kettle TA. 2001. Estimation of particulate and total organic matter by weight-loss-on ignition. In: Lal R, Kimble JF, Follet RF, Stewart BA (eds), Assessment methods for soil carbon. Bota Raton: CRC Press. pp 349–359.
- Carter MR, Angers DA, Gregorich EG, Bolinder MA. 2003. Characterising organic matter retention for surface soils in eastern Canada using density particle size fractions. Canadian Journal of Soil Science 83: 11–23.
- de Jong SM, Addink EA, van Beek LPH, Duijsings D. 2011. Physical characterization, spectral response and remotely sensed mapping of Mediterranean soil surface crusts. Catena 86: 24–35.
- FAO (Food and Agriculture Organization of the United Nations). 1993. Soil tillage in Africa: needs and challenges. FAO Soils Bulletin 69. Rome: FAO.
- Gee GW, Or D. 2002. Particle size analysis. In: Dane JH, Clarke Topp G (eds), Methods of soil analysis, part 4: Physical methods. SSSA Book Series no. 5. Madison: Soil Science Society of America. pp 255–293.
- Lado M, Paz A, Ben-Hur M. 2004. Organic matter and aggregate size interaction in infiltration, seal formation and soil loss. Soil Science Society of America Journal 68: 935–942.
- Le Bissonnais Y. 1996. Aggregate stability and measurement of soil crustability and erodibility: I. Theory and methodology. European Journal of Soil Science 47: 425–437.
- Le Bissonnais Y, Arrouays D. 1997. Aggregate stability and assessment of soil crustability and erodibility: II. Application to humic loamy soils with various organic carbon contents. European Journal of Soil Science 48: 39–48.
- Legout C, Leguedois S, Le Bissonnais Y. 2005. Aggregate breakdown dynamics under rainfall compared with aggregate stability measurements. European Journal of Soil Science 56: 225–237.
- Levy GJ, Mamedov A. 2002. High-energy-moisture-characteristic aggregate stability as a predictor for seal. Soil Science Society of America Journal 66: 1603–1609.
- Mandiringana OT, Mnkeni PNS, Mkile Z, van Averbeke W, van Ranste Verplancke H. 2005. Mineralogy and fertility status of selected soils of the Eastern Cape province, South Africa. Communications in Soil Science and Plant Analysis 36: 2431–2446.
- Nciizah AD, Wakindiki IIC. 2012. Particulate organic matter, soil texture and mineralogy relations in some Eastern Cape ecotopes in South Africa. South African Journal of Plant and Soil 29: 39–46.
- Okalebo JR, Gathua KW, Woomer PL. 2000. Laboratory methods of soil and plant analysis: a working manual. Nairobi: TSBF–KARI–UNESCO.
- Ramos MC, Nacci S, Pla I. 2003. Effect of raindrop impact and its relationship with aggregate stability to different disaggregation forces. Catena 53: 365–376.
- Rapp I, Shainberg I, Banin A. 2000. Evaporation and crust impedance role in seedling emergence. Soil Science 165: 354–364.
- SAS Institute. 2012. JMP 10: Discovering JMP. Cary: SAS Institute.
- Shi ZH, Yan FL, Li L, Li ZX, Cai CF. 2010. Interrill erosion from disturbed and undisturbed samples in relation to topsoil aggregate stability in red soils from subtropical China. Catena 81: 240–248.
- Six J, Bossuyt H, Degryze S, Denef K. 2004. A history of research on the link between (micro)aggregates, soil biota, and soil organic matter dynamics. Soil and Tillage Research 79: 7–31.
- Stern R, Ben-Hur M, Shainberg I. 1991. Clay mineralogy effect on rain infiltration seal formation and soil losses. Soil Science 152: 455–462.
- Taboada-Castro MM, LE Bissonnai Y, Duval O. 2004. Aggregate breakdown mechanisms by water in tillage horizons in NW Spain. Paper presented at the 13th International Soil Conservation Organisation Conference, 4–8 July 2004, Brisbane, Australia.
- Unger PW, Jones OR, McClenagan JD, Stewart BA. 1998. Aggregation of soil cropped to dryland wheat and grain sorghum. Soil Science Society of America Journal 62: 1659–1666.
- Valla M, Kozák J, Ondráèek V. 2000. Vulnerability of aggregates separated from selected anthorsols developed on reclaimed dumpsites. Plant Production 46: 563–568.
- Wakindiki IIC, Ben-Hur M. 2002. Soil mineralogy and texture effects on crust micromorphology, infiltration and erosion. Soil Science Society of America Journal 66: 897–905.
- Wuddivira MN, Stone RJ, Ekwue EI. 2009. Clay, organic matter, and wetting effects on splash detachment and aggregate breakdown under intense rainfall. Soil Science Society of America Journal 73: 226–232.
- Zabala MS, Conconi MS, Alconada M, Torres RM, Sanchez RM. 2007. The Rietveld method applied to the quantitative mineralogical analysis of some soil samples from Argentina. Revista Cienciadel Suelo 25: 65–73.
- Zelazny LW, He L, Vanwormhoudt AM. 1996. Charge analyses of soils and anion exchange. In: Sparks DL (ed.), Methods of soil analysis, part 3: Chemical methods. SSSA Book Series no. 5. Madison: Soil Science Society of America. pp 1231–1254.