
Abstract
The grain yield per unit of plant-available nitrogen (N) and sulphur (S) nutrients in the soil is usually low in most crops, including canola. Besides the ability of different crops in utilising nutrients, soil and climatic conditions can also influence uptake and use of major plant nutrients. Hence, to determine the effect of soil and climatic differences on canola agronomic efficiency response to N and S application, a factorial split-plot experiment consisting of three S (0, 15 and 30 kg S ha−1) and five N (0, 30, 60, 90 and 120 kg N ha−1) rates was conducted at selected localities (Altona, Elsenburg, Langgewens, Roodebloem and Welgevallen) in the Western Cape province during the 2009 to 2011 growing seasons. Agronomic efficiencies of N applications were improved if 15 kg S ha−1 was applied, but not with applications of 30 kg S ha−1. Sulphur use efficiency also improved when high N (120 kg N ha−1) was applied. The application of both N and S resulted in higher water use efficiencies at some localities.
Introduction
Nitrogen (N) is often the most limiting factor in crop production (Blumenthal et al. Citation2008) with its application usually being the largest production input cost in most grain crops (Sands et al. Citation2011). Most crop plants may only be able to convert 30–40% of the applied N to grain production (Raun and Johnson Citation1999; Hirel et al. Citation2007). Nutrient conversion rates are even worse in canola (Masson and Brennan Citation1998), with N conversion values of even less than 10% (Malagoli et al. Citation2005; Sylvester-Bradley and Kindred Citation2009). The crop is generally a heavy nutrient feeder, particularly with reference to N and S (Oplinger et al. Citation2000; Hocking and Strapper Citation2001).
Moll et al. (Citation1982) defined nitrogen use efficiency (NUE) as being the yield of grain per unit of available N in the soil (including the residual N present in the soil and the fertiliser). This NUE can be separated into two processes: uptake efficiency and the utilisation efficiency (the ability to use N to produce grain yield) (Lea and Azevedo Citation2006). It is difficult to determine how much N is in the soil and how much is taken up, hence N efficiency can be extended to agronomic use efficiency, which is the increase in grain yield obtained when N is applied as fertilisers (Smith et al. Citation1988). Besides the differences observed in canola genotypes in N remobilisation (Balint et al. Citation2008; Gan et al. Citation2008a), efficiency is also affected by agronomic factors that have an influence on plant morphology and physiology (Hirel et al. Citation2007). Nitrogen use efficiency can also be affected by environmental conditions, such as soil nutrient and moisture levels, temperature and light radiation (Rathke et al. Citation2006). Increasing N application rates have also been shown to reduce its utilisation efficiency, especially at levels beyond 100 kg N ha−1 (Gan et al. Citation2008a).
Canola also shows responses to sulphur (S) because the requirements are four times that of wheat or maize (Abdallah et al. Citation2010). This higher S requirement in canola compared to cereals is ascribed to the higher protein content of these cultivars combined with the higher proportion in brassicas of cysteine and methionine, which contributes to the larger S requirements (Durrani and Khalil Citation1990). However, the canola grain yield response to applied S depends on N application rate (Janzen and Bettany Citation1984), as well as soil and climatic conditions (Ngezimana and Agenbag Citation2014b).
Fertilisation with N and S have been shown to increase yields (Balint et al. Citation2008; Breennon and Bolland Citation2008; Gan et al. Citation2008b; Ngezimana and Agenbag Citation2013), but absorption (Koenig Citation2012), translocation (Malhi et al. Citation2007) and partitioning (Jackson Citation2000) of these nutrients have been shown to be the highest if there is sufficient available soil moisture (Ahmadi and Bahrani Citation2009). The utilisation of available moisture can be described as water use efficiency (WUE), which is the grain yield per millimeter of rainfall received (Perry and Hillman Citation1991). Canola is very prone to water stress (Faraji et al. Citation2009) and water is best utilised when all growing conditions are favourable (Angadi et al. Citation2003). Measurement of WUE can thus be of major importance to evaluate growing conditions and identifying constraints to yield, other than lack of water (Cocks et al. Citation2001).
Canola production and yields per hectare in South Africa are still low compared to the global major producers and efficient fertiliser programs may help to improve both agronomic and water use efficiences, which will result in higher grains yields. For this reason, a study was conducted to determine the effect of soil and climatic differences, as experienced at selected localities in the Western Cape production area, on the agronomic N, S and water use efficiency of canola in response to N and S application rates.
Materials and methods
A factorial split-plot experiment with three S rates (0, 15 and 30 kg S ha−1) as a main factor and five N rates (0, 30, 60, 90 and 120 kg N ha−1) as a subfactor was conducted at Elsenburg (33°51′ S, 18°51′ E; 117 m above sea level [asl]), Langgewens (33°17′ S, 18°40′ E; 91 m asl), Roodebloem (34°22′ S, 19°52′ E; 132 m asl) experimental stations of the Western Cape province of South Africa during the canola seasons of 2009, 2010 and 2011, as well as at Welgevallen (33°52′ S, 18°42′ E; 119 m asl) during 2010 and at Altona (33°42′ S, 18°37′ E; 42 m asl) during 2011. Soil physical and chemical properties at the various locations were as reported by Ngezimana and Agenbag (Citation2014a) with low N and S levels at all localities with the exception of Welgevallen. Nitrogen was applied as limestone ammonium nitrate (LAN) containing 28% N, while S was applied in the form of gypsum (CaSO4.2H2O) containing 16% S. All S was applied at planting. Nitrogen application was done in splits of 30 kg ha−1 at planting and thereafter at 30 d intervals depending on the treatment. The 30 N treatments, for example, received all N at planting, whereas the 120 N treatments received 30 kg N ha−1 at planting as well as 30 kg N ha−1 at 30, 60 and 90 days after planting (DAP). Plots receiving no fertiliser were regarded as the control. At all localities, a planting density of 4 kg ha−1 was used. Canola ‘Stubby’ was planted across all localities in 2009, whereas ‘Bravo’ was used in the 2010 and 2011 seasons.
At crop maturity, canola grain yields harvested from 5 m × 3 m plots were converted to kilograms per hectare. Data on grain yield responses to N and S have been reported previously (Ngezimana and Agenbag Citation2014b). Agronomic use efficiencies of N and S (kilograms seed per kilogram N or S applied) were calculated according to Smith et al. (Citation1988) using the following equations for N and S, respectively:
and
Rainfall was recorded at all localities from 2009 to 2011 during the canola growing season (May to October). In 2009, Elsenburg received the highest total rainfall (May to October) of 568.3 mm, whereas Roodebloem and Langgewens received total rainfall of 339.4 and 285.2 mm, respectively. In 2010, Elsenburg received higher rainfall (442.9 mm) than Welgevallen (426.6 mm), Langgewens (366 mm) and Roodebloem (320.9 mm). During 2011, Elsenburg received a higher total rainfall (325.8 mm) than Langgewens (308.6 mm), Altona (295.9 mm) and Roodebloem (241.5 mm). Total rainfall received was used to calculate water use efficiency (WUE) as grain yield per millimetre of rainfall received using the following equation (Perry and Hillman Citation1991):
Water use was calculated as follows:
This equation was developed for Western Australian conditions (Perry and Hillman Citation1991), which are very similar to conditions in the Western Cape, and most of the trials in this study were also planted in early May and harvested towards the end of October or early November. The equation was therefore considered to be relevant for this study.
Data analysis
Data were analysed with analysis of variance (ANOVA) using Statistica 11 (StatSoft, Tulsa, OK, USA). To compare different soil and climatic conditions and measure response to treatments at different localities, locality was regarded as a factor. As three localities (Roodebloem, Elsenburg and Langgewens) were planted in all seasons (2009–2011), whereas Welgevallen and Altona were included in 2010 and 2011, respectively, data for the three seasons were analysed separately. Main and interaction effects were compared using the least significant difference (LSD) test at the 5% level of probability. Any treatment means found to be significantly different were separated using Fisher's protected LSD0.05 and only statistically significant data are presented and discussed ().
Table 1: Summary of results from ANOVA on use efficiencies of agronomic nitrogen (NUE) and sulphur (SUE), as well as water use efficiency (WUE) during the 2009, 2010 and 2011 growing seasons
Results and discussion
Agronomic use efficiency of applied N
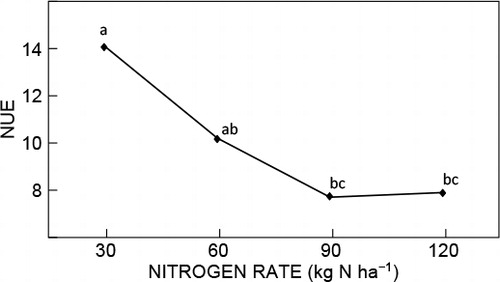
Agronomic use efficiency of applied N (NUE) differed between localities in 2009 with Elsenburg (14.03 kg yield increase per kg N applied) showing significantly higher NUE values compared with Roodebloem (9.53 kg yield increase per kg N applied) and Langgewens (6.50 kg yield increase per kg N applied). Elsenburg received more rainfall, hence higher yield and agronomic efficiency at this locality were observed as canola is sensitive to water stress during the flowering and pod growth phases (Morrison and Stewart Citation2002; Tesfamariam et al. Citation2010).
The NUE decreased with the increase in N application rate from, on average, about 14 kg yield increase per kg N applied at a rate of 30 kg N ha−1 to less than 8 at N application rates of more than 60 kg N ha−1 in 2009 (). Gan et al. (Citation2008b) also reported low N fertiliser use efficiencies at high N fertiliser application rates. In 2009, no significant differences in NUE were shown in comparisons of treatments where no S (11.37) or 15 kg S (12.71) were applied, but a significant decrease was observed when more than 15 kg S ha−1 was applied. This trend was observed at all localities because the soil showed deficient levels of S (Peverill et al. Citation1999) and low soil carbon contents of less than 1% at all localities (Ngezimana and Agenbag Citation2014a) with the exception of Roodebloem.
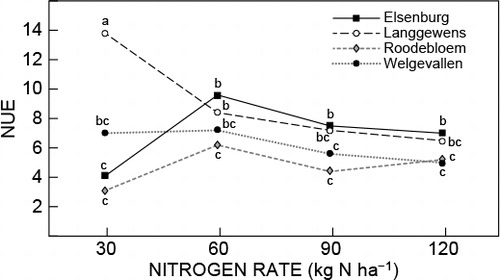
In 2010 a significant locality × N interaction was shown with regard to NUE. This was due to contrasting results at different localities (). At Elsenburg, and to a lesser extend Roodebloem, NUE tended to increase with the increase in N application rate from 30 to 60 kg N ha−1, followed by a decrease with further increases in N rate. At Langgewens, NUE decreased with increases in N application rate, whereas no significant trend was shown for Welgevallen. However, a decrease in NUE with increasing N application (60–120 kg N ha−1) was shown at all localities. Maman et al. (Citation1999) also found that NUE responds differently to an increase in N fertiliser supply at different localities. During 2011, neither N nor S application rate, nor their interactions, had a significant effect on agronomic efficiency of applied N at any of the localities () in spite of low soil S content (Ngezimana and Agenbag Citation2014a).
Agronomic use efficiency of applied S
In 2009, agronomic use efficiency of applied sulphur (SUE) was significantly higher at Elsenburg (22.73 kg ha−1 yield increase per kg S applied) compared to Langgewens (3.15) and Roodebloem (6.46) (). The high SUE values at Elsenburg in 2009 were attributed to the higher and extended period of high rainfall at this locality, because adequate availability of moisture and a lengthy grain filling phase ultimately lead to higher grain yield per kilogram S applied (Hassan et al. Citation2007). Neither N nor S application rate, nor their interactions, had a significant effect on SUE values in 2009.
Table 2: Agronomic use efficiency of applied S (SUE) of canola at Elsenburg, Langgewens, Roodebloem, Welgevallen and Altona, during 2009 to 2011 seasons. Means within a season with the same superscript letter are not significantly different (LSD0.05)
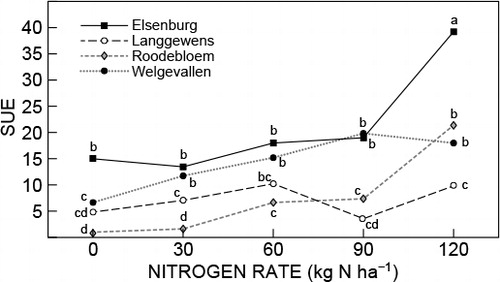
The SUE values of canola at the different localities in 2010 were similar to those of 2009, but results for the different localities were highly dependent on N fertiliser application levels. Although SUE tended to increase with increasing N application rates at most of the localities tested during 2010 (), trends were very confusing. At Elsenburg, for example, SUE initially decreased with increasing N rate from 0 to 60 kg N ha−1, but increased with further increase in N rate. At Roodebloem SUE increased with increasing N rate to reach its highest value at 120 kg N ha−1, whereas the highest SUE value at Welgevallen was obtained with an application of 90 kg N ha−1. At Langgewens SUE values were generally low and did not show a significant response to N application rate. Although these results generally confirmed those of previous research (Fismes et al. Citation2000; Hassan et al. Citation2007), which showed that N fertilisation can improve SUE in canola, differences in response between localities, in spite of low S values at all localities (Ngezimana and Agenbag Citation2014a), suggested that other factors such as rainfall and especially rainfall distribution may also be important.
The SUE in 2010 was also affected by S application rates. Increasing application rates of S from 15 kg S ha−1 to 30 kg S ha−1 resulted in a decrease in SUE from 12.66 to 9.52 kg ha−1 yield increase per kg S applied on average. Although these results suggested that the application of S becomes less effective at rates higher than 15 kg ha−1, application rates of 30 kg S ha−1 may still be economically viable because grain yield still increased with these rates (Ngezimana and Agenbag Citation2014b).
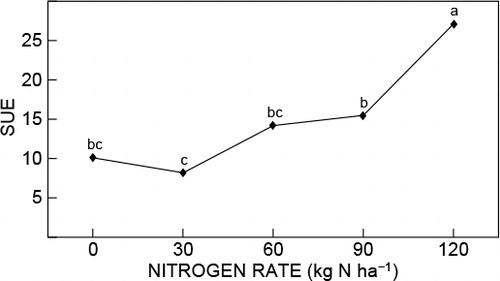
In 2011 SUE was significantly affected by N application () and differed between localities with Roodebloem (19.48 kg ha−1 yield increase per kg S applied) showing significantly higher SUE values than those of Altona (14.66), Langgewens (12.07) and Elsenburg (12.05) (). On average, SUE increased with increasing N rate and the highest SUE value was obtained with an N application rate of 120 kg N ha−1 (). These results indicated that, although SUE is largely affected by locality (rainfall), S can only be used efficiently if N supply is sufficient.
Water use efficiency
Water use efficiencies of canola differed between localities. In 2009 WUE at Elsenburg (6.36 kg grain mm−1 water) was significantly higher than that at Roodebloem (5.34 kg grain mm water−1) and Langgewens (4.64 kg grain mm−1 water) (), due to the better distribution of rainfall during the growing season at Elsenburg (Ngezimana and Agenbag Citation2014b).
Table 3: Water use efficiency (WUE) at Elsenburg, Langgewens, Roodebloem Welgevallen and Altona during 2009 to 2011 seasons. Means within a season with the same superscript letter are not significantly different (LSD0.05)
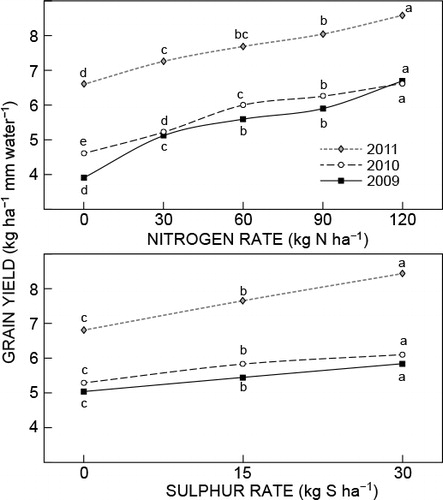
In 2009 WUE increased on average from 3.91 kg of grain mm−1 water with no N (0N) to 6.69 kg grain mm−1 water with an application of 120 kg N ha−1 (). During 2009 WUE also differed significantly due to S application rates at all localities from 5.04 kg grain mm−1 water when no S was applied to 5.84 kg grain mm−1 water with an application of 30 kg S ha−1 (). Soils at almost all localities had low S contents (<6 mg kg−1 soil) and soil carbon contents (Ngezimana and Agenbag Citation2014a), indicating the importance of S fertiliser aplications on soils low in S and carbon.
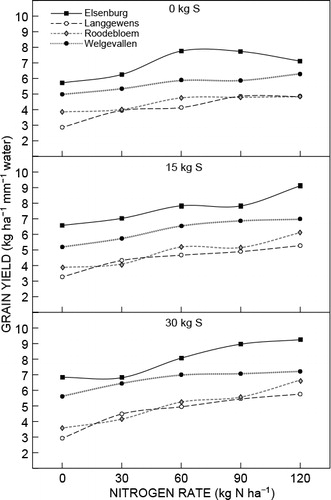
In 2010 a significant interaction with regard to WUE was shown between locality and both N and S application rates, suggesting that responses differed at different localities. However, from it is clear that, although the degree of response did differ, WUE increased at all localities with an increase in N application rate. Responses with increasing N rates were larger at 15 and 30 kg S application rates compared to where no S was applied. These results confirmed those of a previous study (Ahmadi and Bahrani Citation2009) and showed the complexity of canola yield responses to N and S at localities differing in rainfall and, to a lesser extent, soil conditions. During 2011, Roodebloem (12.18 kg rain mm−1 water) had a higher WUE than Altona (9.65 kg grain mm−1 water), Elsenburg (4.63 kg grain mm−1 water) and Langgewens (4.08 kg grain mm−1 water) (). These differences in WUE were most likely due to differences in distribution and total amount of rainfall received during the canola growing season. Rainfall distribution within the growing season is of major importance, because the response of canola to water stress is dependent on growth stage (Ahmadi and Bahrani Citation2009). Gan et al. (Citation2004) reported that canola stressed during earlier growth stages exhibits recovery, whereas if stressed during pod development, most of the yield components are reduced.
During 2011 the highest WUE of 8.5 kg mm−1 water was observed when 120 kg N ha−1 was applied (). This increase in WUE resulted from the increase in grain yields with increasing N application (Ngezimana and Agenbag Citation2014b). Nitrogen fertilisation results in increased absorption and translocation of assimilates and stimulates growth (Wright et al. Citation1988; Koenig Citation2012), hence increasing yield components (Ahmadi and Bahrani Citation2009). Fertilising with S also increased the grain yield per millimetre of rainfall received in 2011 with high S application rates, resulting in a WUE of close to 9 kg mm−1 water () compared to 6.5 kg mm−1 water when no S was applied. Besides N fertilisation, addition of S can have profound effects on canola, increasing the grain yields (Breennon and Bolland Citation2008; Abdallah et al. Citation2010). As with N, S absorption and translocation increased when water is available increasing the WUE of the canola plant when there is an adequate soil S level.
Conclusions
Agronomic efficiencies of N applications were improved if 15 kg S ha−1 was applied, especially in high rainfall areas. Agronomic use efficiencies of applied S were higher when adequate rainfall was available. Moreover, SUE was improved when rainfall was well distributed throughout the growing season, coupled with high N fertilisation (120 kg N ha−1). Although WUE (kilograms grain yield per millimetre of May-to-October rainfall) differed between years and localities, fertilisation improved WUE.
Acknowledgement
The authors are grateful to the Protein Research Foundation for financial support.
References
- Abdallah M, Dubousset L, Meuriot F, Etienne P, Avice JC, Ourry A. 2010. Effect of mineral sulphur availability on nitrogen and sulphur uptake and remobilisation during the vegetative growth of Brassica napus L. Journal of Experimental Botany61: 2635–2646.
- Ahmadi M, Bahrani MJ. 2009. Yield and yield components of rapeseed as influenced by water stress at different growth stages and nitrogen levels. American-Eurasian Journal of Agriculture and Environmental Sciences5: 755–761.
- Angadi SV, Cutforth HW, McConkry BG, Gan Y. 2003. Yield adjustment by canola in different plant populations under semi-arid conditions. Crop Science43: 1358–1366.
- Balint T, Rengel Z, Allen D. 2008. Australia canola germplasm differs in nitrogen and sulphur efficiency. Australian Journal of Agricultural Research59: 167–174.
- Breennon RF, Bolland MDA. 2008. Significant nitrogen by sulphur interactions occurred for canola grain production and oil concentration in grain on sandy soils in the Mediterranean-type climate of south-western Australia. Journal of Plant Nutrition31: 1174–1187.
- Blumenthal J, Baltensperger D, Cassman KG, Mason S, Pavlista A. 2008. Importance and effect of nitrogen on crop quality and health. In: Hatfield JL, Follett RF (eds), Nitrogen in the environment: sources, problems, and management (2nd edn). Amsterdam: Elsevier. pp 51–70.
- Cocks B, Robertson MJ, Cawley S. 2001. Water extraction and water use efficiency of canola in the north. In: Marcroft S (ed.), Proceedings of the 12th Australian Research Assembly on Brassicas, Geelong, Victoria, 2–5 October 2001. Horsham: Victoria Institute for Dryland Agriculture. pp 203–207.
- Durrani FR, Khalil IA. 1990. Chemical composition of Brassica oilseed meal. Pakistan Journal of Science and Industrial Research33: 39–41.
- Fageria NK, Baligar VC, Li YC. 2008. The role of nutrient efficient plants in improving crop yields in the twenty-first century. Journal of Plant Nutrition31: 1121–1157.
- Faraji A, Latif N, Soltani A, Rad AHS. 2009. Seed yield and water use efficiency of canola (Brassica napus L.) as affected by high temperature stress and supplemental irrigation. Agricultural Water Management96: 132–140.
- Fismes J, Vong PC, Guckert A, Frossard E. 2000. Influence of sulphur on apparent N-use efficiency, yield and quality of oilseed rape (Brassica napus L.) grown on a calcareous soil. European Journal of Agronomy12: 127–141.
- Gan Y, Angadi SV, Cutforth H, Angadi VV, McDonald CL. 2004. Canola and mustard response to short periods of temperature and water stress at different developmental stages. Canadian Journal of Plant Science84: 697–704.
- Gan Y, Malhi SS, Brandt S, Katepa-Mupondwa F, Stevenson C. 2008b. Nitrogen use efficiency and nitrogen uptake of juncea canola under diverse environments. Agronomy Journal100: 285–295.
- Gan Y, Malhi SS, Kutcher HR, Brandt S, Katepa-Mupondwa F. 2008a. Optimizing the production of Brassica juncea canola in comparison with other Brassica species, in different soil-climatic zones. Project code: CARP 2004-11. Final report, October 2008.
- Hassan FU, Abdul M, Ghulam Q, Basra SMA. 2007. Effects of sulphur on seed yield, oil, protein and glucosinolates of canola cultivars. International Journal of Agriculture and Biology9: 504–508.
- Hirel B, Le Gois J, Ney B, Gallais A. 2007. The challenge of improving nitrogen use efficiency in crop plants: towards a more central role for genetic variability and quantitative genetics within integrated approaches. Journal of Experimental Botany58: 2369–2387.
- Hocking PJ, Strapper M. 2001. Effect of sowing time and nitrogen fertiliser on canola and wheat, and nitrogen fertiliser on Indian mustard. II. Nitrogen concentrations, N accumulation, and N use efficiency. Australian Journal of Agricultural Research52: 635–644.
- Jackson GD. 2000. Effects of nitrogen and sulphur on canola yield and nutrient uptake. Agronomy Journal92: 44–49.
- Janzen HH, Bettany JR. 1984. Sulfur nutrition of rapeseed. 1. Influence of fertiliser nitrogen and sulfur rates. Soil Science Society of America Journal48: 100–107.
- Koenig R. 2012. Canola nutrient management. Paper presented at the Oilseed crop production workshop, 24 January 2012. Odessa, Washington, USA.
- Lea PJ, Azevedo RA. 2006. Nitrogen use efficiency 1. Uptake of nitrogen from the soil. Annals of Applied Biology149: 243–247.
- Malagoli P, Laine P, Rossato L, Ourry A. 2005. Dynamics of nitrogen uptake and mobilization in field-grown winter oilseed rape (Brassica napus) from stem extension to harvest. Annals of Botany95: 853–861.
- Malhi SS, Johnston AM, Schoenau JJ, Wang ZH, Vera CL. 2007. Seasonal biomass accumulation and nutrient uptake of canola, mustard, and flax on a black chernozem soil in Saskatchewan. Journal of Plant Nutrition4: 641–658.
- Maman N, Mason SC, Galusha T, Clegg MD. 1999. Hybrid and nitrogen influence on pearly millet production in Nebraska: yield, growth and nitrogen uptake, and nitrogen use efficiency. Agronomy Journal91: 737–743.
- Masson MG, Brennan RF. 1998. Comparison of growth response and nitrogen uptake by canola and wheat following application of nitrogen fertiliser. Journal of Plant Nutrition21: 1483–1499.
- Moll RH, Kamprath EJ, Jackson WA. 1982. Analysis and interpretation of factors which contribute to efficiency of nitrogen utilisation. Agronomy Journal74: 562–564.
- Morrison MJ, Stewart DW. 2002. Heat stress during flowering in summer Brassica. Crop Science42: 797–803.
- Ngezimana W, Agenbag GA. 2013. Effects of nitrogen and sulphur on canola (Brassica napus L.) vegetative and reproductive growth under controlled conditions. African Journal of Agricultural Research8: 4887–4894.
- Ngezimana W, Agenbag GA. 2014a. Nitrogen and sulfur effects on macro and micronutrient content in canola (Brassica napus L.) grown on acidic soils of the Western Cape province of South Africa. Communications in Soil Science and Plant Analysis45: 1840–1851.
- Ngezimana W, Agenbag GA. 2014b. The effect of nitrogen and sulphur on the grain yield and quality of canola (Brassica napus L.) grown in the Western Cape, South Africa. South African Journal of Plant and Soil31: 69–75.
- Oplinger ES, Hardman LL, Gritton ET, Doll JD, Kelling KA. 2000. Alternative field crops manual: canola (rapeseed). University of Wisconson Cooperative Extension Service; and University of Minnesota Extension Service, Center for Alternative Plant and Animal Products.
- Perry M, Hillman B. 1991. The wheat book: a technical manual for wheat producers. Bulletin no. 4196. Perth: Department of Agriculture.
- Peverill KI, Sparrow LA, Reuter DJ. 1999. Soil analysis: an interpretation manual. Collingwood: CSIRO Publishing.
- Rathke GW, Behrens T, Diepenbrock W. 2006. Integrated management strategies to improve seed yield; oil content and nitrogen efficiency of winter oilseed rape (Brassica napus L.): a review. Agriculture, Ecosystems and Environment117: 80–108.
- Raun WR, Johnson GV. 1999. Improving nitrogen use efficiency for cereal production. Agronomy Journal91: 357–363.
- Sands R, Westcott P, Michael PJ, Beckman J, Leibtag E, Lucier G, McBride W, McGranahan D, Morehart M, Roeger E et al. 2011. Impacts of higher energy prices on agriculture and rural economies. ERR-123. Washington, DC: US Department of Agriculture, Economic Research Service.
- Smith CJ, Wright GC, Woodroofe MR. 1988. The effect of irrigation and nitrogen fertiliser on rapeseed (Brassica napus) production in south-eastern Australia. II. Nitrogen accumulation and oil yield. Irrigation Science9: 15–25.
- Sylvester-Bradley R, Kindred DR. 2009. Analyzing nitrogen responses of cereals to prioritize routes to the improvement of nitrogen use efficiency. Journal of Experimental Botany60: 1939–1951.
- Tesfamariam EH, Annandale JG, Steyn JM. 2010. Water stress effects on winter canola growth and yield. Agronomy Journal102: 658–666.
- Wright GC, Smith CJ, Woodroofe MR. 1988. The effect of irrigation and nitrogen fertiliser on nitrogen accumulation and water use of rapeseed (B. napus L.). Irrigation Science9: 1–13.