
ABSTRACT
Graphic facilitation is a growing international practice and is often used to describe what professionals do when visually facilitating group processes. Although the professional arena has grown, there is a lack of empirical research in the field, especially regarding long-term perspectives on applying the practice in organisations. This paper aims at investigating employees’ experiences and competence development over time within graphic facilitation. The study followed three employees, first in a 2-day basic graphic facilitation course, then in follow-up interviews, eight months, and two years after completing the course. The empirical data were analysed based on a literature review conducted on long-term perspectives, focusing on three themes: 1. The graphic facilitation practice at individual, group, and organisational level; 2. Contextual knowledge and knowing about the participants; 3. Relation between objects, processes and competencies needed. The findings show that all three employees from different organisations continued to use graphic facilitation and found it valuable for giving new insights and overviews of processes and tasks. The methods aided in creating common ground and goals. The employees activated their contextual organisational knowledge to aid the process and found that being sensitive to various groups’ needs and personal preferences were effective when applying the methods.
1. Introduction
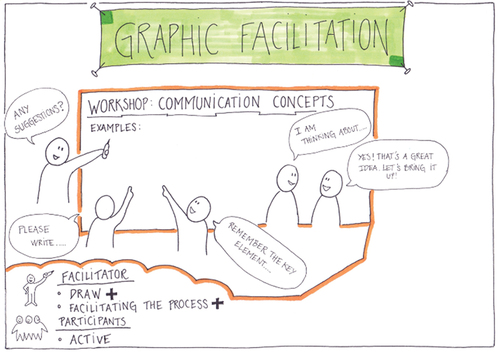
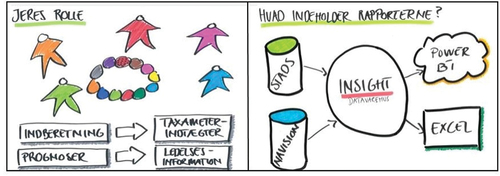
During the recent decades, a larger focus on visual culture have appeared (Mirzoeff, Citation2009) which has also affected the labour market. Boxenbaum et al. (Citation2018) articulate the emergent contours of a visual and material turn in organisations. The researchers describe how complex ideas are defined, made sense of, transported, and stabilised through words but also through visual and material artefacts (Boxenbaum et al., Citation2018, p. 588). It places a demand for the employees to change and develop their competencies in relation to the emergence of new visual practices in companies. Illeris (Citation2003) emphasises how adults must learn rapidly and adjust their competencies in relation to manage complex job functions. Several graphic facilitators offer basic courses for employees introducing simple drawing techniques and visual repertoires for participants to utilise and develop in their own work context (Nørgaard, Citation2021; Qvist-Sørensen & Baastrup, Citation2019). It can be argued that basic courses in graphic facilitation tap into the visual and material turn in organisations that privilege modalities beyond written text, where employees are presented with a visual method to navigate new demands for working visually. Graphic facilitation is often used to describe what professionals do when visually representing group processes (Sibbet, Citation2008; Tyler et al., Citation2005). The method was initially inspired by the ways in which designers and architects utilise visualisations and sketching when working with clients (Sibbet, Citation2001). Some practitioners describe graphic facilitation as analogue drawing techniques, where the facilitator draws on large pieces of paper while involving participants (Tyler et al., Citation2005) as shown in . Furthermore, Valenza and Adkins (Citation2009) argue that graphic facilitation is not about depicting reality; rather it is about representing ideas and icons in real-time that reflect the participants’ contributions.
Figure 1. Illustration of graphic facilitation (own drawing inspired by Nielsen et al., Citation2016, p. 147).
There are many potentials outlined in relation to describe graphic facilitation. For example, one of the founders of graphic facilitation, David Sibbet, emphasises how simple drawing techniques, e.g. Group Graphic Keyboard (Sibbet, Citation2008) can become ‘power tools for effective meetings’ (Sibbet, Citation2010; introduction, xii). Similarly, the author of ‘The graphic facilitator’s guide’ (Agerbeck, Citation2012), describes graphic facilitation as a ‘powerful tool’, which for example helps people feel heard and helps to develop a shared understanding in a group (Agerbeck, Citation2012, p. 10). From an organisational perspective, exploring the implementation of this ‘powerful tool’ becomes interesting.
Even though the professional arena has grown, and facilitators have published several practitioner guides and hands-on books, there is a lack of the long-term perspectives on the employees’ use of the method after completing a basic graphic facilitation course (Hautopp & Ørngreen, Citation2018). In this study, the long-term perspectives involve following employees’ adaption of graphic facilitation in their work practice such as exploring the practical implications, potentials, and barriers over time. The point of departure for this study was a 2-day basic course held by a Danish consultancy, who had expertise in graphic facilitation, in collaboration with a Danish labour union. The participants on this course were members of the union, who signed up voluntarily to gain insights and new competences within graphic facilitation. They were employees who came from different public and private organisations. The aim of our research was to gain knowledge about the long-term use of graphic facilitation after participating in the basic course, at the individual, and organisational level. The study explores how the participants perceive the value of using graphic facilitation in their own work contexts. In the analysis, we apply Schön’s (Citation1983) theoretical framework about the reflective practitioner when discussing the employees’ continuous development of competencies in graphic facilitation. Thus, the research focus is on how the employees adjust their work practice (Illeris, Citation2003) according to their new visual competences gain at the course.
The course was observed, and employees from three different organisations participated in two follow-up interviews, eight months, and two years after completing the basic course in graphic facilitation. The methodological decisions provided an opportunity to follow the employees’ process of adapting the method over time, rather than investigating the use of graphic facilitation in a ‘here and now’ perspective.
In this paper we use the term trainees to denote the people who participated in this specific course, who trained to be graphic facilitators, and who are the key informants of our research. This is done to distinguish the trainees from the concept of participants, which often is used to refer to the participants in a graphic facilitation process, i.e. the trainees’ work colleagues who participated in meetings and workshops held by the trainees.
The empirical data were analysed based on a literature review conducted on long-term perspectives, focusing on three themes: 1. The graphic facilitation practice at individual, group and organisational level; 2. Contextual knowledge and knowing about the participants, and 3. The relation between objects, processes and competencies needed. Moreover, the first synthesis of the interviews showed that it was relevant to include an analysis and discussion of the various approaches to graphic facilitation identified in the literature.
Consequently, this paper investigates two aspects of graphic facilitation in long-term perspectives. 1) The impact of a basic course on trainees’ facilitation practice over time. 2) The various ways the method is applied and the impact at the individual, group and organisational level.
2. Approaches to and the long-term perspectives of graphic facilitation
As the study revolves around the values, effects and impact that graphic facilitation has in a long-term perspective we have made a specific investigation into the existing literature with these concepts in mind. A systematic search was conducted in ProQuest and in Harzing (Citation2020) using Google Scholar from 2016 to present, inspired by the format called ‘State of the Art & Qualitative systematic review’ in the terminology by Grant and Booth (Citation2009, pp. 94–95). The search term used was Graphic Facilitation (truncated to graphic facilitat*) which was either part of the title or abstract, and where one of the following terms occurred anywhere in the paper (i.e. including the body of the paper): effect (truncated to effec*), impact or value. As there was a need to align research that applied the term Visual Facilitation, a similar search was made with this concept (i.e. searching with ‘visual facilitat*’ in title and abstract AND (effec* OR value OR impact) everywhere in the paper).
The existing literature on graphic facilitation aided us in the identification and investigation of various approaches and how they are practiced. The intention was to provide insights into which factors (concepts and findings) are described and furthermore to use these in the analysis of the empirical data of our own study. In this section we describe perspectives on the long-term perspectives on value, effect, and impact in Section 2.1 Likewise, we identify different approaches to graphic facilitation in Section 2.2.
2.1. On value, effect, and impact
When reading the existing literature, we found only a few examples that explicitly works on the long-term perspectives, and only few that are rigorously research-based evaluations. However, some papers do provide insights into their evaluation. For example, North et al. (Citation2020), used graphic facilitation to illuminate nursing practices in the context of mothers, care and hospitalised children. Here, they iterated through activities of observations incl. photo elicitation, as well as interviews and focus groups with the use of graphic facilitation. Postgraduate nurse researchers carried out the research, where they together had local knowledge and experiences of applying graphic facilitation. The study investigated long-term practices of care, but it did not evaluate effects of graphic facilitation explicitly. However, the authors do point to advantages, when involving both nurses and mothers via these methods. They argue that the methods provide a different way for giving participants a voice: ‘(…) we believe it is the first time that nurses have been involved in describing these distinctive nursing practices and articulating the underlying rationales and values’ (North et al., Citation2020, p. 10). They found that graphic facilitation aided in illuminating existing practices and enabled parents to tell stories about earlier experiences they had about being hospitalised with children. According to the authors, the method provides a valuable way for participants to connect experiences from a specific context and relate this to other similar experiences in the past.
In another paper, Smith (Citation2014) reports from years of practice in The Grove, a company founded by David Sibbet, which has worked extensively with graphic facilitation. Smith focusses on the experience with the method used in hybrid- and virtual meetings. The paper provides theoretical perspectives to the concepts: value, effect and impact, followed by brief use cases described at a vignette level. This makes the experiences concrete, but the description is on a general level, making it difficult to relate empirical data to specific contexts and findings. The author describes that they used post-engagement surveys and conversations with clients to inform the results, but it is not clear if these were made immediately after or from a long-term perspective. It is however interesting that Smith (Citation2014) found graphic facilitation to overcome challenges in virtual meetings, as the method increase participants’ engagement and effectiveness. According to Smith (Citation2014) the method can also positively impact, what she defines as ‘the collaborative bandwith’ for participants when engaging in virtual and hybrid meetings.
In a qualitative study, with students (age 5–21) having a very high level of special needs, Espiner and Guild (Citation2012) applied graphic facilitation in a combination with a facilitation method called ‘Circle of Courage’. At a meeting, a facilitator and a graphic facilitator (i.e. in this situation two facilitators are often present) talks with the student, the parents and residential caregiver. The dialogue is based on a pre-drawn template illustrating the circle of courage, which the graphic facilitator adds to and draw on based on the conversation as it unfolds. The facilitator talks to the student first, and then parents and residential caregiver can add, and they open for a group discussion. The facilitation process is described as first explorative, as exploring a specific subject or activity. Then the visuals and the facilitation are structured into a planning process, as how can this subject or activity be best carried out for this specific student and his/her context (parents/caretakers). At the end of the meeting the plan is narrated as a visual programme to follow, and the visual is brought home, as a reminder of the collaborative agreement. In this research, it was an independent evaluator, who interviewed parents and teachers after the sessions. However, it is unclear how long time after the graphic facilitation process this evaluation was carried out. The advantages found were among others: Increased engagement and insights into the topic of the meeting for both the student and other participants; Process was ‘comfortable’ and parents and caregivers felt that their roles were more valued; Supported relation between learning at school, at home and in the community and parents liked that it gave a picture of an encouraging future (Espiner & Guild, Citation2012).
In another health-related context, Sandholdt et al. (Citation2022) conducted a collaborative study using graphic facilitation. Researchers were present over three years in what they frame as an ethnically diverse and disadvantaged neighbourhood. Adult residents (+45 years) participated in two phases of health promotion interventions. In the first phase, a design workshop was held, resulting in residents choosing social outings. Five additional meetings were led by the graphic facilitator using a visual template. The second phase aimed to empower residents by inviting them to share their stories, about experiences with living in the neighbourhood during the COVID-19 pandemic. They shared via interviews with the researchers, which were transcribed. The graphic facilitator observed the interviews, and made preliminary sketches, which were shown to the participants at the end of the interview. The facilitator used the material and sketches to create visual representations, the researchers made the written stories, and all were published in a book and posters. The study used the ladder of participation to evaluate residents’ control and engagement. The authors found that the facilitator’s drawings encouraged dialogue and reflection. Sandholdt et al. (Citation2022) argue that co-design and participatory approaches in phase 1 effectively engage residents, fostering ownership and facilitating dialogue rooted in the local context. The approach successfully obtained input from a vulnerable population.
In a large-scale setting of working with 400 participants at a multinational conference over 12 days, with 70 different nations, Tyler et al. (Citation2005) reports on how graphic facilitation and graphic recording was used as a dialogical support tool in relation to the theme of the conference: Sustainability. Ten graphic facilitators participated, and a visual template to be used at the conference was developed over 1 year, incl. two field tests. During the conference it was primarily the facilitators who did graphic recording, but participants engaged and asked facilitators to add changes in the breaks. During the breaks it was observed that the facilitators’ drawings were used for further dialogues in small groups, and that participants created their own drawings on the blank paper available in the hallways. This allowed participants to convey their own story. In the paper the authors’ report from their own reflections, as members of the organising group, but the study do not include participant evaluations. In this perspective, they found that the graphic facilitation formats required deep listening and an extra effort to create visuals that were cultural and diverse sensitive. They requested participants to bring attention to ‘incorrect’ or inappropriate drawings, which they argue established a self-corrective feedback loop. They also found it effective, when they shifted the focus of the group from first individual reflection to small group dialogue, and then to large group sharing, and found the process influences the energy resonating in small and large groups (Tyler et al. Citation2005).
In a relational field to graphic facilitation, Degnegaard (Citation2018) has in her PhD project investigated how strategic visualisation (SV) can be used to enable powerful processes in organisations. Based on current literature on SV with a lack of connection to operations in practice, Degnegaard advocates for an approach to using SV as both a process tool and an end product. In several case studies, Degnegaard implement SV in different co-creation contexts, e.g. in the Police and in the public sector in Denmark. Summing up across cases, the research study shows how strategic visualisation can act as design vehicle for co-creating shared business models by 1) creating clarity and overview of complex matters, 2) communicating complex matters in an artful and delightful manner, that promote an informal relation between partners, and 3) supporting involvement and engagement in the specific topic (Degnegaard, Citation2018, p. 51). In this way, the combination of SV, co-creation, business model innovation and design research provided value and impact for the participating organisations. Within the field of SV, there is scarce investigation into where the boundaries of SV are and where other disciplines start, e.g. graphic facilitation (Degnegaard, Citation2012, p. 26). The unidentified boundaries are also the reason why we have incorporated perspectives from the research study in this paper.
In general, our reading shows that peer-reviewed research offers limited long-term perspectives on the use of graphic facilitation. In general papers did not describes whether they explicitly returned to their study after how long time, and if they explicitly asked participants to reflect on the experience and its consequences. We can on the other hand derive three specific factors, which we find have an explicit longitude perspective, and may influence the value and effect of graphic facilitation processes as seen over time, which we will use in the analysis. The three found factors will be applied to our data analysis:
The graphic facilitation practice at individual, group and organisational level – several of the papers point out how graphic facilitation processes can create dialogue at all levels but can also support transitions between these levels. A relevant question is how these levels influence the graphic facilitation process and how transitions manifest themselves.
The contextual knowledge and knowing about the participants – several of the papers find that such knowledge can be important to performing the role of graphic facilitator and the graphic facilitation process adequately. A relevant question becomes whether or when this knowledge can be in general form, such as knowledge of a profession or area of work, or whether specific knowledge is important, e.g. about the specific organisation or persons, as well as whether processes facilitated by someone far from the context can have other advantages.
The relation between objects, process and competencies needed – the papers highlight the visual, drawing and graphic practices, and less is said about the facilitation process and competencies needed. From reading the papers it seems that the use of graphic facilitation with a handicapped person and his/her support staff and family may be different from a process with a group of employees, even though all aim at supporting a future change in the specific context.
2.2. Approaches to graphic facilitation
Besides factors that influence in a long-term perspective, our research also intends to investigate which practices are used when doing graphic facilitation in organisations. A graphic facilitator can take on different roles in a visual practice. For example, among the five papers presented above, Tyler et al. (Citation2005) elaborate how the facilitators worked as graphic recorders and in North et al. (Citation2020) the facilitators were also researchers collecting and analysing data. In this present research study, we focus on the facilitator’s role as both drawer and facilitator involving participants at e.g. meetings and workshops, which Smith (Citation2014) also does. Smith (Citation2014) elaborates how graphic facilitation includes three central components: the facilitator, the participants and the visual display. She further emphasises that the interplay between the components is crucial in graphic facilitation:
As in any meeting, the facilitator and the participants interact with each other. However, each also interacts with the visual display: the graphic facilitator creates it and uses it as a facilitation tool, and the participants interpret, reflect on, and sometimes add directly to it.
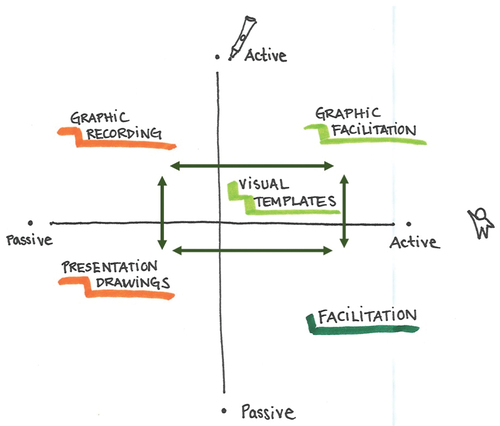
Nielsen et al. (Citation2016) have characterised different approaches that the facilitator can use to interact with both the visual display and participants. The authors describe four different visual formats for the facilitator to use in meetings: graphic recording, presentation drawings, visual templates and graphic facilitation (Nielsen et al., Citation2016, p. 147). Besides the graphic facilitation format shown in , the other three formats are illustrated below in .
Figure 2. Illustration of different visual formats for the facilitator to use in meetings (own drawing inspired by Nielsen et al., Citation2016, p. 147).
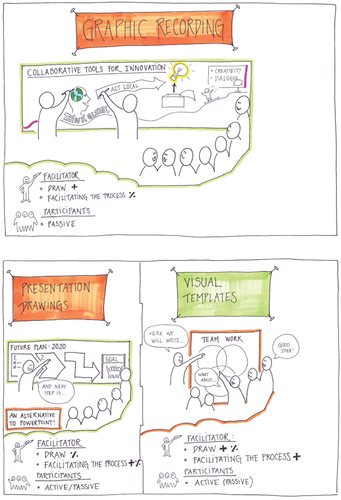
The visual formats explain how the two roles of being the facilitator and the drawer can vary on a continuum from passive to active in the four different formats. For example, when doing graphic recording the facilitator is an active drawer, but passive in the role of facilitator as s/he does not interact with the participants, who are also placed in a passive role during the meeting. When using presentation drawings, the facilitator has made the visual display before the actual meeting, which places him/her in a passive drawing role during the meeting. Depending on the involvement of the participants during the meeting, the role as facilitator is also more or less passive when using presentation drawings. Using visual templates involves a semi-active role as drawer, as some part of the visual display is made beforehand and other parts will be made during the meeting. Here the facilitator takes an active facilitator role, involving participants in adding points to the visual display. When doing graphic facilitation, the facilitator takes an active role in both drawing and facilitating the meeting, involving participants in developing the visual display.
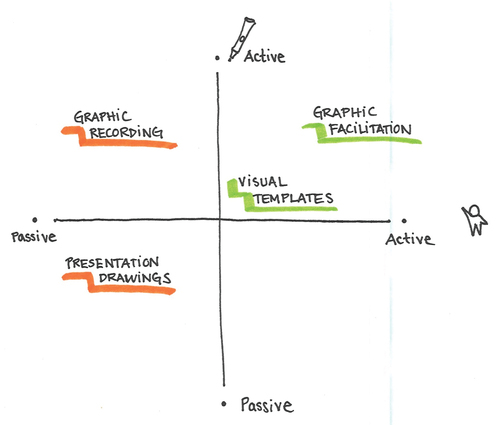
Nielsen et al. (Citation2016) emphasise that the division of the four visual formats can seem artificial when in practice the same drawing and facilitation session can contain several of the formats. We find this perspective relevant to bear in mind; however, we also find the division interesting as a way to analyse if and in which ways the trainees in this case study actualise different visual formats in their own daily work after completing the basic course in graphic facilitation. In , the two related actions passive/active as a facilitator (horizontal) and as a drawer (vertical) are inserted, with the four concepts of Nielsen et al. (Citation2016) placed according to these two actions. Here, the colours (orange and green) relate back to the colours used in .
Figure 3. Illustration of a continuum of passive/active facilitator role (horizontal) and a continuum of passive/active drawer role (vertical) and how the different visual formats can be placed.
Smith (Citation2014) argues that the graphic facilitator uses listening and process design skills to take in the participants’ ideas and facilitate their interactions and at the same time the participants see the emergence of visual display and draw on their own visual language to interpret it. Researchers also argue that individuals need to develop competencies in both designing visual languages for others to understand and learning to interpret the visual texts created by others (Bowen et al., Citation2015). In this case study, the role of the drawer (production of visual displays) relies on the facilitator, but the interpretation and understanding of the visual displays can be seen as a shared action and responsibility between the facilitator (in our case the trainees) and the participants. Thus, it becomes evident to analyse how the trainees reflect on their colleagues (participants) responses to the visual formats. For example, do the participants find the trainees’ use of graphic facilitation valuable and which impact does it have in their daily work.
3. Research design
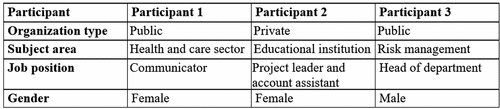
The empirical data of this study includes participatory observations made during the 2-day basic course in graphic facilitation and interviews (Creswell, Citation2012) with three trainees and their organisations – eight months and two years after completing the course. Below is an overview of the three trainees:
As shown in , the trainees came from different organisations (private and public) and signed up for the course to gain insights and new competences within graphic facilitation. The trainees in our study were selected based on voluntary participation, representing diverse backgrounds and positions within their organisations. While the empirical background may not be exhaustive, it serves as a stepping stone for further studies, which we will revisit in the conclusion.
Figure 4. Overview of the trainees participating in the study.
One author of this paper (Researcher 1) gathered the empirical data, which was transcribed, analysed and discussed in collaboration by the two researchers and authors of the paper. The literature review was conducted as described in Section 2, and primarily carried out by the other author (Researcher 2) in terms of searches and organising, but similarly a collaborative approach to analysis and writing was used. First, Researcher 1 did participatory observations and annotated drawings during the basic course in graphic facilitation. Thus, she experienced the progress of the course as well as which drawing techniques and activities the trainees were introduced to in the basic course. Secondly, Researcher 1 functioned as an interviewer in the follow-up interviews focusing on the trainees’ use of graphic facilitation beyond the course. The main empirical data are the interviews focusing on the long-term perspectives on using graphic facilitation, which were video-recorded and afterwards analysed by the authors/researchers, drawing on thematic analysis (Braun & Clarke, Citation2006). The first interview with each trainee had a duration of 1–1 ½ hour and the second interview with each trainee had a duration of ½ − 1 hour. The video recordings enabled us to capture and analyse the interaction taking place, both in terms of how the interviewed trainees interacted with the drawings that they brought to the interview and in terms of body language, and facial expressions. Moreover, the video recordings also supported the documentation of our following elicitation approach.
As drawings are a central part of the subject matter, it is natural to include this format as an elicitation device in the exploration of trainees’ use of graphic facilitation in their own work contexts. This approach is inspired by photo elicitation. Photo elicitation is based on the simple idea of inserting a photograph into a research interview (Harper, Citation2002). Harper further elaborates that even though most elicitation studies have been conducted with photographs, other visuals can be used such as e.g. paintings, cartoons, and public displays such as graffiti or advertising billboards. In this study, photographs of the trainees’ own drawings were the visual point of departure in the interviews. Below in , is an example of a drawing shared by a trainee in the interview situation. The trainee had used the drawing in facilitation of a meeting facilitation with colleagues.
Figure 5. Two drawings shared by a participant in the interview on long-term perspectives (Hautopp, Citation2022, figure 22, p. 61).
The use of photographs taken by participants provides access to different types of knowledge, including tacit and experiential knowledge (Milne & Muir, Citation2020). As Wang (Citation1999, p. 86) notes, this approach honours knowledge grounded in experience, and gives an alternative to positivist ways of knowing by listening and learning directly from people’s portrayal of their own lives, concerns and experiences (in: Milne & Muir, Citation2020, p. 5). Wang’s notion of ‘honours knowledge grounded in the experience’ is crucial when we later explore how the photographs of the drawings triggered memories of the trainees’ production of the drawings e.g. in which context were the drawings used? Who was involved in the process? Which conversations did the drawing lead to?
By using photo elicitation as a method to enhance the interview situations, we aimed to place the participants in a situation where they through visualisations were prompted to reflect upon their own practices. The theoretical point of departure for discussing the reflective processes that the participants enter into in the interview situations is inspired by Donald Schön’s concepts about ‘the reflective practitioner’ (Schön, Citation1983). Schön takes a pragmatic perspective on learning where theory and practice are viewed as intertwined, with the addition that our actions in everyday life are often tacit; implicit in our patterns of actions and in our feel for the things with which we are dealing. He refers to this as our knowing-in-action (Schön, Citation1983, p. 49). At the same time, Schön emphasises that we often think about what we are doing while we are doing it. He refers to these thinking processes as ‘reflection-in-action’: ‘It is this entire process of reflection-in-action which is central to the “art” by which practitioners sometimes deals with situations of uncertainty, instability, uniqueness, and value conflict’ (Schön, Citation1983, p. 50).
The trainees in our case had all been introduced to some new drawing techniques and facilitation practices to apply in their work contexts. We wanted to investigate how they perceived and experienced these ways of working while reflecting on their knowing-in-action. Schön argues that practitioners’ reflection-in-action is bounded by the ‘action-present’, the zone of time in which action can still make a difference. He further describes this kind of reflection and experimentation as the practitioner’s ‘on the spot experiment’ (Schön, Citation1992, p.16). In our case, we perceive the participants’ actions as ‘on the spot experiments’ where they reflect on the use of graphic facilitation in the situation currently adjusting their action at e.g. a meeting with colleagues. Based on this view, we invited the trainees to review situations from their work contexts where they have used graphic facilitation. When we prompted the trainees to bring drawings into the interview situation, the purpose was to open up for their tacit knowledge and reflection-in-action about the specific situation where the drawings were used. Likewise, the interview situation allowed for a broader reflection on action in relation to how the trainees perceived and experienced their use of graphic facilitation in their work contexts. In the specific interview situation, the drawings were used as recall experiences (Pink, Citation2007) of ‘action-present’ where the trainees reflected upon their use graphic facilitation.
As the dialogue in the interviews took a point of departure in examples of drawings from the participants’ daily work, it is relevant to address how we approached the visual data after collection. Pauwels (Citation2006) states that visual research concerns not only a study ‘about’ the visual, but also working ‘through’ visuals and visualisations. Pauwels and Mannay (Citation2020) emphasise three different foci of visual research: the Production Context, the Visual Artefact or Phenomenon and the Utilisation Context. The authors further elaborate that it is relevant to consider which of these elements are the focus of the analysis. In this study we do not enter into a thorough or detailed analysis of the visual artefact, e.g. an aesthetic evaluation of the specific drawings. Instead, the focus will be on how the trainees articulated their production context and utilisation context as these reflections concern how they implemented drawings in their facilitation processes and how they experienced the processes.
4. Analysis
From a long-term perspective, we commence the analysis with a description of the basic graphic facilitation course as a point of departure for the employees’ competence development within graphic facilitation. This knowledge supplies the basis for the analysis of the trainees’ movement from the graphic facilitation course to applying the method in their own working contexts. This movement is subsequently analysed according to the themes identified in the review in Section 2.1: From individual, to group, to large assemblies or organisational level; Contextual knowledge and participants’ knowledge; Relation between objects, processes and competencies needed, and from Section 2.2. Approaches to graphic facilitation ().
4.1. The course – format and experiences
The 2-day basic course was held by a Danish consultancy company with expertise in graphic facilitation in collaboration with a Danish labour union. Fourteen days prior to the basic graphic facilitation course, the course participants (the trainees) were asked to send a description of a specific situation from their daily work where they would expect to use graphic facilitation. The specific situation should occur within a period of 14 days after completing the course.
The first day of the course started with initial individual and collaborative drawing exercises such as a ‘Draw and Guess’ game, drawing a group icon, drawing and sharing your own life story, etc. These exercises were phrased by the teacher to show that ‘The participants already have a visual vocabulary without practicing specific drawing competences’. This focus can be related to what Schön (Citation1983) describes as knowing-in-action, where participants draw on previous experiences of drawing and expressing oneself visually. After the initial drawing exercises, the teacher introduced different drawing techniques and theory within the field of graphic facilitation, which the participants practiced alongside the introduction. Post-Its with drawings were collected and mounted on the wall, as a shared resource of icons.
The second day of the course started with a further development of the joint icon bank before the trainees were tasked to prepare a visual template to use in the specific situation they had described in the preparation for the course. Based on derived experiences from the course, the trainees showed appreciation for working with a case that targeted their own work context and they all re-used their visual template from the course in their daily work after completing the course. As one trainee reflected in the first interview: ‘It made really good sense that we had time to make something that you could hopefully use yourself. So I don’t think I started from scratch when I came home. It was not like I was going to go out and invent it all’. Thus, it can be argued that the trainee had an expectation of using the method in their organisational practice and found it valuable that the activities from the course were directed towards the trainees’ own working contexts.
In the interviews, the trainees expressed their excitement about graphic facilitation during the course and shortly after with statements like: ‘So on the first day I was breathtaking, sitting the entire evening and night drawing little men and plans on paper’ and ‘So I was on quite a high after the course’. These findings indicate that the trainees initially found the method of graphic facilitation valuable for their work. On the other hand, in an interview a trainee also talked about how it could have been useful if the course had run over a longer period. Therefore, the question becomes, did they actually work with the method subsequently, and if yes, how did they work with it and what were the effects and values they experienced at an individual, group, and organisational level.
4.2. The individual, group, and organisational level
The analysis shows that the trainees still worked with graphic facilitation at the time of the interviews, eight months and two years after completing the basic course. All trainees had used graphic facilitation to visualise different scenarios with the aim of introducing colleagues to job tasks. For example, they used visual templates to guide decision processes: ‘It was important at this workshop that a decision was made about the process around it. And is actually what this drawing was meant to guide through’. Furthermore, the visual templates were used to give an overview of complex processes.
One trainee explained how she had used graphic facilitation in implementation processes with people who are not her immediate colleagues, but belong to other parts of the organisation, where a new IT system was tested with users: ‘Because we have done a test run, where we have had some users, where we sort of wanted to sell the idea of these new reports and this new reporting platform’. Here, she refers to her colleagues’ expression of appreciation. They found the process worked well, and that it gave something different than working with traditional slides and screenshots from the IT system. The trainees also experienced co-workers, managers, and even external consultants, who saw their visual work when passing through the office, and on boards, appreciating the work.
Although pre-drawn templates were predominantly used, there was a tendency to more in-situ drawings in the latter interviews. For example, a trainee applied graphic facilitation standing at a board with a new colleague explaining a reimplementation process of a budget system: “But there are parts of it, where he did not have the professional knowledge, where we have just drawn and narrated in relation, about how things are connected”. Such small group sessions seemed to open for new insights: “it has also been good to stand in front of the board and get things drawn. So, we can see what it is, and move things around a bit, if there was something that occurred to us further down the road”.
The participants articulated that graphic facilitation is a way to show different sides of their academic competences. One participant explained how she uses graphic facilitation to show more creative and intuitive sides which she: ‘earlier [had] missed as academic competences can be hidden’. Another participant emphasised how he likes ‘humoristic and informal’ atmospheres at meetings, which he experiences that the use of graphic facilitation can support. Thus, it can be argued that graphic facilitation is a way for him to show a humorous side of his profession, and that it to some degree alters the dynamic of meetings on a group level. Interestingly on a more individual level, it is seen how these competences transfer into other arenas of the trainees’ lives, during leisure time, such as in housing committees: ‘now I also use it privately, now it’s kind of second nature to me’.
Summing up, all trainees had commenced the use of visuals in their daily work, primarily in the form of presentation drawings and later also applying visual templates and graphic facilitation in smaller groups. The trainees saw the practice as valuable for giving insights, providing overviews, and guiding decision-making processes. Moreover, at the individual level, the method had a positive effect, as a tool that allowed the trainees to show creative aspects of their academic competences and supported a humorous and informal atmosphere at meetings. On a group and organisational level, the trainees reported that colleagues, managers, and external partners found the process of graphic facilitation valuable and meaningful.
4.3. Contextual knowledge and knowing about the participants
All the trainees emphasised that their colleagues met their utilisation of graphic facilitation positively. One participant explains how his utilisation of graphic facilitation has become a crucial way for him to work and it has also become recognisable among his colleagues: ‘More and more of my colleagues have seen these small scribbles that we make, where it spices up a meeting invite, or it comes up when you stand and do something for a meeting or present on a wall-board. That you just jot something down in this style, with these tools’. This has led to the participant’s colleagues perceiving him as the ‘go to guy’ on these matters: “Oh, you’re so good at drawing; Can you just draw, or we have to show this or that … , so I have become a supplier to other people’s meetings”.
In relation to their new practices, all trainees reflected upon how their utilisation of graphic facilitation is acknowledged by their colleagues internally in their organisation, and they see this as providing everyone with new insights. For example, a trainee articulated how the use of graphic facilitation results in: ‘that the meeting participants acquire a broader understanding of a process from a to b’ and that his colleagues appreciate the variety in presentation formats where the drawings differ from e.g. PowerPoint slides or screenshots. Another trainee elaborated how she facilitated a workshop with colleagues to foster ideation of a new project. This process supported the group to discuss the purpose and vision of the project. Based on knowledge of the context and targeting the participants in the workshops, the trainee prepared some simple icons for discussion ahead of time, which were further developed in the workshop. In order for graphic facilitation to have value in the organisation, the trainee argues for a long-term perspective:
It is important to think strategically, or with a longer-term perspective, if you want to find a concept of ‘dementia friendliness’, for example. When it is to be used in the long run, and therefore it must also be able to make sense in a longer perspective. It is also relevant not just to use the same icon about something else, e.g. heart, as the meaning will then go away.
In relation to the utilisation context of graphic facilitation, the trainees considered how they target the method to the concrete contexts and participants in their meetings. For example, graphic facilitation was used to give an overview of the data flow in a project, but not the technical explanation behind, as this was not of interest and relevance to the participants. At the same time, the graphic facilitation used at a meeting with accountants were supplemented with spreadsheets: ‘Because unfortunately they are not satisfied enough with just getting a drawing, which could otherwise have been great [laughs]. They would like some documentation in Excel’.
Another trainee also addressed how the participants in her meetings have different preferences, where the use of graphic facilitation meets the specific needs: ‘There are also several of my colleagues who, for various reasons, are not so fond of very long written pages, so there it is good’. The trainee further elaborated on how the introduction of different working tasks becomes more efficient with the use of graphic facilitation. However, she is also aware that some participants might opt out when drawings are introduced as part of the dialogue at meetings:
… there are also some who dissociate from drawings. That is, where there are some who dislike the long lists and the many words, and the written word. Then there are also some who … uh … shun drawings. So this time, I didn’t do it. I may do it next time.
The trainees receive a lot of positive feedback and reinforcement of the methods, but there are also participants whose preferences lean towards written language or a need to see the inclusion of tools from their own professional trades, e.g. Excel sheets with the accountants. Likewise, one trainee reflected that even though graphic facilitation has become a well-known part of her work in her own organisation, at the external organisational level she can see some conflicts in using the method: ‘Regarding our internal communication, people are open and have got used to GF [graphic facilitation]. In the external communication outside the organisation, there are still some written formalities that must be met’.
Summing up, all trainees found that their new way of facilitating meetings has positioned them as graphic facilitators, who bring value to colleagues by assisting with their meeting facilitation through visual approaches. The trainees utilise their contextual knowledge about the organisation to aid the process, and graphic facilitation is used as a way to create an overview of new work tasks in particular, and to create common ground and goals. They have also become sensitive to different group needs and participants’ preferences, including those who do not find drawings useful in the process. Here, the trainees showed nuanced perspectives on the use of graphic facilitation.
4.4. Relation between objects, processes and competencies needed
The analysis shows that all three trainees have established a graphic facilitation practice. However, they also explained that it was a delicate and difficult process to begin with; a process requiring courage: ‘The first time I had made them [drawings] on the big flip-over, it was a bit transcending. Because it’s about, that it’s something you’ve made yourself, it’s still a little more of oneself than a PowerPoint’. And as another trainee expressed:
So, it’s simply a matter of practice that’s lacking and then courage. I think, that is, the courage to throw oneself into it and perhaps not be so afraid of whether people can see what it looks like. I think I’m probably a bit of a coward, when it comes to this
As the abovementioned examples show, the participants articulated how they primarily and in particular to begin with only used graphic facilitation in the form of pre-made visual templates that they use to facilitate a dialogue with colleagues at the meetings or workshops. When the participants expressed why they primarily use pre-made drawings and templates, they explained that they do not feel ‘good enough’ or ‘quick enough’ to draw in situ in front of their colleagues. As one trainee expressed: ‘I had drawn it beforehand, yes. And I had that because my ability to draw is still not where it’s something I throw myself into to doing, not in a big way at least.’ And similarly, another trainee expressed referring to the drawings in the interview: ‘These are some I drew in advance. I do not think I have [laughs] enough belief in myself that I can get it drawn fast enough … ’
The analysis shows how the production of these visual templates supported the participants’ knowledge about what was ‘at stake’. The process gave them an overview of where they were with the task at hand, about what was important to discuss at the upcoming meeting, as well as about the structure that this meeting could have. As one trainee explains: ‘If I had just made a standard PowerPoint presentation, then there would have been much more text. And this way, it [graphic facilitation] is a good way for me to think about how much is necessary to represent the points?’ Thus, the participants emphasised that their preparation of meetings had changed compared to their previous preparation e.g. by making more text-based PowerPoints.
In the later interviews after two years, it is seen how all three trainees found that they have acquired competencies over time, and experiences in using different types of objects and processes. For example, they apply different types of materials, analogue as well as digital tools, such as drawing on boards, flip-overs or using drawings in their PowerPoint presentations. It is also seen that they experiment and develop their own processes over time. One trainee for example explained: ‘What I sent to you was made on a flip-over, where I went through how this test was put together, what was expected of them, why it was important that they should test some things. And it has then become PowerPoint presentations.’ Another talked about how she uses the board more spontaneously now, when she is introducing tasks to colleagues. The third trainee describes a process he found comfortable, in the move from pre-drawn handouts, to more in-situ drawings based on prepared sketches:
… I think it’s hard to start with the right outline, so therefore I have to, just like when you make a regular PowerPoint presentation and think things over, […] I have to think things over and then [make] just a small raw sketch on an A4 [sheet of paper] that I have lying next to me. But I’m working on it and hoping it gets better.
Summing up, the analysis shows how the trainees experience the graphic facilitation style used in the course as a simple way to get started with visualisations as part of their professional work. However, they all expressed that the use of graphic facilitation after the training course takes courage and practice in order to maintain and develop competencies. Nevertheless, all of them are still active and spend time on internalising and improving their practice, applying different objects and processes. They started off with pre-drawn templates and have all moved into more in-situ graphic facilitation as well, often based on prepared sketches. They all apply effort and see the value of explicitly planning for their use of graphic facilitation in their work, and some are also beginning to see the effect of using it in more spontaneous processes.
5. Discussion and results – approaches to graphic facilitation
To begin with, the participants found they lacked confidence in their own drawing abilities when facilitating and drawing in the meeting. As mentioned in the analysis of the course (Section 4.1), the trainees showed appreciation of working with a case that targeted their own work context and all three re-used their visual template from the course. However, one of the trainees suggested that it could have been useful if the course had run over a longer period. Perhaps utilising a more theory-practice relation, with a follow-up-session, switching between course and practice, could have made the process less difficult and delicate on a personal level. Another option could be to draw on the experiences found in North et al. (Citation2020), where the postgraduate nurse researchers together had local knowledge and experiences of applying graphic facilitation. This could perhaps be utilised in a more mentor-like capacity in organisations, activating both more expert knowledge in graphic facilitation and local contextual knowledge. It would probably still require some courage and stamina from trainees in their practice, but sharing these experiences, and ‘daring’ one another in a friendly tone, may make the steps both easier and more accessible in a long-term perspective.
Despite the difficult first steps, the analysis clearly and importantly shows that all three trainees manage and see value in using graphic facilitation. In addition, all have evolved their practices and expanded their repertoire. Their utterances show that the process of using visuals aids reflection on their own practices (Schön, Citation1983) both in relation to preparing and hosting meetings. The trainees have all worked on individual, small group and group levels. They have not tried larger scale interventions, as seen in Tyler et al. (Citation2005). However, several trainees described processes where they used the same facilitation process in several distinct groups and with different departments and professions. Like in the study of Tyler et al. (Citation2005), the trainees found that the graphic facilitation enabled a shift in focus, as opposed to meetings with no visuals or more traditional PowerPoint and text-based facilitation. A shift that invited all participants to undertake reflection and enabled investigation of the relations between different processes and tasks, which all three trainees considered valuable in their meeting facilitation. Furthermore, the trainees expressed how they have become known by their colleagues as ‘the drawer in the organisation’. However, this research does not investigate the perspective seen directly from the participating colleagues who experienced the graphic facilitated meetings. We only have third-hand experience of what the trainees told us. This is a limitation of our research, and we recommend including this perspective in future research of doing graphic facilitation.
The research also finds that the trainees primarily used visual templates, at least to begin with. Moreover, they talked about using sketches when doing more in-situ drawings and facilitations (see , and our discussion of Nielsen et al., Citation2016). What is interesting is that they refer to this with an assumption that the ideal way of doing graphic facilitation is to be able to practice this without the preparation of a sketch. In the review, we see how Espiner and Guild (Citation2012) also refer to a practice where the graphic facilitator has a template which is not filled out completely, and which they draw on top of. These ideas of iterating, by preparing, refining and reusing a visual template, or perhaps restarting a drawing, but from a new foundation, may in fact be some of the advantages of using graphic facilitation, where textual information or PowerPoints take a longer time to alter, and have a more static expression which encourage a certain work mode. The use of graphic facilitation in this sense can provide a basis for reflection-in-action and reflection-on-action, and ‘on the spot experiments’ (Schön, Citation1983, 1992), also in reference to the inspiration from the design and architect fields (Sibbet, Citation2001). In our analysis we see signs of these reflections and experiments, and that the trainees do see graphic facilitation as valuable, but they may need more time to realise in full the potentials of this more iterative way of working.
The development of competences and the use of drawings was the aim of the initial basic course. However, the literature in general talks less about, is the act of facilitation. After having done this research study, it is clear that there are differences between facilitating one’s colleagues as opposed to doing large-scale interventions with someone you have never met before or doing facilitation with a child with special needs and his/her parents as in Espiner and Guild (Citation2012). The research literature does not really discuss issues such as how does the graphic facilitator facilitate different target groups, how to prioritise what is brought forward on the visual board, and how to avoid or handle conflict between participants.
This missing focus on the above facilitation aspects led us to revisit the work of Nielsen et al. (Citation2016) and our illustration of their four concepts in , of the passive/active facilitator role (horizontal) and the passive/active drawer role (vertical). When plotting the four concepts onto the figure, it became clear that this leaves one segment empty, namely the situation where one is being active as a facilitator and passive as drawer. Or simply put: the situation where one is only facilitating, with no visual support. Espiner and Guild (Citation2012) mention two roles, facilitation and drawing, but do not discuss these differences; and Tyler et al. (Citation2005) mention that graphic facilitation requires deep listening. The analysis shows that facilitation competencies are important. We therefore suggest that in future research this perspective is included when evaluating the effects and values of graphic facilitation. We also suggest an update to our as seen below in , to include facilitation as a fifth format, putting an explicit focus on facilitation processes going forward. The arrows illustrate switching between formats, sustaining the dynamics as also suggested by Nielsen et al. (Citation2016).
Figure 6. An updated version of the continuum of passive/active facilitator role (horizontal) and drawer role (vertical).
The practice of graphic facilitation, both in the existing literature and in the practices investigated in this study, takes its point of departure in an individual person drawing and facilitating group processes. However, in our own teaching and research practice we experimented with more collaborative approaches as well, encouraging all students to draw and sketch in group processes (e.g. Ørngreen et al., Citation2021). As mentioned, Bowen et al. (Citation2015) describe that there is a need to develop competencies in both designing visual languages for others to understand and learning to interpret the visual texts created by others. The researchers further argue that: ‘this is particularly important in visual and digital environments’ (p. 497). This perspective of learning to interpret visuals is relevant, as seen from the general practice of graphic facilitation, as well as from a more collaborative and digital approach. Enabling employees to learn and work in collaboration, where they create and interpret visual elements together, would be relevant to explore in future research.
6. Conclusions
The research in this paper aimed at investigating two aspects of graphic facilitation in long-term perspectives. 1) The impact of a course on trainees’ facilitation practice over time. 2) The various ways the method is applied and the impact at the individual, group and organisational level. Three factors related to the long-term perspectives were found relevant to investigate: 1. The graphic facilitation practice at the individual, group and organisational level; 2. Contextual knowledge and knowing about the participants and 3. The relation between objects, process and competencies needed. Furthermore, the research gave rise to investigating the approaches to graphic facilitation used, where Nielsen et al. (Citation2016) four approaches were expanded with a fifth approaches: facilitation, as shown in .
The result of the study found that graphic facilitation was valuable for giving new insights into and overviews of work processes and tasks and was used to create common ground and goals. The trainees utilise their contextual knowledge about the organisation to aid the process, and on a general note it was found that being sensitive to different groups’ needs and personal preferences can be effective when applying the method in daily work. Graphic facilitation also provided a more informal and even humours atmosphere, when facilitating colleagues in an organisation and on an individual level the method also enabled the trainees to show creative sides of their academic competences. However, the use of graphic facilitation in own work context is also a difficult process to begin with, which requires courage from the facilitator. It seems that visual templates are a safe place to start but are also very powerful processes to work with in establishing an overview of the facilitation at hand. More in-situ facilitation can be supported by pre-prepared sketches, and the process of iterating on this over time seems valuable.
The practical implications of this research are as follows: 1) Graphic facilitation training programmes could consider incorporating extended periods of mentoring or facilitating professional networks and knowledge-sharing experiences. This approach aims to improve the implementation process and quality of graphic facilitation after the course activities, providing an inspirational forum and a safe space for trainees to express insecurities and receiving mental support. 2) Graphic facilitation can be utilised in various ways, as illustrated in . Determining what is important to the organisation and the task at hand, as well as considering the competences of the facilitator and the needs of participants, can help in selecting a suitable approach. This, in turn, supports the implementation process and enhances the quality of graphic facilitation for the organisation.
However, more research is needed, both in terms of volume, including a greater number and variety of participants (graphic facilitators and users), and in terms of methodology. This involves using approaches beyond interviews, such as qualitative ethnographic methods and quantitative surveys with a larger group of participants. Therefore, in future research, it will be pivotal to focus both directly on the participants taking part in the graphic facilitation processes, and to investigate the actual facilitation being practiced in organisations.
Disclosure statement
No potential conflict of interest was reported by the authors.
References
- Agerbeck, B. (2012). The graphic facilitator’s guide: How to use your listening, thinking & drawing skills to make meaning. Loosetooth.com.
- Bowen, T., Evans, M. M., & Dalkir, K. (2015). What does knowledge look like? Drawing as a means of knowledge representation and knowledge construction. Education for Information, 31(1,2), 53–72. https://doi.org/10.3233/EFI-150947
- Boxenbaum, E., Jones, C., Meyer, R. E., & Svejenova, S. (2018). Towards an articulation of the material and visual turn in organization studies. Organization Studies, 39(5–6), 597–616. https://doi.org/10.1177/0170840618772611
- Braun, V., & Clarke, V. (2006). Using thematic analysis in psychology. Qualitative Research in Psychology, 3(2), 77–101. https://doi.org/10.1191/1478088706qp063oa
- Creswell, J. W. (2012). Educational research. planning, conducting, and evaluating quantitative, and qualitative research (4th ed.). Pearson.
- Degnegaard, S. (2012). Co-Creation for impact. Co-creating new business models for designing out wicked problems. [ PhD dissertation], Research School: The Royal Danish Academy of Fine Arts
- Espiner, D., & Guild, D. (2012). Capturing what matters most: Engaging students and their families in educational planning. Teaching Exceptional Children, 44(5), 56–67. https://doi.org/10.1177/004005991204400506
- Grant, M. J., & Booth, A. (2009). A typology of reviews: An analysis of 14 review types and associated methodologies. Health Information & Libraries Journal, 26(2), 91–108. https://doi.org/10.1111/j.1471-1842.2009.00848.x
- Harper, D. (2002). Talking about pictures: A case for photoelicitation. Visual Studies, 17(1), 13–26. https://doi.org/10.1080/14725860220137345
- Harzing. (2020). Using publish or Perish to do a literature review. https://harzing.com/blog/2017/02/using-publish-or-perish-to-do-a-literature-review ( accessed 3rd of July 2023)
- Hautopp, H. (2022). Drawing connections – an exploration of graphic and visual facilitation in organisational and higher educational contexts. Aalborg Universitetsforlag. [ PhD Series], The Doctoral School of Social Sciences and Humanities, Aalborg University https://doi.org/10.54337/aau469549955
- Hautopp, H., & Ørngreen, R. (2018). A review of graphic facilitation in organizational and educational contexts. Designs for Learning, 10(1), 53–62. https://doi.org/10.16993/dfl.97
- Illeris, K. (2003). Towards a contemporary and comprehensive theory of learning. International Journal of Lifelong Education, 22(4), 396–406.
- Milne, E., & Muir, R. (2020). Photovoice: a critical introduction. In L. Pauwels & L. Mannay (Eds.), The sage handbook of visual research methods (pp. 282–296). SAGE Publications, Inc. https://doi.org/10.4135/9781526417015
- Mirzoeff, N. (2009). An introduction to Visual Culture. Routledge.
- Nielsen, E., Søndergaard, K., Nielsen, I., & Moltke, H. (2016). Grafisk Facilitering – når ord og billeder mødes. Dansk Psykologi Forlag.
- Nørgaard, M. (2021). Professional visual facilitation. Center for Visual Thinking.
- North, N., Leonard, A., Bonaconsa, C., Duma, T., & Coetzee, M. (2020). Distinctive nursing practices in working with mothers to care for hospitalised children at a district hospital in KwaZulu-Natal, South Africa: A descriptive observational study. BMC Nursing, 19(1), 1–12. https://doi.org/10.1186/s12912-020-00421-1
- Ørngreen, R., Henningsen, B. S., & Hautopp, H. (2021). Creative audio-visual approaches applied in online and hybrid educational designs. In I. C. Busch, M. Steinicke, R. Friess, & T. Wendler. (Eds.), (red), Proceedings of the 20th European Conference on e-Learning ECEL 2021: a Virtual Conference Supported by University of Applied Sciences HTW Berlin Germany. (pp. 329–338). Academic Conferences and Publishing International. https://doi.org/10.34190/EEL.21.096
- Pauwels, L. (Ed). (2006). Visual cultures of science: Rethinking representational practices in knowledge building and science communication. Dartmouth College Press.
- Pauwels, L., & Mannay, D. (2020). The sage handbook of visual research methods. SAGE.
- Pink, S. (2007). Doing visual ethnography (2nd ed.). SAGE Publications.
- Qvist-Sørensen, O., & Baastrup, L. (2019). Visual collaboration. A powerful toolkit for improving meetings, projects, and processes. Wiley.
- Sandholdt, C. T., Srivarathan, A., Kristiansen, M., Malling, G. M. H., Olesen, K. V. M., Jeppesen, M., & Lund, R. (2022). Undertaking graphic facilitation to enable participation in health promotion interventions in disadvantaged neighbourhoods in Denmark. Health Promotion International, 37(Supplement_2), ii48–ii59. https://doi.org/10.1093/heapro/daac034
- Schön, D. A. (1983). The reflective practitioner: How professionals think in action. Temple.
- Schön, D. A. (1992). The theory of inquiry: Dewey’s legacy to education. Curriculum Inquiry, 22(2), 119–139.
- Sibbet, D. (2001). A graphic facilitation retrospective. Adapted from presentation at the International Association of Facilitators The Art and Mastery of Facilitation – Navigating the Future IAF Conference, 2001, May 16-20, Minnesota.
- Sibbet, D. (2008). Visual intelligence: Using the deep patterns of visual language to build cognitive skills. Theory into Practice, 47(2), 118–127. https://doi.org/10.1080/00405840801992306
- Sibbet, D. (2010). Visual meetings: How graphics, sticky notes and idea mapping can transform group productivity. John Wiley & Sons.
- Smith, R. S. (2014). Collaborative bandwidth: Creating better virtual meetings. Organization Development Journal, 32(4), 15.
- Tyler, C., Valek, L., & Rowland, R. (2005). Graphic facilitation and large-scale interventions: Supporting dialogue between cultures at a global, multicultural, interfaith event. The Journal of Applied Behavioral Science, 41(1), 139–152. https://doi.org/10.1177/0021886304272850
- Valenza, C., & Adkins, J. (2009). Understanding visual thinking: The history and future of graphic facilitation. ACM Interactions, (July and August), 39–45.
- Wang, C. (1999). Photovoice: A participatory action research strategy applied to women’s health. Journal of Women’s Health, 8(2), 185–192. https://doi.org/10.1089/jwh.1999.8.185