
ABSTRACT
A shift from teaching to learn to learning to think is necessary to promote critical thinkers. Since teachers tend to replicate the educational models they have experienced as students, new references are needed. In order to address these concerns, we present an interdisciplinary intervention in initial teacher education and analyse its impact on teachers’ critical thinking and awareness of the importance to promote it. The intervention is based on the potential of socio-scientific issues to support argumentation and provide meaningful contexts for graph interpretation. The content analysis of participants’ responses before and after inquiring about climate change shows an increase in the level of argumentation and the capacity to read beyond data, providing evidence of the development of critical thinking. In addition, pre-service teachers explicitly refer to their future responsibility in preparing students to face current challenges, demonstrating awareness of the need to promote critical thinking.
1 Introduction and background
Critical thinking has been considered a key twenty-first century competence by different frameworks (Voogt and Roblin Citation2012) and by STEM educators (Jang Citation2016). An education contributing to the development of twenty-first century competences requires, among other things, a reconsideration of instructional processes and a shift from teaching to know to learning to think (Zoller and Nahum Citation2012). Teachers play a key role in this shift and initial teacher education is a crucial stage to address this issue, but how can we prepare teachers to integrate critical thinking in mathematics and science education?
Immersion is considered an appropriate strategy for teacher professional development (Loucks-Horsley et al. Citation2003). In immersion activities, teachers take the role of students in order to experience the target teaching method. This position allows them to critically reflect on what can be learnt and get an experiential referent of other ways of teaching. Based on that, we have designed some activities for teacher initial education conceived as an immersion approach. The hypothesis is that through these activities pre-service teachers will develop their own critical thinking and reflect on the importance of contributing to this learning outcome through mathematics and science education.
Before describing the activities implemented and discussing the analysis of results, we will draw on the specialised literature to provide foundation for our work.
1.1 Critical thinking as a twenty-first century competence for STEM education
The debate about what kind of values and skills do individuals need to fully participate in a complex rapidly changing world has inspired different initiatives promoted by international organisations (EU, OECD, UNESCO) indicating a strong interest in defining and promoting those key competences.
Differences between frameworks emerge mainly from the way of categorising and grouping the competences but critical thinking is recognised as a key competence for twenty-first century by most frameworks (Voogt and Roblin Citation2012) and by STEM educators (Jang Citation2016).
The term ‘critical thinking’ has been defined in various ways by philosophers, psychologists and educators. A classical definition widely accepted is that proposed by Ennis (Citation1987) who described critical thinking as `reflective reasoned thinking which allows to know what to believe and do´. In the following sections, we will look at critical thinking in the context of mathematics and science education.
Critical thinking in mathematics education
The classroom dynamics and atmosphere determine students’ interaction and the kind of thinking and learning that takes place. Engaging students in argumentation in the mathematics classroom means going beyond recalling prescribed procedures and providing the right answers. On the contrary, argumentation requires students to think aloud and explain how they think and why they support a particular response or solution, therefore promoting critical thinking (Wood, Williams, and McNeal Citation2006). Argumentation allows students to interact with one another and develop conceptual understanding, while constructing claims, providing evidence to support the claims, and evaluating such evidence to judge the validity of the claims (Dogruer and Akyuz Citation2020; Schwarz, Hershkowitz, and Prusak Citation2010). Studies in mathematics education show that argumentation supports critical thinking and students meaningful understanding of mathematical concepts (Ayalon and Hershkowitz Citation2018; Dogruer and Akyuz Citation2020; Mueller, Yankelewitz, and Maher Citation2014).
Wild and Pfannkuch (Citation1999) draw attention on the importance of promoting critical thinking when checking the internal and external consistency of information and questioning the accuracy of the data being analysed. The information provided should be consistent with current knowledge and with the context of the study. Additionally, the critical analysis should consider the purpose and objectives of the study and the potential influence of beliefs and emotions on the interpretation of results and the development of conclusions.
Gal (Citation2002) discusses the capacity to critically interpret, evaluate and communicate statistical information and messages and suggests a model that distinguishes between knowledge elements and dispositional elements. Dispositional elements include critical stance, beliefs and attitudes. According to this author, a literate person will interpret and understand statistical information, formulate critical question to evaluate it and adopt a critical stance partly based on personal beliefs and attitudes.
One of the main objectives of mathematics education is to enable students to critically interpret and understand graphs. According to Friel, Curcio, and Bright (Citation2001) there are four main elements influencing the comprehension of graphs: purpose of the graph, characteristics of the task, characteristics of the discipline and characteristics of the learner. Several studies have investigated the interpretation of graphs as a pedagogical issue, trying to identify different levels of comprehension. The classical schema of levels by Curcio (Citation1989) is one of the more widely used and suggests three levels of students’ responses: reading the data, reading between the data and reading beyond the data.
Reading the data requires a linear reading of graphs. Learners’ responses are based on the information explicitly provided by the title or the axis, and there is no interpretation of data. Therefore, this level requires low order cognitive skills.
Reading between the data requires the ability to interpret and compare values in the graphs (higher than, lower than, the highest) and the application of mathematical concepts and skills that allow learners to determine the mathematical relationships represented in the graph. This is the level most frequently assessed in tests in the specialised research.
Reading beyond the data requires the ability to predict or infer from data to identify appropriate schemas related to previous knowledge and not explicitly or implicitly present in the graph. Reading between data might involve inference, but reading beyond the data requires connecting the interpretation of the graph with information present in the learner’s mind not in the graph.
Friel, Curcio, and Bright (Citation2001) distinguish four components in graphs: the framework, the specifiers (visual dimensions – the bars on a bar graph-), the labels and the background. Axis is part of the framework of the graph. One important skill for graph interpretation is the ability to evaluate the impact of any of the components on the information represented in the graph (for instance, being able to predict how the graph would change when changing the scale used in the axis).
Scale is an essential element of graphs. Moreover, according to Resnick et al. `understanding scale is central to science, technology, engineering, and mathematics´ (2017, 1); however, research shows how students find difficulties when interpreting scales in graphs (Li and Shen Citation1992).
In the present work, we will draw on the specialised literature about graph comprehension to evaluate students’ capacity to interpret and discuss data in a graph as well as their capacity to read beyond data and to use this information to take an informed position in wider context as an indicator of critical thinking.
Critical thinking in science education: argumentation
Zoller and Nahum (Citation2012) define critical thinking as a High Order Cognitive Skill (HOCS) deeply entangled with evaluative and systemic thinking, while Jiménez-Alexandre and Puig () consider argumentation as a fundamental component of critical thinking, since it requires a search for reasons and a commitment to evidence in order to back up positions and evaluate alternative points of view.
Interest in argumentation has increased in the last 15 years within the science education community due to the potential to enhance classroom communication, reasoning and learning through the negotiation of meanings and the social construction of knowledge. Concerning the development of scientific knowledge, argumentation has an epistemic value due to its commitment to evidence and thus some science educators recognised its value for students’ appropriation of scientific practices and the construction of scientific models (Fishman et al. Citation2017; García-Carmona and Acevedo-Díaz Citation2018; Kuhn et al. Citation2017). Therefore, argumentation is not only a powerful vehicle for developing and expressing critical thinking but also a key component of contemporaneous science education.
After having discussed the specialised literature about critical thinking in general, and trends in mathematics and science education that emphasise graphs interpretation and argumentation as important contributors to critical thinking, we should wonder how to design an educational intervention that foster the intended learning outcomes in science and mathematics education using a common interdisciplinary context. At this point, we come to the importance of context for providing meaning and purpose to the learning taking place.
1.2 The importance of context
The influence of contexts on the type and quality of the learning that takes place has inspired a classical line of work in education. This approach is tightly related to the notion of context and how it is linked to learning. Finkelstein (Citation2005) defines context as the interactive everything in which learning is situated for an individual learner or a group, with parts that cannot be meaningfully separated. Authors supporting context-based science education assume that we are condemned to context in that it is inherently and inevitably connected to our learning and has an important influence on it (Giamellaro Citation2014).
A review of empirical studies evaluating the impact of this approach shows that context-based science education not only increases students’ motivation but also their enthusiasm towards the subject and positively changes students’ attitudes towards science (Ültay and Çalık Citation2012). Furthermore, some studies found this approach to be successful in increasing students’ conceptual understanding of some basic scientific ideas (Ballantyne and Packer Citation2010; Charney et al. Citation2007; Nashon and Anderson Citation2013) and most of the outcomes support that context-based science education makes students see science and mathematics as more relevant to their lives (Ültay and Çalık Citation2012).
There is a renewed interest in STEM context-based education (Sevian, Dori, and Parchmann Citation2018) and in the search of meaningful, functional and motivating contexts for STEM interdisciplinary learning.
In mathematics education in general, and in statistics in particular, the context is always present, since as Moore states, `data are not merely number, but numbers with a context´ (1990, 96). However, context is not always recognised or sufficiently emphasised when designing instruction.
1.3 Socio-Scientific Issues as educational contexts for critical thinking
Socio-scientific issues provide powerful contexts for STEM education and the development of important twenty-first century skills, such as critical thinking.
The term Socio-Scientific Issues (SSI) was used in science education as early as 1986, but it did not come to represent a recognisable framework for research and practice until the late 1990s, offering opportunities to connect science and mathematics learning with relevant social problems.
The term SSI refers to problems that arise in our contemporary world having scientific and/or technological components and environmental, social or ethical connotations. They are considered as issues or problems because there is no consensus on how they might be best solved or addressed (Levinson Citation2006) and often provoke discrepancy among different stakeholders. According to Kolstø and Ratcliffe (Citation2008), in SSI, science entails social debate and personal or political decision-making around controversies related to health or environmental issues.
Ratcliffe and Grace (Citation2003) analysed the place of socio-scientific issues in the school curriculum and emphasise its connection to key content knowledge and learning outcomes related to citizenship education, scientific literacy and environmental education.
Research in mathematics education stresses the importance of mathematics content knowledge in solving authentic tasks such as those provided by SSI (Radakovic Citation2015). In this line, Sadler and Dawson (Citation2012) have reviewed and synthesised evidence amassed through investigations of the effects of SSI contexts on different learning outcomes: interest in learning, content knowledge, understanding of the nature of science and argumentation and critical thinking.
After discussing the key role of context in learning and the potential of socio-scientific issues as scenarios for promoting critical thinking in science and mathematics learning, we will focus on climate change as a relevant scenario for contextualising graph interpretation and fostering argumentation.
1.4 Critical thinking and climate change as a powerful socio-scientific context
The central role of education in increasing society’s capacity to face current environmental problems has been widely recognised. Global warming is one of the biggest environmental problems, and there is an interesting discussion about how to address climate change through education (Ledley, Rooney-Varga, and Niepold Citation2017). It is considered a socio-scientific issue due to its social, economic and political implications and offers an interesting scenario to promote debate and exercise critical thinking. In this line, climate change has been already used as a powerful context to develop argumentation (Dawson and Carson Citation2018; Walsh and McGowan Citation2017).
However, understanding climate change presents some unique challenges due to the nature of the phenomena involved and the scale necessary to evaluate the consequent effects. Drawing on research in environmental psychology, Busch and Osborne (Citation2014) analyse complexity and scale as two specific obstacles for teaching and learning about climate change.
Complexity refers to the fact that climate change is a complex phenomenon that involves interdisciplinary knowledge and students find it difficult to draw from the knowledge taught in different school subjects to explain it. Approaching climate change from different subjects at school in a connected way can facilitate students’ understanding of the issue.
Along with the complexity of the phenomena involved, data about global warming is usually presented operating with scales – both temporal and spatial – that are outside of students’ daily experience. When talking about climate change, we refer to an increase in ‘global average temperature’ or ‘global sea level’ using unusual references to students who more easily recognise local and familiar events. Discussing climate change at early ages using only the global scale can create a feeling of separation from the problem or a feeling of disempowerment, if the problem is perceived as out of reach. These kinds of feelings should be avoided. In summary, global climate has a scale that is outside of the personal experience of students and requires appropriate pedagogical strategies to make it meaningful to them and to promote their engagement in mitigation actions (Busch and Osborne Citation2014).
Challenges related to scale have been studied by other researchers (Resnick et al. Citation2017). Very often scientific theories and discoveries involve reasoning about extreme scales, removed from human experience. Unfortunately, students have trouble understanding and comparing sizes of unfamiliar large and small magnitudes. In our work, we will use scales and graphs about global warming to support reasoning and critical thinking in pre-service teachers in a class about Statistical Education.
1.5 A need for teacher initial education
In previous sections, we have discussed current challenges to the development of twenty-first century competences in STEM education, focussing on the promotion of critical thinking and the importance of contexts such as climate change to support the achievement of the intended educational goals. In this last part, we will draw attention on the key role played by teachers and the need to properly equip them with the knowledge and skills required from initial teacher education.
Though teachers are fundamental actors in promoting civic scientific and environmental literacy, recent research suggests they are less effective than they could be in educating the next generation of citizens about climate change and its causes. In this line, some authors call for STEM teachers to receive more formal training about climate change issues (Namdar Citation2018; Plutzer and Hannah Citation2018).
Using a nationally representative survey of 1500 middle school and high school science teachers, Plutzer and Hannah (Citation2018) have studied factors affecting how teachers deal with climate change at school. Results show that increased content knowledge influences teaching choices, including decisions about debating `both sides´ (human or natural causes of climate change). However, authors conclude that there are other factors affecting significantly how teachers address education about these issues.
In relation to some of the specific challenges previously discussed, Bryce and Day (Citation2014) point out at the conflicting perspectives figuring in the mass media due to scepticism and doubt about climate change and argue that STEM teachers should be familiar with them, particularly given the sharply contested views likely to be brought into classroom discussion. They look closely and critically at the approaches which teachers might adopt in practice to teach about global warming, drawing attention on the importance to develop intellectual scepticism and robust scientific literacy in students.
Considering all the issues previously discussed, we will use the debate of negationists’ views about climate change and the interpretation of graphs and empirical data to better prepare pre-service teachers to deal with some of the current educational challenges. We consider that, inquiring about climate change, discussing contrasting views and interpreting graphs are valuable activities to develop critical thinking in teachers and to prepare them to deal with these issues in the classroom.
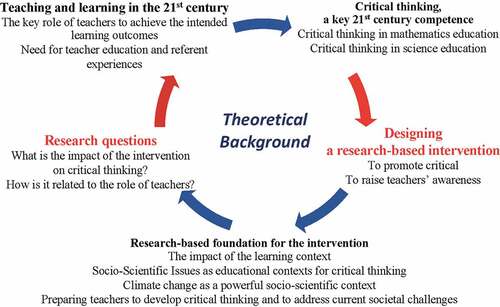
summarises the main ideas providing the foundation for the present work:
Figure 1. Main ideas providing foundation for this work.
Based on the previous background, we formulate the following research questions:
What is the impact of an intervention based on inquiry about climate change, on pre-service teachers’ critical thinking expressed through graphs interpretation and argumentation?
How do pre-service teachers relate an immersion experience aimed at the development of critical thinking to their future role as teachers?
2 Methods
2.1 Context and sample
The study was conducted at the University of Jaen (Spain), within the context of a four-year university programme for primary school pre-service teachers (teaching grades 1–6). The intervention took place within two 60 hours undergraduate courses on science and statistics education, respectively, offered throughout a whole semester of the last year. Participants had already had other subjects on mathematics and science education in previous courses. The main topics addressed in the science course where the intervention took place were the nature of science, big ideas in science and the contributions of inquiry and socio-scientific issues to science literacy and critical thinking. The main topics addressed in the statistics course were history of statistics, importance of interdisciplinary approaches for statistics education and contributions of data and graph interpretation to literacy and critical thinking.
The two subjects were taught by two different educators engaged in initial teacher education, who shared a concern for helping learners to think and better preparing teachers to promote critical thinkers. They agreed on an interdisciplinary collaboration based on the use of a common socio-scientific scenario, climate change, to promote key components of critical thinking (graph interpretation and argumentation). The final goal was to make pre-service teachers concern about the importance of promoting these skills in their future students and to better prepare them to teach in the twenty-first century.
The study focussed on the analysis of arguments provided by an intentional sample of 80 pre-service teachers (60% female, 40% male), average age 22, who took part in the discussion of graphs described in and the contributions to on-line debate about the causes of climate change of 77 participants (58% female and 42% male).
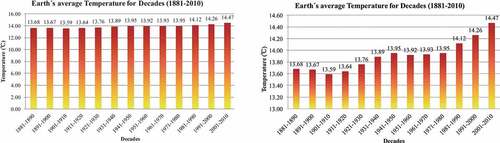
Figure 2. Graphs used for discussing Earth’s average temperatures and climate change.
From now on we will refer to undergraduate pre-service teachers as students or participants in the activities, while the teacher educators responsible for them will be referred to as teachers.
In the context of science education, students were exposed to the arguments of those who deny an anthropogenic cause for climate change, claiming that throughout the history of Earth, the planet has been submitted to cyclic changes in temperature due to natural causes and that the current increase in temperature is part of one of these cycles. Then, students were asked to express their opinion about these claims in an electronic forum. Responses to this forum are referred to as pre-contributions.
After taking part in the initial forum discussion about the causes of climate change, students were asked to inquiry about the issue for a week using different information sources. Emphasis was placed on the need to evaluate evidence and to question the reliability of the information being collected.
Finally, they were asked to revise their initial opinions and to discuss in a new electronic forum their position about climate change after the inquiry process. Arguments in this forum are referred to as post-contributions.
In addition to the discussion of different arguments about climate change in the context of science education, students were asked to analyse data from two different graphs displaying Earth’s average temperatures in the last three centuries, during classes about Statistical Education (). The two graphs were made by the teachers in advance, based on available scientific data. Intentionally, for this study, both graphs display the same set of data using a different scale in the y-axis.
The teacher posed some questions about the graphs and pre-service teachers responded individually in a piece of paper. The questions posed were: A) Do the two graphs look the same? Why? B) How are the two graphs different? C) If you participated in a debate about climate change and you would like to support that the average temperature of Earth has significantly increased in the last 120 years, what graph would you choose? Why? D) If you participated in a debate on climate change and you would like to support that the data available are irrelevant to accept climate change, which graph would you choose? Why? E) What do you think about the use of graphs to deliver information? F) What care should be taken, from an educational point of view, when teaching graphs at school?
2.3 Content-analysis of students’ responses
Participants’ contributions (N = 77) to the two electronic-forums were analysed using a qualitative approach involving two researchers. The analysis was conducted through successive cycles, any of them involving first, an independent analysis by each researcher, and then, a joint revision of results in order to resolve discrepancies, refine categories, negotiate meanings and ensure inter-rater reliability (Silverman and Marvasti Citation2008).
Initial categories to identify levels of argumentation, used in the content analysis of participants’ responses to the electronic forums were established in a deductive way using those proposed by Venville and Dawson (Citation2010) (Level 1: Claim; level 2: claim, data and/or warrant; level 3: claim, data/warrant, backing; level 4: claim, data/warrant, backing and qualifier). However, deductive categories were revised and refined during the iterative process of content analysis to reduce ambiguity and to increase inter-rater reliability. Inter-rater reliability tested by Cohen’s Kappa was calculated separately for each category with values between 0.85 and 0.97 showing a substantial agreement with an overall value of 0.94. presents the final set of categories used in the content analysis of participants’ responses to the electronic forums.
Table 1. Categories used for the content analysis of students’ responses according to the level of argumentation (partly based on Venville and Dawson Citation2010).
The categories coded as levels of argumentation form a hierarchical order, with more advanced statements belonging to categories 3 or 4. Categories related to argumentation levels are defined as excluding categories (one argument cannot be classified at the same time in two different levels of argumentation). On the other hand, emotion and action are including categories that can be coded additionally along with any of the other categories.
For the content analyses of participants’ graph interpretations, inductive categories were defined to catch the whole range of responses and to account for common themes. The analysis of graphs was guided by a set of questions raised by the teacher intended at discussing graphs’ appearance, similarities and differences between the two graphs, general use of graphs, potential use of those graphs for accepting or denying climate change and critical issues in statistical education, including the interpretation of graphs.
3 Results and discussion
In relation to the first research question: ‘what is the impact of an intervention based on inquiry about climate change, on pre-service teachers’ critical thinking expressed through graphs interpretation and argumentation’, it should be noted that the content analysis of students’ responses has been used to evaluate the impact of these activities on students’ critical thinking. In order to quantify the effect, the frequency of students’ responses has been calculated for any of the categories of analyses previously described ().
shows the frequencies of responses within each category describing the level of argumentation before and after the activities in the whole sample. The comparison between students’ contributions to electronic forums before (pre) and after (post) inquiring on climate change shows a progression in the levels of argumentation, with a noteworthy decrease in the lowest level (claims with no backing) and an important increase in levels 3 and 4 (claims backed up with data and scientific explanations).
Figure 3. Frequency of responses within the categories describing the levels of argumentation before (pre) and after (post) the activities.
A detailed analysis per participant comparing contributions to the pre and post forum of debate shows that 40.6% of participants do not exhibit a progression in their levels of argumentation after inquiring on climate change, while 50.4% do.
The activity suggested to students (searching for information about the causes of climate change keeping a critical attitude towards the reliability of the sources) requires minimal teacher intervention. It might be possible that with more guidance or an explicit instruction about argumentative skills, the number of students showing an improvement in the quality of the argument would be higher (Cetin Citation2014). Nevertheless, over half of the participants (50.4%) showed a progression in the level of argumentation, thus providing evidence of the positive impact on participants’ critical thinking.
In relation to those who improve the quality of their arguments after inquiring on climate change, 32.4% evolve from level 1 to higher levels, while 18.0% evolve from level 2 to levels 3 and 4. These results provide research evidence of the influence of the activity on students’ capacity to revise and improve their initial ideas about a relevant socio-scientific issue and to produce well-developed arguments. presents some quotations translated into English as examples of responses in the different levels of argumentation.
Table 2. Examples of students’ responses to illustrate the analysis of levels of argumentation.
In terms of valuable learning outcomes, argumentative skills have been identified as key component of critical thinking, since they require reasoning and the evaluation of alternative viewpoints according to the quality of the evidence that support them (Jiménez-Aleixandre and Puig Citation2012).
Results show that after searching and analysing information about the causes of climate change, more than half of the students were able to take a critical stance against claims denying the responsibility of humans in the issue. Additionally, they were able to use data and scientific explanations to back up their position. Therefore, along with the development of argumentative skills and critical thinking, we present results aligned with current educational standards related to STEM education, the appropriation of scientific practices and the development of scientific literacy (García-Carmona and Acevedo-Díaz Citation2018; Osborne Citation2014).
Regarding emotions, we coded 29.9% of pre-responses and 24.7% of post-responses as emotive, including words that express empathy, concern, preoccupation and a sense of responsibility or personal engagement in the issue.
In the initial forum, 91.3% of the emotive responses were related to level 1 of argumentation and only 8.7% to higher levels of argumentation. After inquiring about climate change, 38.8% of emotive responses were in level 1 and the rest (63.2%) were associated with higher levels of argumentation (levels 2, 3 and 4). These data seem to suggest that emotive features do not depend on the level of argumentation.
A closer look to individual changes reveals that 11.6% of participants sent emotive responses to the forums before and after the activities, 16.8% only before and 13.2% only after the intervention. Therefore, within these data, we cannot find a clear pattern relating a particular person with the exhibition or not of emotive features. presents examples of responses coded as emotive. Due to the influence of emotions on learning and personal engagement, more research would be needed to better understand how emotions affect the development of critical thinking.
Table 3. Examples of responses offered by students and coded under the emotive category.
In relation to the category coded as Action, 62.3% of students’ contributions to the forums include suggestions for mitigating climate change. A few of them referred to measures concerning third parties such as governments, administrations or institutions and 85.4% of them proposed actions related to awareness through education. We consider that this result is highly relevant in pre-service teachers because it reveals concern and responsibility-taking as teachers able to address the issue through particular educational actions. Additionally, these results are connected to the second research question: how do pre-service teachers relate an immersion experience aimed at the development of critical thinking to their future role as teachers. shows some examples of responses coded within the Action category:
Table 4. Examples of responses offered by students and coded under the action category.
Results show that 40% refer to their responsibility as teachers in preparing students to face current societal and environmental challenges, as illustrated by some quotations:
`We, as teachers, should make pupils aware of the importance of this issue from the earlier ages and show them visible consequences around them´
It is important to note that participants’ responses expressing emotions and suggestions for action-taking are aligned with research works that emphasise the key influence of ownership and empowerment variables to achieve the goals of environmental education (Hungerford and Volk Citation1990). Thus, feelings of empathy, concern, preoccupation, responsibility, along with suggestions for concrete actions involving personal engagement, reveal empowerment and ownership in participants and are valuable outcomes for achieving social transformation through education.
In the class about statistics education, the teacher posed some questions related to the graphs displayed in . The content analysis of students’ responses shows the following results. When asked if the two graphs have the same appearance, 22.5% of students respond they do, arguing that they are both bar graphs and represent the same variables and values, though apparently, they look different. On the contrary, 77.5% respond that the two graphs have different appearance using various arguments to back up their responses: 37.5% of students refer to the length of bars, with no mention to axis’ scales, while 35% explicitly point out to the scale of y-axis as the main cause for having a different look; they mention that as a consequence of the scale used, graph 1 seems to suggest no significant change in temperature, while graph 2 does. Five per cent of the sample (four students) show inappropriate responses, for instance, they say that differences are due to the use of different types of graphs (histograms or dispersion graphs).
Based on these results, we conclude that most of the students notice that the scale used in the y-axis has a visual effect on the graph’s appearance even when displaying the same set of data. When explicitly asked about what are the differences between the two graphs, 71% of students respond that differences are due to y-axis scale, two students respond that the two graphs display the same set of data but better defined in one of them, and other two students say that graph 2 is more correct than graph 1. Three students refer to other issues, for instance, that bars are higher in graph 1 than in graph 2. One student says that there is no difference between the two graphs and other one does not respond to the question posed. These results show again that most of the students notice that the main difference between the two graphs is due to the y-axis scale.
Additionally, students were asked which graphs they would choose if they had to convince an audience that the Earth’s average temperature has significantly increased in the last 120 years. Seventy-six students (95% of the sample) responded that they would choose graph 2, mostly arguing that differences in temperature are better appreciated in graph 2 due to the scale used in the y-axis.
Conversely, when asked which graph they would choose to convince an audience that change in temperature is not significant 91.5% pointed out graph 1 because differences seem smaller, are worse appreciated, or it seems that there is no or minor change.
In relation to the use of graphs, 42.5% of students state that they should be correctly analysed to avoid misinterpretation, after noticing how a change in the y-axis scale affects graph appearance inducing particular interpretations.
In summary, the content analysis of responses shows that most of the students point out at the scale used in y-axis as the main difference between the two graphs, and they recognise how the graph appearance may change depending on the scale used; demonstrating knowledge of the axis and the framework as key components of graphs (Friel, Curcio, and Bright Citation2001) and relational reasoning while detecting similarities and differences (Resnick et al. Citation2017).
Therefore, and in response to the first research question again, results show that students’ responses involve the three levels of comprehension of graphs suggested by Curcio (Citation1987), Curcio (Citation1989) because they do not only read data and read between data but read beyond data being able to extrapolate and choose one or another graph depending on the situation:
`I would choose graph 2 because it represents temperature more clearly and we can see a higher increase in the last years, specially from 1971 till 2010 and it can be perceived that it will keep on rising´. (pre-service teacher quotation)
In addition, according to the model of statistical thinking proposed by Wild and Pfannkuch (Citation1999), most of the students in the sample are exhibiting critical and relational thinking when considering different purposes or intentions and the potential influence of beliefs and emotions on the interpretation of results. Furthermore, they exhibit key features of statistical literacy, related to the adoption of critical stances and the consideration of context (Gal Citation2002).
Finally, and in response to the second research question, when asked about educational implications, 86.3% of the sample of study claim that they, as teachers, should enable pupils to correctly interpret graphs, therefore recognising the importance to promote critical thinking in their students.
4. Final remarks
Teachers tend to replicate the educational models they have experienced as students. Therefore, the change from teaching to know to learning to think should be addressed from initial teacher education.
This work intends to emphasise critical thinking as a key twenty-first century competence through an immersion approach where pre-service teachers take the role of students in order to experience an integrated teaching approach with an emphasis in the promotion of critical thinking in mathematics and science lessons.
It should be noticed that the activities conducted in the mathematics and science classroom share a common scenario, climate change and are interwoven and considered part of the same experience. Climate change as a relevant and contemporary socio-scientific issue provides opportunities to exercise critical thinking while using mathematics to interpret data and graphs and science to explain the causes of global warming.
However, the emphasis of this work is not on developing a better understanding of climate change, neither is on leading students to take a particular stance about this. On the contrary, it stresses critical thinking by offering the chance to evaluate alternative viewpoints on the basis of evidence, and critically interprets data and graphs recognising how, a change in scale, can induce misinterpretations that might be intentionally utilised to manipulate people’s opinions.
The hypothesis was that, through these activities, pre-service teachers would develop their own critical thinking and reflect on the importance of integrating this twenty-first century skill in mathematics and science education, what has been confirmed by the experimental results obtained.
The analysis of responses provides evidence about the development of critical thinking illustrated by participants’ capacity to read beyond data and to achieve higher levels of argumentation after the experience (see and ).
Concerning the connection to their future work as teachers, as previously discussed 86.3% of participants, refer to the importance of enabling pupils to critically analyse graphs and 40% refer to their responsibility as teachers in preparing students to face current societal and environmental challenges.
In relation to the implications of this work, the relevance and transdisciplinary nature of the topics addressed should facilitate the implementation into different contexts. Those with no set curriculum for initial teacher education provide plenty of opportunities to implement these kinds of approaches with the potential to help teachers to recognise the importance to educate critical thinkers at any stage, including primary school (Bonotto and Dal Santo Citation2015; Fung Citation2014; Martin, Craft, and Tillema Citation2002).
In addition, we should draw attention on the fact that though immersion strategies in teacher professional development provide referent experiences with the potential to influence teachers’ beliefs and practices (Loucks-Horsley et al. Citation2003), teachers would need to adapt to their particular context and the educational level of their students when designing and conducting interventions to promote critical thinking in STEM education.
In relation to limitations and future lines of work, the systematic content analysis of responses shows how participants articulate their ideas and reflect on teaching and learning and allow us to identify indicators of critical thinking. More research would be needed to better understand how emotions and intention to act interact with critical thinking.
Though the work provides research evidence of the positive impact of a particular intervention on critical thinking, it `does not strive towards context-free generalisations. If there is a need to make a generalisation, then it is an analytical generalisation – in contrast to statistical generalisation where the researcher strives for generalising from sample to population´ (Plomp Citation2013, 21). In order to strengthen the analytical generalisability and to draw pedagogical recommendations or design principles, it would be necessary to replicate the study with other samples and to study how changes in the activities affect the intended learning outcomes.
Challenges to the implementation of this work are related to the fact that both teachers and students are not used to the exercise of critical thinking in science and mathematics. In addition, the use of socio-scientific issues brings complex scenarios to the classroom that require the application of knowledge and skills traditionally taught in isolated school subjects. Thus, students find it difficult to bring them together, what could be ideally solved by promoting interdisciplinary learning or, like in the experience described herein, by the collaboration between teachers from different disciplines, what is not always that easy.
In summary, this piece of work provides research evidence of the positive impact of inquiry about socio-scientific issues on critical thinking. When implemented with pre-service teachers as an immersion experience, participants show the capacity to read beyond data and use them along with scientific explanations to back up their arguments. In addition, they demonstrate awareness of their key role as teachers in promoting critical thinking.
In spite of its challenges and limitations, we hope that this piece of work can inspire future ones and provide a basis for reflecting about teacher education and learning goals in the twenty-first century, recognising the need to stress critical thinking in STEM education and the potential of socio-scientific issues to achieve this goal.
Credit statement: Authors’ contributions
Marta Romero: Conceptualization, Methodology, Writing – Original draft preparation; Reviewing and Editing;
Antonio Quesada: Software, Data curation, Results and Discussion related to the analysis of arguments, Reviewing and Editing;
Antonio Estepa: Conceptualisation, Methodology, Data curation; Results and Discussion related to the analysis of graphs.
Disclosure statement
No potential conflict of interest was reported by the author(s).
Additional information
Funding
Notes on contributors
Marta Romero Ariza
Dr Marta Romero Ariza is Associate Professor in Science Education at the Department of Didactics of Sciences of Jaen University in Spain. Her key research areas are related to teacher professional development in Science Education.
Antonio Quesada Armenteros
Dr Antonio Quesada Armenteros is Associate Professor in Science Education at the Faculty of Humanities and Educational Sciences in the Department of Didactics of Sciences of Jaen University in Spain. His key research areas are related to initial education and professional development of science teachers.
Antonio Estepa Castro
Dr Antonio Estepa Castro is Professor in Mathematics Education in the Department of Didactics of Sciences of Jaen University in Spain. His key research areas are related to initial education and professional development of Mathematics teachers. http://orcid.org/0000-0003-1013- 8268
References
- Ayalon, M., and R. Hershkowitz. 2018. “Mathematics Teachers’ Attention to Potential Classroom Situations of Argumentation.” The Journal of Mathematical Behavior 49: 163–173. doi:10.1016/j.jmathb.2017.11.010.
- Ballantyne, R., and J. Packer. 2010. “Nature-Based Excursions: School Students’ Perceptions of Learning in Natural Environments.” International Research in Geographical and Environmental Education 11 (3): 218–236. doi:10.1080/10382040208667488.
- Bonotto, C., and L. Dal Santo. 2015. “On the Relationship between Problem Posing, Problem Solving, and Creativity in the Primary School.” In Mathematical Problem Posing from Research to Effective Practice, edited by F. M. Singer, N. F. Ellerton, and J. Cai, 103–123. New York, NY: Springer. doi:10.1007/978-1-4614-6258-3_5.
- Busch, K. C., and J. Osborne. 2014. “Effective Strategies for Talking about Climate Change in the Classroom.” School Science Review 96 (354): 25–32.
- Cetin, P. S. 2014. “Explicit Argumentation Instruction to Facilitate Conceptual Understanding and Argumentation Skills.” Research in Science & Technological Education 32 (1): 1–20. doi:10.1080/02635143.2013.850071.
- Charney, J., C. E. Hmelo-Silver, W. Sofer, L. Neigeborn, S. Coletta, and M. Nemeroff. 2007. “Cognitive Apprenticeship in Science through Immersion in Laboratory Practices.” International Journal of Science Education 29 (2): 195–213. doi:10.1080/09500690600560985.
- Curcio, F. R. 1987. “Comprehension of Mathematical Relationships Expressed in Graphs.” Journal for Research in Mathematics Education 18 (5): 382–393. doi:10.2307/749086.
- Curcio, F. R. 1989. Developing Graph Comprehension. Reston VA: NCTM.
- Dawson, V., and K. Carson. 2018. “Introducing Argumentation about Climate Change Socioscientific Issues in a Disadvantaged School.” Research in Science Education 1–21. doi:10.1007/s11165-018-9715-x.
- Dogruer, S. S., and D. Akyuz. 2020. “Mathematical Practices of Eighth Graders about 3D Shapes in an Argumentation, Technology, and Design-Based Classroom Environment.” International Journal of Science and Mathematics Education 18:(8) (8): 1485–1505. doi:10.1007/s10763-019-10028-x.
- Ennis, R. H. 1987. “A Taxonomy of Critical Thinking Abilities and Dispositions.” In Teaching Thinking Skills: Theory and Practice, edited by J. B. Baron and R. J. Sternberg, 9–26. New York: W. H. Freeman.
- Finkelstein, N. D. 2005. “Learning Physics in Context: A Study of Student Learning about Electricity and Magnetism.” International Journal of Science Education 27 (10): 1187–1209. doi:10.1080/09500690500069491.
- Fishman, E. J., H. Borko, J. Osborne, F. Gomez, S. Rafanelli, E. Reigh, A. Tseng, S. Million and E. Berson. 2017. “A Practice-based Professional Development Program to Support Scientific Argumentation from Evidence in the Elementary Classroom.” Journal of Science Teacher Education 28 (3): 222–249. doi:10.1080/1046560X.2017.1302727.
- Friel, S., F. Curcio, and G. Bright. 2001. “Making Sense of Graphs: Critical Factors Influencing Comprehension and Instructional Implications.” Journal for Research in Mathematics Education 32 (2): 124–158. doi:10.2307/749671.
- Fung, D. 2014. “Promoting critical thinking through effective group work: A teaching intervention for Hong Kong primary school students.” International Journal of Educational Research 66: 45–62
- Gal, I. 2002. “Adults’ Statistical Literacy: Meanings, Components, Responsibilities.” International Statistical Review 70 (1): 1–25. doi:10.1111/j.1751-5823.2002.tb00336.x.
- García-Carmona, A., and J. Acevedo-Díaz. 2018. “The Nature of Scientific Practice and Science Education.” Science & Education 27 (5–6): 435–455. doi:10.1007/s11191-018-9984-9.
- Giamellaro, M. 2014. “Primary Contextualization of Science Learning through Immersion in Content-Rich Settings.” International Journal of Science Education 36 (17): 2848–287. doi:10.1080/09500693.2014.937787.
- Gk, B. T., and S. P. Day. 2014. “Scepticism and Doubt in Science and Science Education: The Complexity of Global Warming as a Socio-Scientific Issue.” Cultural Studies of Science Education 9 (3): 599–632. doi:10.1007/s11422-013-9500-0.
- Hungerford, H. R., and T. L. Volk 1990. “Changing Learner Behaviour through Environmental Education.” The Journal of Environmental Education 21 (3): 8–21. doi:10.1080/00958964.1990.10753743.
- Jang, H. 2016. “Identifying 21st Century STEM Competencies Using Workplace Data.” Journal of Science Education and Technology 25 (2): 284–301. doi:10.1007/s10956-015-9593-1.
- Jiménez-Aleixandre, M. P., and B. Puig. 2012. “Argumentation, Evidence, Evaluation and Critical Thinking.” In Second International Handbook of Science, Education, edited by B. J. Fraser, K. Tobin, and C. J. McRobbie, 1001–1015. Dordrecht, the Netherlands: Springer. doi:10.1007/978-1-4020-9041-7_66.
- Kolstø, S. D., and M. Ratcliffe. 2008. “Social Aspects of Argumentation.” In Argumentation in Science Education: Perspectives from Classroom Based Research, edited by S. Erduran and M. P. Jiménez-Aleixandre, 117–136. Dordrecht, the Netherlands: Springer. doi:10.1007/978-1-4020-6670-2_6.
- Kuhn, D., T. S. Arvidsson, R. Lesperance, and R. Corprew. 2017. “Can Engaging in Science Practices Promote Deep Understanding of Them?” Science Education 101 (2): 232–250. doi:10.1002/sce.21263.
- Ledley, T. S., J. Rooney-Varga, and F. Niepold. 2017. “Addressing Climate Change through Education.” Oxford Research Encyclopedia of Environmental Science. Accessed 27 January 2021. https://oxfordre.com/view/10.1093/acrefore/9780199389414.001.0001/acrefore-9780199389414-e-56. 10.1093/acrefore/9780199389414.013.56
- Levinson, R. 2006. “Towards a Theoretical Framework for Teaching Controversial Socio-scientific Issues.” International Journal of Science Education 28 (10): 1201–1224. doi:10.1080/09500690600560753.
- Li, K. I., and M. S. Shen. 1992. “Students’ Weaknesses in Statistical Project.” Teaching Statistics 14 (1): 2–8. doi:10.1111/j.1467-9639.1992.tb00195.x.
- Loucks-Horsley, S., N. Love, K. E. Stiles, S. Mundry, and P. W. Hewson. 2003. Designing Professional Development for Teachers of Science and Mathematics. Thousand Oaks, California: Corwin Press, .
- Martin, D. S., A. R. Craft, and H. H. Tillema. 2002. “Developing Critical and Creative Thinking Strategies in Primary School Pupils: An Inter-cultural Study of Teachers’ Learning.” Journal of In-service Education 28 (1): 115–134. doi:10.1080/13674580200200198.
- Moore, D. 1990. “Uncertainty.” In On the Shoulders of Giants: New Approaches to Numeracy, edited by L. Steen, 95–137. Washington, DC: National Academy Press.
- Mueller, M., D. Yankelewitz, and C. Maher. 2014. “Teachers Promoting Student Mathematical Reasoning.” Investigations in Mathematics Learning 7 (2): 1–20. doi:10.1080/24727466.2014.11790339.
- Namdar, B. 2018. “Teaching Global Climate Change to Pre-Service Middle School Teachers Through Inquiry Activities.” Research in Science & Technological Education 36 (4): 440–462. 10.1080/02635143.2017.1420643
- Nashon, S. M., and D. Anderson. 2013. “Interpreting Student Views of Learning Experiences in a Contextualized Science Discourse in Kenya.” Journal of Research in Science Teaching 50 (4): 381–407. doi:10.1002/tea.21078.
- Osborne, J. 2014. “Teaching Scientific Practices: Meeting the Challenge of Change.” Journal of Science Teacher Education 25 (2): 177–196. doi:10.1007/s10972014-9384-1.
- Plomp, T. 2013. “Educational Design Research: An Introduction.” In Educational Design Research – Part A: An Introduction., edited by T. Plomp, T and N. Nieveen. Enschede, the Netherlands: SLO. pp 9–35.
- Plutzer, E., and A. L. Hannah. 2018. “Teaching Climate Change in Middle Schools and High Schools: Investigating STEM Education’s Deficit Model.” Climatic Change 149 (3–4): 305–317. doi:10.3102/0002831209345157.
- Radakovic, N. 2015. “People Can Go against the Government: Risk-Based Decision Making and High School Students’ Concepts of Society.” Canadian Journal of Science, Mathematics and Technology Education 15 (3): 276–288. doi:10.1080/14926156.2015.1062938.
- Ratcliffe, M., and M. Grace. 2003. Science Education for Citizenship. Teaching Socio-Scientific Issues. Berkshire (U.K): McGraw-Hill Education.
- Resnick, I., A. Davatzes, N. S. Newcombe, and T. F. Shipley, T. F. 2017. “Using Relational Reasoning to Learn about Scientific Phenomena at Unfamiliar Scales.” Educational Psychology Review 29 (1): 11–25. doi:10.1007/s10648-016-9371-5.
- Sadler, T. D., and V. Dawson. 2012. “Socio-Scientific Issues in Science Education: Contexts for the Promotion of Key Learning Outcomes.” In Second International Handbook of Science Education, edited by B. J. Fraser, K. Tobin, and C. J. McRobbie, 799–809. Dordrecht, The Netherlands: Springer. doi:10.1007/978-1-4020-9041-7_53.
- Schwarz, B. B., R. Hershkowitz, and N. Prusak. 2010. “Argumentation and Mathematics.” Educational Dialogues: Understanding and Promoting Productive Interaction, edited by K. Littleton and C. Howe. London: Routledge. pp 115–141
- Sevian, H., Y. J. Dori, and I. Parchmann. 2018. “How Does STEM Context-Based Learning Work: What We Know And What We Still Do Not Know”. International Journal of Science Education 40 (10): 1–13. doi:10.1080/09500693.2018.1470346.
- Silverman, D., and A. Marvasti. 2008. “Doing Qualitative Research: A Comprehensive Guide”. Thousand Oaks, California: Sage Publications.
- Ültay, N., and M. Çalık. 2012. “A Thematic Review of Studies into the Effectiveness of Context-based Chemistry Curricula.”.” Journal of Science Education and Technology 21 (6): 686–701. doi:10.1007/s10956-011-9357-5.
- Venville, G. J., and V. M. Dawson. 2010. “The Impact of a Classroom Intervention on Grade 10 Students’ Argumentation Skills, Informal Reasoning, and Conceptual Understanding of Science.” Journal of Research in Science Teaching 47 (8): 952–977. doi:10.1002/tea.20358.
- Voogt, J., and N. P. Roblin. 2012. “A Comparative Analysis of International Frameworks for 21st Century Competences: Implications for National Curriculum Policies.” Journal of Curriculum Studies 44 (3): 299–321. doi:10.1080/00220272.2012.668938.
- Walsh, E. M., and V. V. McGowan. 2017. “‘Let Your Data Tell a Story:’ Climate Change Experts and Students Navigating Disciplinary Argumentation in the Classroom.” International Journal of Science Education 39 (1): 20–43. doi:10.1080/09500693.2016.1264033.
- Wild, C. J., and M. Pfannkuch. 1999. “Statistical Thinking in Empirical Enquiry.” International Statistical Review 67 (3): 223–248. doi:10.1111/j.1751-5823.1999.tb00442.x.
- Wood, T., G. Williams, and B. McNeal. 2006. “Children’s Mathematical Thinking in Different Classroom Cultures.” Journal for Research in Mathematics Education 37: 222–252.
- Zoller, U., and T. L. Nahum. 2012. “From Teaching to Know to Learning to Think in Science Education”. In Second International Handbook of Science Education, edited by B. J. Fraser, K. Tobin, and C. J. McRobbie, 209–229. Dordrecht, the Netherlands: Springer. doi:10.1007/978-1-4020-9041-7_16.