Abstract
A two-dimensional (2D) hydrodynamic assessment of the Nile swamps in southern Sudan has been carried out using DHI MIKE 21 software based on a ground referenced and corrected Shuttle Radar Topography Mission (SRTM) digital elevation model. The model was set up and calibrated using available historical information as well as newly measured data. The results show the model capable of representing the hydraulic conditions in the swamps, allowing the assessment of different flow conditions and their effects on the swamp. The study has established water-level gradients, flow directions and velocities in the swamp, as well as on the seasonal flood plains, and describes the importance of evapotranspiration for losses in the system.
Citation Petersen, G. & Fohrer, N. (2010) Two-dimensional numerical assessment of the hydrodynamics of the Nile swamps in southern Sudan. Hydrol. Sci. J. 55(1), 17–26.
Etude numérique bidimensionnelle de l'hydrodynamique des marais du Nil dans le sud du Soudan
Résumé Une étude bidimensionnelle (2D) du fonctionnement hydrodynamique des marais du Nil dans le sud du Soudan a été réalisée en utilisant le logiciel DHI MIKE 21, basée sur un modèle numérique de terrain fourni par le projet SRTM (Shuttle Radar Topography Mission), référencé au sol et corrigé. Le modèle a été établi et calé à partir de données historiques et de mesures récentes. Les résultats montrent que le modèle est capable de représenter le fonctionnement hydrodynamique des marais, et permet de simuler différentes conditions hydrauliques ainsi que leurs impacts sur les marais. L'étude a permis de définir les gradients hydrauliques, les directions et les vitesses des écoulements dans les marais, ainsi que dans les plaines d'inondation saisonnière, et décrit l'importance de l'évapotranspiration en tant que perte dans le système.
INTRODUCTION
The Sudd swamps of southern Sudan, one of the largest wetland areas in Africa, are defined by seasonal flooding and are responsible for the loss of large quantities of the inflowing waters of the White Nile, here called the Bahr el Jebel. Evaluating flow data from Hurst (Citation1933 and supplements), approximately half of the inflowing waters are lost between Mongalla and Malakal, the entrance and exit, respectively, of the swamp system.
Historical information about the region is mainly available from studies carried out during the last century. Hurst & Phillips (Citation1931, Citation1938) and Butcher (Citation1938) were the first to carry out intensive research in the Sudd swamps, describing hydro-meteorological conditions. Shrinking and swelling of the Sudd soils was investigated by Migahid (Citation1948). The Jonglei Investigation Team (JIT) (Citation1954) mapped the soil types of the Sudd and defined the area in the immediate vicinity of the swamps as sudd or toic soils. The former expression refers to the whole of the Sudd area, the latter refers to the flood plains. Mefit-Babtie (Citation1983) collected humidity, sunshine and temperature data during the Jonglei Canal studies at Bor and Malakal, and described the seasonal cycle of water-logging and desiccation leading to deep cracking of the soil. Wright, in JIT (Citation1954) gave initial hints on soil water recharge, with values of between 300 and 800 mm, assuming that the latter was overestimated. Sutcliffe (Citation1974) described the vegetation distribution of different species in the swamps, and Petersen et al. (Citation2007) added a description of the vegetation dynamics with regard to changes in the permanent swamps. The influence of the area morphology on flooding was analysed by Petersen et al. (Citation2008a), who evaluated flooding conditions in local depressions. Petersen & Fohrer (Citation2010) described the flooding and drying mechanisms of the seasonal flood plains of the swamp.
The Sudd has been assessed using different mathematical (Sutcliffe & Parks, Citation1987) and numerical (Mohamed, Citation2005) approaches. While these models give a good overview of the general water budget of the overall system, a comprehensive analysis of the hydrodynamics of the flood plains and of their spatial extent with consideration of all the factors involved is not available.
The swamps and flood plains are important features of the area in terms of their ecological and economic value. Detailed knowledge of their function and a full understanding of the system are important for any future planning tasks. The objectives of this paper are: to investigate the processes and mechanisms of the flood cycle in the swamps and on the flood plains, and to describe the hydrodynamic situation under different flow conditions. Specific objectives include the assessment of individual spatial flow patterns in the swamps and on the flood plains, as well as an evaluation of interdependencies and the spatial distribution of flow velocities and inundation depths. In order to investigate these aspects, a two-dimensional (2D) hydrodynamic modelling approach was chosen.
MATERIALS AND METHODS
The study site
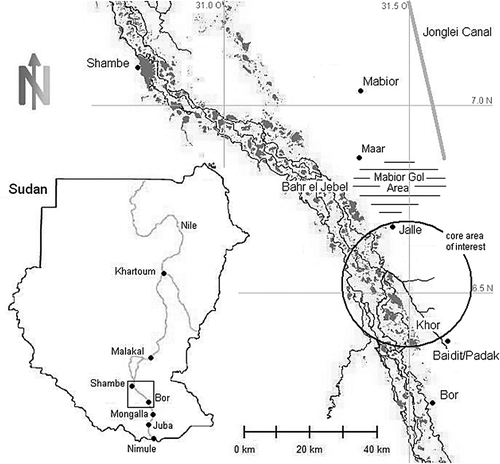
The study site stretches from Mongalla, the upstream entrance of the Sudd swamps, to a line north of Shambe in the centre of the swamps, covering an area 130 km × 220 km west to east and south to north, respectively, as shown in . The assessment area was chosen considering data availability from hydrometeorological measuring stations, flow measurements, flood-plain inundation information and surveyed ground control points. A larger domain size with equal grid-cell size would have further increased computational requirements and model run time.
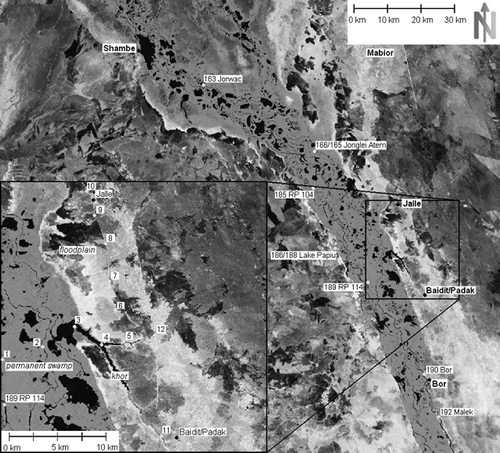
Fig. 1 Overview of the assessment area; the model was set up between Mongalla and Shambe, and the image shows main channels and lagoons in this area. The core area of interest, which has been assessed in detail, is located on the right bank between Baidit/Padak and Jalle.
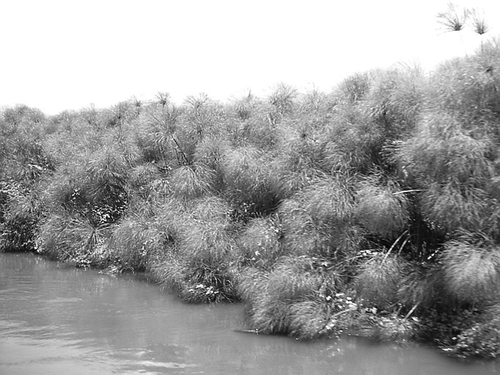
The area has a varying topography, as described by Petersen et al. (Citation2008a). The river meanders within an incised trough between Mongalla and Bor, then heads into an unrestricted flood-plain area between Bor and Shambe. The ground slopes within this area show a gradient of 1/10 000 from south to north. DEM analysis shows that north of Bor the river forms an inland delta and flows on an elevated ridge (Petersen et al., Citation2008a), laterally not restricted by banks but by permanently inundated vegetation, mostly papyrus and reeds (). These swamps contain varying numbers of multiple river channels and lagoons. Depending on flow and wind conditions, parts of the papyrus fields can become dislodged and can block channels, leading to a highly dynamic system (Petersen et al., Citation2007). Flow within the reed fields has been estimated as 7% of the cross-sectional flow in the permanent swamp area (Petersen et al., Citation2008a). Historical assessments to evaluate the flow within the reed fields, conducted by Butcher (Citation1938), indicated that these areas carry part of the flow, but a detailed cross-sectional flow distribution in the swamps has not been quantified.
Fig. 2 Papyrus: dense swamp vegetation, typically with a height of between 3 and 5 m.
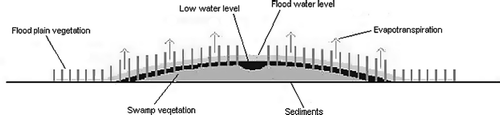
The water levels within this vegetation are controlled by lateral spill from the river channels, as well as resistance to flow and evapotranspiration of the papyrus vegetation. The spill feeds into this vegetation and water levels decline with distance from the river towards the flood plains, the slope being shaped by flow restriction through reeds and losses through evapotranspiration processes. A schematic sketch is shown in .
Fig. 3 Schematic cross-section of the Sudd swamps north of Bor showing the river channel on the inland delta sediment ridge and the lateral water level gradients caused by spill, evapotranspiration and flow resistance.
The boundary of the permanently inundated swamp area is marked by the transition between swamp vegetation and grass species. The system is dominated by the annual cycle of flooding and drying, controlled by changing inflows that are based on discharges from the Equatorial Lakes, heavy local rainfall and evapotranspiration. In the rainy season, the river level rises and spill increases, which leads to a general rise in water level throughout the system, causing spreading inundation of the seasonal flood plains. With the start of the rainy season, the grasses on these plains grow quickly and are always higher than the water level, causing high resistance to flow. These grasses dry after the end of the rains and when flood waters have evaporated. The residues are typically removed by bushfires. With the onset of the rains, vegetation growth on the flood plains starts again.
The soils of the Sudd region have been found to be typical African flood plain black cotton soils with high clay content, classified as vertisols (IUSS Working Group WRB, Citation2006) which in the dry season are heavily cracking. The layers below the topsoil consist of impermeable clay, which extends to a depth of 12–20 m, followed by sandy material (Petersen, Citation2008).
Hydrological conditions
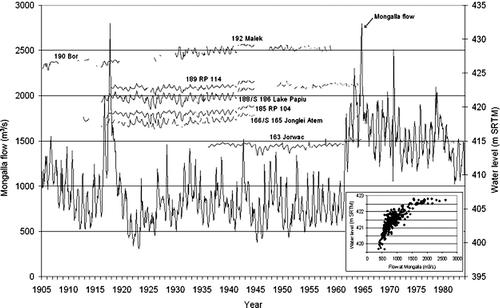
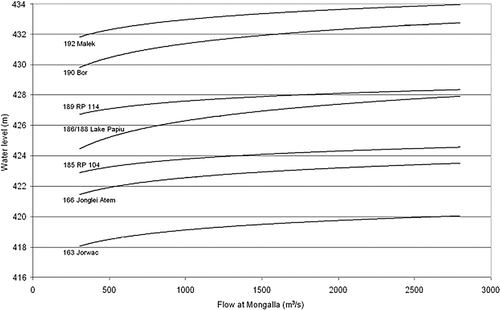
Hydrological conditions in the area are controlled by the outflow from the Equatorial Lakes and the seasonal torrent runoff in the area between these lakes and Mongalla (Petersen et al., Citation2008b). Within the swamp, flows are not sufficiently gauged to describe the whole cross-sectional flow, but water levels measured at different locations give a good overview of the conditions under different flow regimes (). The long-term quality of the data has been assessed based on their stage–discharge relationship over time.
Fig. 4 Flows at Mongalla and water-level records at different locations in the southern Sudd swamps, derived from Hurst & Phillips (Citation1932 and Supplements). The levels given in NKL (New Khartoum Level) datum were corrected to SRTM levels. Flows and levels are directly related as shown in the inlay. The locations of the numbered stations are shown in Fig. 5.
Soil water recharge is an important process in the area. After the dry season, the soils recharge up to 350 mm of water before becoming impermeable and allowing flooding to take place (Petersen, Citation2008). A defined rainy season can be observed between April and October, with a long-term average of 847 mm of annual rainfall. Yearly evapotranspiration in the swamps averages up to 2075 mm/year, with measurements showing maximum rates of up to 20 mm/d (Petersen, Citation2008).
The DHI MIKE 21 model
The MIKE 21 model (DHI, Citation2008) is a professional engineering software package for the simulation of flows, waves, sediments and water quality in rivers, lakes, estuaries, bays, coastal areas and seas. The full time-dependent nonlinear equations of continuity and conservation of momentum are solved by implicit finite-difference techniques with the variables defined on a space-staggered rectangular grid. The hydrodynamic module simulates the water-level variations and flows in response to defined boundary conditions, including: upstream and downstream water levels or flows, precipitation, evaporation and infiltration in the model area. It solves the vertically integrated equations for the conservation of continuity and momentum, i.e. the Saint Venant equations, on its rectangular grids covering the area of interest, provided with the bathymetry, bed resistance coefficients and boundary conditions. The effects of sources and sinks like soil water recharge, precipitation and evaporation, river discharge and intakes are included in the hydrodynamic equations.
Model set-up, sensitivity and calibration
The model was set up using a corrected SRTM (Shuttle Radar Topography Mission) DEM (NASA, Citation2008a). For this DEM, corrections from ground control points were applied and the new corrected levels interpolated. Channel and lagoons digitized from Landsat (NASA, Citation2008b) images were imprinted into the DEM with depths of 6.1 and 3.0 m, respectively (Petersen et al., Citation2008a). The DEM was further evaluated regarding errors, and corrected to represent both an appropriate channel and lagoon network and realistic surface elevations in the densely vegetated areas where the SRTM would exaggerate ground elevations (Hofton et al. Citation2006). For these areas, based on comparison with collected ground-truthing data from Euroconsult (Citation1981) and Hassan et al. (Citation2006), a correction of 0.8 m was applied. The model area was meshed using a 100 m rectangular grid, with a total number of 2 860 000 cells for the domain. The upstream boundary cross-section was represented by 120 cells, the downstream boundary by 400 cells.
Two open boundaries were defined over the respective full cross-section of the swamp, with the upstream boundary at Mongalla controlled by inflow and the downstream boundary near Shambe controlled by water level. Average daily evapotranspiration was set as 0.007 m as a daily average value; flooding and drying depths were set to 0.35 and 0.1 m, respectively, with the flooding depth representing an assumed soil water recharge value of 350 mm (Petersen, Citation2008). These values were varied for carrying out sensitivity runs. Roughness values were set using a map file representing water bodies, permanent swamp area and seasonal flooded grasslands, based on recommendations of the Conveyance Estimation System (Wallingford Software Ltd, Citation2006) but adapted for model calibration purposes. Results were recorded at defined locations within the swamp area (), for which data from monitoring stations were available to compare steady-state simulation results with measured values under comparable flow conditions. In addition, spatially-distributed results were generated and evaluated for a core area between Baidit/Padak and Jalle, where the most accurate measured flood extent and inundation depth data for the flood plains were available (Hassan et al., Citation2006). The model area with the enlarged core assessment area is shown in .
Fig. 5 Dry season Landsat image of the model area showing the swamp with water-level monitoring station numbers and locations, as well as the enlarged core assessment area between Baidit/Padak and Jalle with numbers of further monitoring locations.
A wide range of roughness values have been tested. Based on sensitivity and calibration results, final Manning values (1/n) of 100, 9 and 5 were selected for the water courses, papyrus fields and flood plains, respectively. These values mark extreme variations of standard literature values, but were necessary in order to calibrate the model to achieve optimum results. Vegetation dynamics (Petersen et al., Citation2007) have been neglected in the assessment. Sensitivity analyses were carried out to test the model behaviour for a range of individually tested parameters, as shown in . The findings of these analyses were used to calibrate the model and to estimate the level of confidence in the model results. In addition, the effects of precipitation and evapotranspiration on the flood patterns were tested to determine their significance.
Table 1 Parameters used for sensitivity assessment
Boundary conditions for representative steady-state high- and low-flow conditions (with respectively 1000 and 2000 m3/s swamp inflow at Mongalla), as well as calibration parameters, were then combined to calibrate and validate the model based on historical measured data. Changes in flow directions and velocities within the swamps and on the seasonal flood plains, expected to occur with changing inflow conditions, were assessed. For the assessment, inflows that were relatively higher and lower than the preceding inflow conditions were simulated. Changes were observed with special interest in the flood-plain flow conditions.
RESULTS
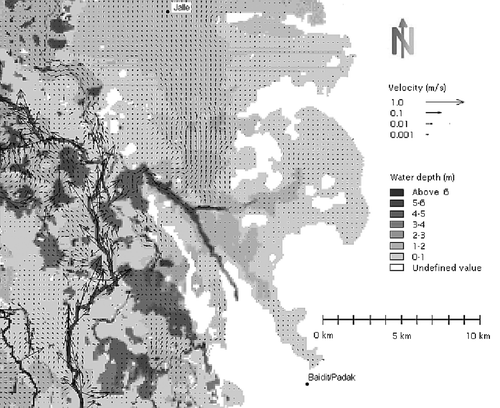
The calibrated model shows qualitatively realistic behaviour in generating natural water levels under the modelled low-flow dry season and high-flow rainy season conditions, as shown in the calibrated model results for the Baidit/Padak region ( and ). The flood extent is limited to the permanent swamp boundaries in the dry season and covers the flood-plain area in the rainy season. Modelled water depths on the flood plains during inundation reach values of up to 1.2 m.
Fig. 6 Water depth, inundation extent and velocities under typical dry season low-flow conditions (1000 m3/s swamp inflow at Mongalla). While the channel flow velocities are well visible, flow velocities within the papyrus areas are hardly visible due to their small values.
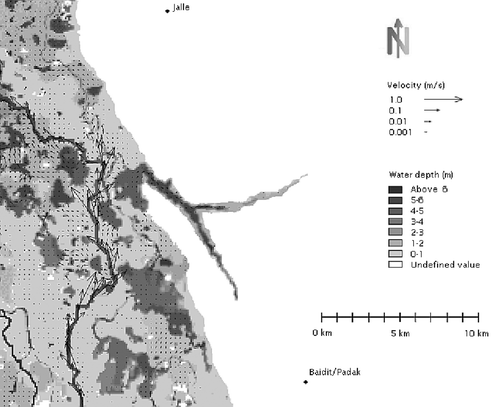
Fig. 7 Water depth, inundation extent and velocities under typical rainy season high flows (2000 m3/s swamp inflow at Mongalla) in the core assessment area. Water is flowing down the seasonal flood plains, which are inundated under these conditions.
Velocities and flow directions resulting from the model runs have been assessed at different locations in the channels, swamp vegetation, khors (shallow depressions that lead inland from the swamps) and on the flood plains under different flow conditions. The model results show flows of up to 1.5 m/s and an average of 0.6 m/s in the channels, while flows in the swamp vegetation and on the flood plains are limited to 0.005 m/s on average. Flow directions on the seasonal flood plains, assessed with runs simulating both increased and decreased inflow, show a continuous flow pattern in the downstream direction over the plains ( and ), but no return flow into the swamp, even under decreasing boundary inflow conditions. This situation is related to the water levels generally sloping away from the swamp towards the flood plains.
The same pattern was also found for water levels and flows in the khors, where water levels are sloping away from the swamp, under all assessed conditions. The onset of flooding including water levels on the flood plains is dependent on exceeding an inflow threshold into the system at Mongalla with a relationship as shown in .
Fig. 8 Inflow–water level relationship for different station locations in the model area (as shown in Fig. 5). The curves, corrected to SRTM level, may vary depending on the long-term flow regime with related vegetation dynamics. Station names are given together with the respective station numbers.
The summarized model results show:
average velocities of 0.5 and 0.8 m/s for dry season and rainy season conditions, respectively, for the channels; | |||||
velocity values of 0.001 to 0.01 m/s within the papyrus and reed areas, flowing towards the flood plains; | |||||
water levels and the flood extent are reasonably represented, as shown in the calibrated model results for the Baidit/Padak region ( and ); | |||||
qualitative assessments show water levels sloping away laterally from the main channels under all conditions; | |||||
the inflow towards the flood plains occurs along a water level gradient from the main channels through side channels and lagoons as well as khors (); | |||||
even under decreasing inflow conditions at Mongalla, no return flow occurs from the flood plains to the swamps and the general water level gradient from the channel towards the swamp, while varying in slope, is maintained under all assessed conditions; | |||||
the elements of soil water recharge, precipitation, evapotranspiration and floodwater inflow have varying influence; and | |||||
soil water recharge was found to have a significant effect on the flooding pattern. The effect is altered by precipitation which may have a strong influence on soil water recharge depending on intensity and the timing before the inflow of floodwaters from the swamps. | |||||
Sensitivity runs for parameters as listed in show that the bathymetry correction and roughness parameters have a controlling influence on the performance of the system. The results indicate that:
Bathymetry settings to compensate for the exaggerated representation of ground elevation of the SRTM data for water bodies and vegetation have an important influence on the system. The papyrus fields were found to be well represented after a correction value of, on average, –0.8 m was applied. Due to a lack of ground reference points in the downstream model area, the DEM data for this respective area has not been used for detailed assessments. | |||||
Inflow has a direct influence on the system and, in combination with the DEM correction and roughness, is the main factor for the distribution, extent and depth of inundation in the swamps and on the flood plains. In contrast, downstream water levels have no effect for most of the upstream system, while they control inundation depth and extent in the vicinity of the downstream boundary. | |||||
Flooding depth settings were used successfully to simulate soil water recharge effects neglecting the first 0.35 m of flooding without allowing for permanent infiltration. | |||||
Evapotranspiration has a visible influence on the spread of flooding over time and in regulating the flood extent. | |||||
Precipitation and the influence of this parameter on the system has been found negligible for normal cases while extreme events show short-term effects in the flooding area. | |||||
Flow resistance is the most sensitive parameter for model calibration. | |||||
DISCUSSION
Model performance
The model performance and ability to simulate the described high- and low-flow conditions in the swamps has been assessed by comparing modelled to measured parameters, including velocity, flow direction and water depth. The model results for the channels show average velocities of 0.5 and 0.8 m/s for dry season and rainy season conditions, respectively. These velocities compare well with the measured average velocity of 0.47 m/s, measured during a dry season field campaign in 2005/06 (Hassan et al., Citation2006). Modelled velocities within the papyrus and reed areas show values of 0.001 to 0.01 m/s, flowing towards the flood plains. These values are comparable to measured velocities of 0.0 to 0.1 m/s (average: 0.003 m/s) as measured in the same 2005/06 field campaign.
The assessment of the model results regarding modelled and measured water levels was split into a quantitative comparison for the permanent swamp area and a qualitative comparison for the seasonal flood plains, as for the latter stage–discharge relationships between system inflow at Mongalla and water levels on the flood plains do not exist. Instead, for the flood plains the comparison was based on observations obtained during the 2005/06 field campaign (Hassan et al., Citation2006). Based on these comparisons, water levels and flood extent generated by the model under the modelled low-flow dry season and high-flow rainy season conditions compare well to the recorded data and 2005/06 field campaign observations. For both the dry season and flood season conditions, both the water levels and the flood extent were reasonably represented, as shown in the calibrated model results for the Baidit/Padak region ( and ). Modelled water depths on the flood plains during flood conditions compare well to measured values of up to 1.2 m, measured during the field campaign. Water levels within the system are directly related to different inflow conditions at Mongalla, with vegetation dynamics causing local changes. The threshold value for the onset of flood plain inundation can be assumed to vary depending on the long-term flow regime with its related vegetation dynamics over time (Petersen et al., Citation2007). These long-term variations can also explain the water level differences between modelled and measured conditions.
Qualitative assessments also show water levels sloping away laterally from the main channels under all conditions, reflecting natural conditions. This situation results from the high evapotranspiration rates and flow restrictions in the papyrus fields and on the flood plains leading to a steady flow into these loss areas.
A comparison of model results with stage–discharge averaged measured water levels for the overall investigation area shows an average water level difference of 0.17 m considering the main swamp stations as shown in . The comparison was restricted to the permanent swamp area. For the flood plains no data sets are available that have both Mongalla flows and flood plain levels, as the Mongalla gauge was destroyed after 1982. The results were therefore judged qualitatively. Based on comparison of historical with measured data from within the permanent swamp with recently measured permanent swamp and flood plain water levels (Hassan et al., Citation2006), the above flooding depths on the flood plains were compared, showing realistic values. The comparison is shown in .
Table 2 Comparison of both measured historical and recent water levels and modelled water levels.*
Seasonal flood-plain flows
The Sudd swamps can be divided into channels, lagoons, vegetated swamp and seasonal flood plains with different hydraulic conditions. While the model performance was confirmed by comparing the results for areas within the permanent swamp with measurements, flow patterns in the seasonal flood plains were unknown and had so far only been assessed by comparing water level differences. This led to suggestions that flows are unidirectional and waters entering the flood plains do not return to the swamp during low water periods, but remain on the flood plains until they evaporate from there (Petersen, Citation2008).
The model results () confirm this general assumption, and show that the inflow towards the flood plains occurs along a water-level gradient from the main channels through side channels and lagoons, as well as khors. Model results show no return flows under decreasing inflow conditions at Mongalla, and the general water level gradient from the channel towards the swamp, while varying in slope, is maintained under all assessed conditions, as shown in . The discrepancy between measured and modelled values may be explained with slight inflow differences and different vegetation conditions. As described, the same condition applies for the khors, leading to the conclusion that the khor's function is to convey water from the swamps inland, contributing to flood-plain flooding, but not to allow runoff to drain from the flood plains into the swamp.
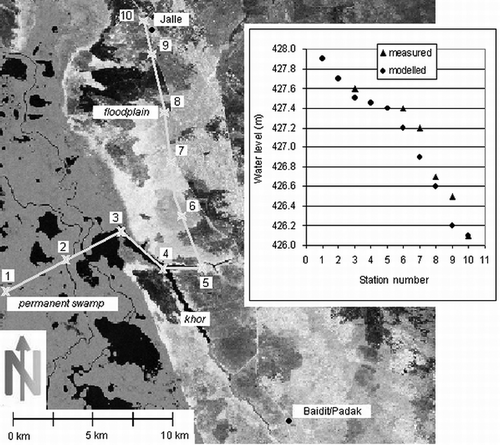
Fig. 9 Modelled and measured water-level gradient along a line from the centre of the swamps through lagoons and khors onto the seasonal flooded grasslands under rainy season average high-flow conditions (2000 m3/s at Mongalla). The Landsat background image (NASA, Citation2008b) shows dry season conditions for better visualization.
Components of flooding cycle
While groundwater interaction has not been assessed, assuming it to be negligible due to the deep and impermeable clay soils (Petersen, Citation2008), the elements of soil water recharge, precipitation, evapotranspiration and floodwater inflow have been assessed with the model. Soil water recharge was found to have a significant effect on the flooding pattern. The effect is altered by precipitation which may have a strong influence on soil water recharge, depending on its intensity and timing before the inflow of floodwaters from the swamps. Floodwater inflow, overlaid by evapotranspiration, has the most significant influence on area flooded () and is directly related to Mongalla flows, as shown in .
CONCLUSIONS
A 2D numerical model was set up to assess the Bor‐Mabior area of the Sudd swamps in southern Sudan. Based on comparisons with measurements and observations, the model was found capable of representing the hydrodynamic conditions in the area and was successfully used to assess the flow patterns on the seasonal flooded grasslands. The main findings of the modelling exercise include:
-
The corrected SRTM DEM is a reliable representation of the topography of the core area of interest, for which a sufficient number of ground control points and vegetation information were available.
-
Water-level gradients in the permanent swamp area and the khors have been established as sloping away from the main channels towards the flood plains under all assessed conditions. This leads to a permanent flow away from the channels into the swamp and, at high water levels, onto the flood plains. Waters that enter the flood plains do not return to the swamps, but are lost by evapotranspiration.
-
Modelled flow velocities in the channels, the papyrus swamps and on the flood plains have been established for a range of conditions, showing values of 0.5–0.8, 0.001–0.01 and 0.001–0.006 m/s, respectively. Measured values of 0.47 and 0.0–0.1 m/s for the channels and papyrus areas, respectively, confirm that the model results are reasonable.
-
Flooding of the seasonally inundated grasslands was found to be directly related to the flows entering the swamps at Mongalla. It can be assumed that the relationship is highly dependent on the long-term flow regime and is altered through vegetation dynamics, a matter that would need assessment in further detail.
It needs to be considered that the model was calibrated explicitly for the Bor-Mabior area and delivers good results there, while further refinements and calibration would be necessary for areas further upstream or downstream. The results of this study will be important for future assessments, including sediment and nutrient transport towards the flood plains, and further assessment of infrastructural plans, including dike construction projects and potential water withdrawal schemes, which, depending on the amount of water diverted may have a significant impact.
Acknowledgements
The modelling software for this study was provided by Dr Ole Larsen, DHI, Germany, and proved to be a useful assessment tool under these extreme conditions. John Sutcliffe's comments on a first draft as well as the reviewers' valuable input are acknowledged.
Related Research Data
REFERENCES
- Butcher , A. D. 1938 . The Sadd Hydraulics , Cairo, Egypt : Government Press .
- DHI (2008) MIKE21 http://www.dhigroup.com/Software/Marine/MIKE21.aspx (Accessed: 11 March 2008 ).
- Euroconsult . 1981 . Kongor Flood Protection Surveys , Arnhem, , The Netherlands : Draft Final Report .
- Hassan , R. , Scholes , R. J. , Marneweck , G. , Petersen , G. , Mungatanga , E. , Wahungu , G. , Batchelor , A. , Thompson , M. , Rountree , M. , Lo-Liyoung , C. , Crosskey , S. , Ipoto , L. , Kuot , P. and Echessah , P. 2006 . “ Environmental impact assessment of the Bor Counties Dyke Rehabilitation Project ” . South Africa : CEEPA, Univ. of Pretoria .
- Hofton , M. , Dabuyah , R. , Blair , J. B. and Rabine , D. 2006 . Validation of SRTM elevations over vegetated and non-vegetated terrain using medium footprint LiDAR . Photogram. Engng Remote Sens. , 72 ( 3 ) : 279 – 285 .
- Hurst , H. E. 1933 . The Nile Basin, vol. IV and supplements 1–13. Ten Day Mean and Monthly Mean Discharges of the Nile and its Tributaries , Cairo, Egypt : Government Press .
- Hurst , H. E. and Phillips , P. 1931 . The Nile Basin, vol. I. General Description of the Basin, Meteorology, Topography of the White Nile Basin , Cairo, Egypt : Schindlers Press .
- Hurst , H. E. and Phillips , P. 1932 . The Nile Basin, vol. II and supplements 1–13. Measured Discharges of the Nile and its Tributaries , Cairo, Egypt : Government Press . and supplements
- Hurst , H. E. and Phillips , P. 1938 . The Nile Basin, vol. V. The Hydrology of the Lake Plateau and the Bahr el Jebel , Cairo, Egypt : Schindlers Press .
- IUSS Working Group WRB . World reference base for soil resources 2006 . World Soil Resource Report no. 103 . 2006 . FAO, Rome, Italy
- JIT (Jonglei Investigation Team) . 1954 . The Equatorial Nile Project and its Effects on the Anglo-Egyptian Sudan , Khartoum, , Sudan : Sudan Government .
- Mefit-Babtie Srl . 1983 . “ Development studies of the Jonglei Canal Area, range ecology survey ” . Khartoum, Sudan : Mefit-Babtie . Final Report, vol. 2, Background
- Migahid , A. M. 1948 . Report on a botanical excursion to the Sudd region , Cairo, Egypt : Fouad University Press .
- Mohamed , Y. A. 2005 . The Nile Hydroclimatology: Impact of the Sudd Wetland , London, , UK : Taylor & Francis Group plc .
- NASA (2008a) Shuttle Radar Topography Mission http://www2.jpl.nasa.gov/srtm/ (Accessed: 12 December 2008 ).
- NASA (2008b) The Landsat Program http://geo.arc.nasa.gov/sge/landsat/landsat.html (Accessed: 12 December 2008 ).
- Petersen, G. (2008) The hydrology of the Sudd—hydrologic investigation and evaluation of water balances in the Sudd swamps of southern Sudan. PhD Thesis, Ecology Centre, University of Kiel, Germany http://eldiss.uni-kiel.de/macau/receive/dissertation_ diss_00003028
- Petersen , G. , Abeya , J. A. and Fohrer , N. 2007 . Spatio-temporal water body and vegetation changes in the Nile swamps of southern Sudan . Adv. Geosci. , 11 : 113 – 116 .
- Petersen , G. , Sutcliffe , J. V. and Fohrer , N. 2008a . Morphological analysis of the Sudd region using land survey and remote sensing data . Earth Surf. Processes Landf. , 33 ( 11 ) : 1709 – 1720 .
- Petersen , G. , Bast , H. and Fohrer , N. 2008b . Estimation of ungauged Bahr el Jebel flows based on upstream water levels and large scale spatial rainfall data . Adv. Geosci. , 18 : 9 – 13 .
- Petersen , G. and Fohrer , N. 2010 . Flooding and drying mechanisms of the seasonal Sudd flood plains along the Bahr el Jebel in Southern Sudan . Hydrol. Sci. J , 55 ( 1 ) : 4 – 16 .
- Sutcliffe , J. V. 1974 . A hydrological study of the southern Sudd region of the Upper Nile . Hydrol. Sci. Bull. , 19 ( 2 ) : 237 – 255 .
- Sutcliffe , J. V. and Parks , Y. P. 1987 . Hydrological modelling of the Sudd and Jonglei Canal . Hydrol. Sci. J. , 32 ( 2 ) : 143 – 159 .
- Wallingford Software Ltd . 2006 . Conveyance Estimation System Wallingford, , UK