Abstract
The snow mapping algorithm SNOWMAP was adapted to Landsat-TM data and to the context of eastern Canada. Six Landsat-5 TM scenes were used. It was found that the original version of SNOWMAP greatly underestimates snow cover extent. The modification made to the original algorithm, by cancelling the minimum threshold of 0.1 on the NDVI value, allows gaps to be filled in. In addition, a spatial correction procedure applied to the modified SNOWMAP algorithm results improves snow detection under coniferous forests. Based on a limited data set of ground-based observations (only 40 sites were available), the modified SNOWMAP seems to perform better in snow detection than the original version of the algorithm. An application case is presented in order to demonstrate the relevance of the modified SNOWMAP results as a high spatial-resolution reference for the validation of historical snow maps derived from medium spatial-resolution satellite data.
Citation Chokmani, K., Dever, K., Bernier, M., Gauthier, Y. & Paquet, L.-M. (2010) Adaptation of the SNOWMAP algorithm for snow mapping over eastern Canada using Landsat-TM imagery. Hydrol. Sci. J. 55(4), 649–660.
Résumé L'algorithme de cartographie de la neige SNOWMAP a été adapté aux données Landsat-TM et au contexte du territoire de l'Est du Canada. Six scènes de Landsat-5 TM ont été utilisées. Il a été constaté que la version originale de SNOWMAP sous-estime largement l'étendue du couvert nival. La modification de la version originale de l'algorithme en supprimant le seuil minimum de 0.1 sur la valeur de NDVI permet de combler ces lacunes. En outre, une procédure de correction spatiale appliquée aux résultats de l'algorithme SNOWMAP modifié permet d'améliorer la détection de la neige sous les forêts de conifères. En se basant sur un ensemble de données limité d'observations au sol (seulement les données de 40 sites étaient disponibles), la version modifiée de SNOWMAP semble plus performante dans la détection de la neige que la version originale. Un cas d'application est présenté afin de démontrer la pertinence d'utiliser les résultats de la version modifiée de SNOWMAP comme données de référence à haute résolution spatiale pour la validation des cartes de neige sur l'Est du Canada établies à partir des données historiques provenant de données satellitaires à moyenne résolution spatiale.
INTRODUCTION
Within the framework of a study aimed at validating the snow-related component of the Canadian Regional Climate Model (CRCM) (Caya & Laprise, Citation1999), an algorithm for historical (1988–1999) snow cover mapping over Eastern Canada (Quebec and Labrador) was developed (Chokmani et al., Citation2006b). This algorithm combines the snow mapping results obtained using two individual snow detection techniques: one is based on data from the optical sensor NOAA-AVHRR (Chokmani et al., Citation2005, Citation2006a) and the other uses data from the passive microwave sensor DMSP-SSM/I (Langlois, Citation2003; Langlois et al., Citation2004). This algorithm allows mitigation of the disadvantages related to each type of data: presence of clouds in the case of the optic sensor and insufficient space resolution in the case of the passive sensor.
The validation of results from such an algorithm generally involves ground observations of snow at meteorological stations and/or snow courses. However, this implies comparing point information with information integrated over several km2 (1 × 1 km, in the case of AVHRR and 25 × 25 km for SSM/I), which is not optimal. It would be interesting to have access to surface-based information (rather than point-based information) on snow extent which can be used as a reference data set for validation purposes. This kind of information can be obtained using medium to very high spatial resolution satellite imagery (MODIS, SPOT, LANDSAT, ASTER, QUICKBIRD, etc.). However, the only data available for the period of interest (1988–1999) were from Landsat or SPOT sensors. Several approaches have been proposed for snow mapping from Landsat imagery, which has a spatial resolution of 30 × 30 m, for a scene extent of 180 × 180 km (Dozier, Citation1989; Rosenthal & Dozier, Citation1996; Vikhamar & Solberg, Citation2002; Shimamura et al., Citation2006).
According to Shimamura et al. (Citation2006), the method based on the Normalized Difference Snow Index (NDSI) is the most widely used approach due to its simplicity and transparency. In 1995, Hall et al. (Citation1995) proposed an algorithm (Snowmap) to further improve snow detection using NDSI. The Snowmap algorithm was initially designed to be applied on a global scale to MODIS data which have a spatial resolution of 250 m. This algorithm was originally developed and tested using the Landsat-TM data (larger bandwidth, 30-m resolution) prior to the MODIS sensor launching. Since then, improved versions of the Snowmap algorithm have been proposed (Klein et al., Citation1998; Hall et al., Citation2001, Citation2002; Riggs & Hall, Citation2004).
Therefore, the objectives of this study are: (1) to test the capacity of the Snowmap algorithm in the context of the eastern Canada (Quebec and Labrador) conditions, and (2) to adapt the algorithm to perform better in these specific conditions. The local-scale snow maps created here will ultimately be used to validate regional-scale snow maps produced using AVHRR and SSM/I data.
It should be noted that eastern Canada is a region dominated by boreal forest. In the northern part, this latter is mainly composed of conifers, adapted to rigorous cold and frost-resistant. The stands are dense, dark and strongly obstruct the reheating of the ground by solar radiation. The deciduous stands are less frequent and they are mainly located in the southern part of the territory. The forest is scattered with frequent clearings often corresponding to peat bogs or lakes.
BACKGROUND
The NDSI is an index based on the high reflectance of snow in the visible (0.52–0.60 μm) and its strong absorption properties in the mid-infrared (1.55–1.75 μm) corresponding to bands 3 and 5 of the Landsat-TM sensor (
Equationequation (1)(1)), respectively. This last band allows the differentiation of snow and clouds which both have a high reflectance in the visible. However, clouds have a reflectance generally higher in mid-infrared (Dozier, Citation1989). To distinguish the snow-covered surfaces, a threshold value of NDSI equal to 0.4 is usually employed. Below that threshold, the surfaces are considered without snow. NDSI is defined as:
The Snowmap algorithm was intended to be an improvement of snow detection using NDSI. To determine if a pixel is snow-covered using the most elaborated version of Snowmap, it must meet three criteria: (1) the pixel must have a NDSI value higher than 0.4, which allows separation of snow from other types of surfaces and from most clouds; (2) the pixel must have a reflectance value in the near infrared (0.76–0.90 μm: Band 4 of Landsat-TM or Band 2 of MODIS) higher than 0.10, which helps to eliminate liquid water bodies that may have a high NDSI value; and (3) the pixel must have a reflectance value in the green (0.52–0.60 μm: Band 2 of Landsat-TM or Band 4 of MODIS) above 0.10, which helps to prevent forest areas with low reflectance in the visible.
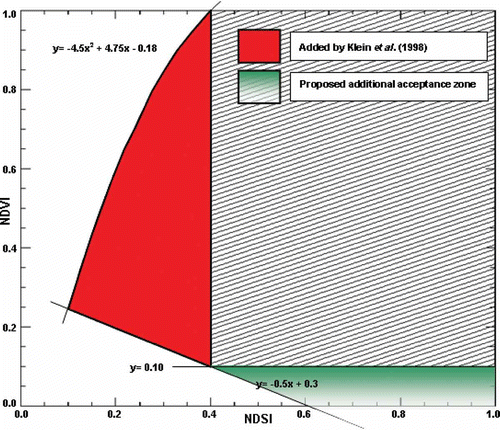
In the forested areas having a vegetation density less than 50%, the accuracy of the classification of Snowmap is more than 96%. However, in areas where the density of vegetation exceeds 50%, the accuracy of the classification is less than 71% (Klein et al., Citation1997, Citation1998). In addition, it was found that the NDSI combined with the vegetation index, Normalized Difference Vegetation Index (NDVI, Equationequation (2)(2)) produce a strong signal that can be used for the detection of snow in a dense coniferous forest. The case of deciduous forests is less problematic since they behave like open forest in winter (without leaves). An additional zone of acceptance has been introduced, taking into account the two indices: NDSI and NDVI (Klein et al., Citation1998), where:
Fig. 1 Acceptance zone of the Snowmap algorithm (Klein et al., Citation1998, Riggs & Hall, Citation2004). Not documented, zone limits equations have been estimated by the authors (x and y represent NDSI and NDVI, respectively).
DATA
Landsat-TM imagery
Six Landsat-5 TM scenes were used (). The sites were selected according to several criteria. The images should be acquired during the melting snow period (i.e. during April or May, depending on latitude). This season is the most critical period for snow detection using satellite imagery. The images should also be free of clouds or have the lowest possible cloud cover. We also had to take into account the availability of information about snow on the ground. However, this criterion was difficult to meet since the density and spatial distribution of the ground-based observations network are not optimal (the number of stations in the centre, northern and eastern part of the territory is very small compared to the populated area in the south; ). In addition, all the Landsat scenes should be distributed along two specific axes. The west–east axis corresponds to a climate gradient (continental versus ocean influence), while the north–south axis corresponds to a gradient of the type and density of vegetation (open lands versus densely vegetated areas). These scenes should also cover a variety of land cover types (boreal forest, deciduous forest, agricultural zone, populated areas, etc.; ). As the first step, the images were corrected for atmospheric effects (using atmospheric standard conditions for winter mid-latitude, rural areas conditions) and orthorectified.
Fig. 2 Land cover types over the studied territory (from Cihlar & Beaubien, Citation1995) and emplacement of the selected Landsat-TM images. Reproduced with the permission of Natural Resources Canada, 2010.
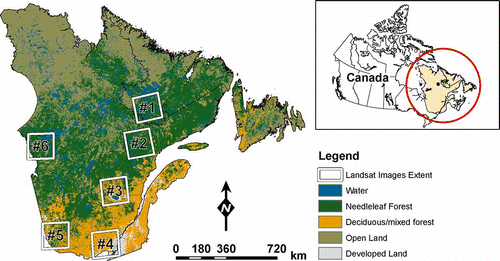
Table 1 Studied Landsat-TM scenes
Ground-based snow observations
To validate the performance of the snow detection procedure using the Landsat-TM imagery, daily ground-based observations of snow depth corresponding to image acquisition dates and located within the scenes boundaries were identified and retrieved. presents, for each scene, the count of the available ground-based snow observations. These data come from two sources: meteorological stations archives from Environment Canada (http://climate.weatheroffice.ec.gc.ca/prods_servs/index_f.html), and snow surveys from Hydro-Quebec. The survey sites correspond to snow courses over watersheds of hydroelectric interest, where snow depth and density are regularly sampled. Overall, data from only 35 meteorological stations and five snow courses were available. As seen in , only two scenes (#3 and #4) include a sufficient number of ground-based snow observations. These observations were compared to the satellite snow detection results within 3 × 3 pixel windows centred on each ground observation site. Because of the lack of available field data on certain scenes, the validation results should not be regarded as a definitive evaluation of the accuracy of the studied algorithms.
Land cover
Land cover maps corresponding to Landsat-TM scenes boundaries were used in assessing the performance of the Snowmap algorithm and its adaptation to the studied territory conditions (Quebec and Labrador). These maps allow differentiation between coniferous forests and open land. They were developed by the Canadian Forest Service from LANDSAT-ETM+ imagery (Wulder et al., Citation2003). They cover almost all of the continental territory of Canada and are available free online (http://www.saforah.org/).
RESULTS AND DISCUSSION
Mapping results
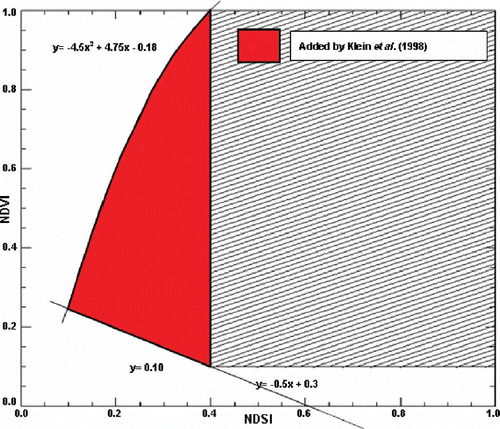
The application over Eastern Canada of the actual version of the SNOWMAP algorithm proposed by Klein et al. (Citation1998) () showed that the snow cover extent is largely underestimated. Indeed, this algorithm version does not detect either snow on areas with low vegetation cover, or ice cover on water bodies. (a) presents a zoom-in over a section of scene #2 in false colours: Band 5 in red, Band 4 in green and Band 3 in blue. This composite allows highlighting bare soil in a reddish colour since their reflectance in the mid-infrared (Band 5) is higher than snow and vegetation. Snow appears as a bluish color because it has a much higher reflectance in the red (Band 3) than soil and vegetation, and open water comes in a black due to its low reflectance in the three bands, unlike clouds which appear in white. (b) presents the snow detection results, calculated over the same section, using the actual version of the SNOWMAP. As shown in this figure, large parts of snow-covered alpine tundra and the ice on the reservoir itself were incorrectly identified by this version of SNOWMAP. In this version, Hall et al. (Citation1995) established a minimum threshold on NDVI value of 0.1, regardless of the value of NDSI, to eliminate water and ice. Unfortunately, this leads to the elimination of all the snow-covered areas with a low vegetation (e.g. at high altitude areas without vegetation or covered with a snow layer that exceeds the herbaceous vegetation). Moreover, this version ignores a very important component of the cryosphere, namely continental freshwater ice (lakes and rivers). Here, the territory under study (Quebec and Labrador) is characterized by a myriad of lakes, ponds and rivers. Consequently, the presence of ice/snow on these water bodies cannot be neglected, especially as this cryospheric component is very dynamic in time and space, and plays a very important role in climate feedback mechanisms. Therefore, we propose a modified version of SNOWMAP which does not include the minimum of 0.1 on the value of NDVI. Moreover, the lower limit of the acceptance zone (, NDVI = –0.5NDSI + 0.3), proposed by Klein et al. (Citation1998), was extrapolated to NDVI values of less than 0.1 (). Thus, the modified SNOWMAP allows, as shown in (c), the gaps to be filled in the original algorithm by correctly identifying snow over areas with low NDVI values.
Fig. 3 Zoom-in over a subsector of scene #2 (Côte-Nord): (a) Landsat image in false colours (red: Band 5, green: Band 4, blue: Band 3); (b) same as (a) plus snow-covered pixels detected by the SNOWMAP algorithm (in yellow); (c) same as (a) plus snow-covered pixels detected by the modified SNOWMAP algorithm (in yellow).

Despite the introduction of this new zone of acceptance (), detection of snow in coniferous forests is not yet satisfactory. As shown in , large forested areas appear with a bluish-green colour, indicating the presence of snow in the undergrowth. However, many pixels were still classified as no-snow-covered, because conifers do not lose their needles during winter and mask the presence of snow. This is even true for low tree densities or even in the presence of mixed stands (coniferous and broadleaf trees). As the ultimate goal of this study is to achieve a reliable spatially continuous reference dataset, it is certainly necessary to further improve the snow detection procedure.
It was therefore decided to add a spatial correction procedure to results obtained by the modified SNOWMAP algorithm, aiming at extending snow detection results from the open areas to adjacent coniferous forests and mixed stands areas. Based on the fact that the snow cover melts later in forests than in open areas, our assumption states that if an open area has been confidently identified as snow covered, it is likely that the adjacent coniferous/mixed forest should also be.
The spatial correction procedure consists in a moving window that searches for pixels corresponding to the coniferous/mixed forest which have been identified as no-snow-covered. Thereafter, window pixels belonging to classes other than coniferous/mixed forest except water are counted up and the percentage of these pixels that have been identified as snow is calculated. If this percentage is greater than or equal to 50%, the central pixel of the moving window belonging to the coniferous/mixed forest class is then declared as snow-covered. Water class has been ruled out because it often happens that the snow over land has melted while ice is still present over adjacent water bodies. It should be noted that the size of the moving window is an important issue for this procedure. It is a compromise between the representativeness of neighbourhood (the size of the window should be small enough to avoid including pixels that are not representative of the snow conditions at the central pixel), the statistical significance (the window should be of a size big enough so that the percentage of snow-covered pixels within the window belonging to other classes than coniferous/mixed forest are statistically significantFootnote 1 ) and the computation time (the window size must be small enough not to disproportionately increase the computing time). Several window sizes were tested (25 × 25, 31 × 31, 41 × 41 and 51 × 51) and the corresponding classification results were visually evaluated. A window size of 41 × 41 pixels was retained, which offered the best compromise. This size represents a search radius of about 600 m (20 pixels × 30 m) around the central pixel.
illustrates the performance of the spatial correction procedure over a subsector of scene #5. (a) shows the area displayed in false colours. The snow-covered areas are easily identifiable in bluish colour. The corresponding land cover map is shown in (b). (c) illustrates the results obtained by the original SNOWMAP in dark blue. The additional snow-covered pixels detected by the modified SNOWMAP with and without the spatial correction are shown in medium and light blue, respectively.
Fig. 5 Comparison between different versions of the SNOWMAP algorithm results: (a) Landsat-TM in false colours ((1) and (2) are numbers of polygons delimiting specific areas, see text); (b) land cover map; (c) snow mapping results.
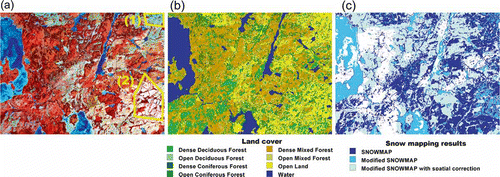
As expected, the original and modified versions of SNOWMAP performed equally in open areas by correctly identifying the presence of snow. However, the modified version, in addition to detecting ice on lakes and rivers, has succeeded in detecting the presence of snow in more open areas. These areas are marked with numbered polygons in (a): (1) corresponds to a high altitude region while (2) corresponds to recent forest cuts. They are undetectable by SNOWMAP because of their low NDVI values. As for the modified version of SNOWMAP combined to spatial correction, it was able to classify the majority of coniferous/mixed forest pixels as snow-covered, except some areas where there were no open areas or the percentage of open snow-covered areas is less than 50% within the moving window. This may represent an additional limitation to the application of the spatial correction procedure.
illustrates the results of snow/no-snow classification obtained for each Landsat-TM scene (, ). The original images are presented in false colours (red: Band 5; green: Band 4; and blue: Band 3) in column (a); the original SNOWMAP results are in column (b); and those of the modified version combined with spatial correction in column (c).
Fig. 6 Snow cover mapping over all studied Landsat-TM scenes: (a) Landsat image in false colours; (b) same as (a) plus original SNOWMAP in yellow; and (c) same as (a) plus modified SNOWMAP with spatial correction in yellow.
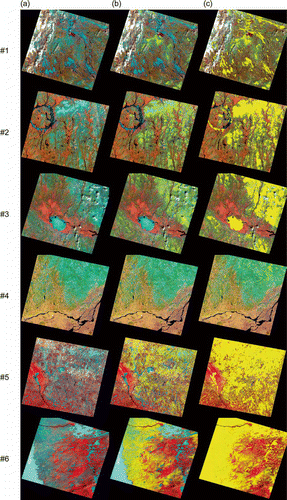
Scene #1 (53°06′N, 65°23′W) is characterized by fairly hilly terrain, a continental climate and dense coniferous forests. The elevation of the region varies between 120 and 930 m. Although the left side of the image is somewhat cloudy, it is possible to notice that the snow has already melted. Apart from the many lakes still frozen on that date (28 May 1990), the only snow-covered area is the centre of the image. In this case, the application of the modified SNOWMAP does not add much information on snow cover to the original one. After the spatial correction, snow-covered areas in the centre of the image are slightly wider. The areas without snow rather correspond to the valley bottoms. It is also noteworthy that the spatial correction procedure is based on the presence of open areas to deduct snow presence under the coniferous forest. However, in this region, they are not very prevalent. In this case, the correction is not very effective.
Scene #2 (51°04′N, 67°50′W) is located in a region under maritime influence. It is a fairly hilly region. The upper part of the scene is occupied by the Manicouagan reservoir and the eastern part by the Groulx Mountains which are covered with snow almost all year. The main peaks reach more than 1000 m a.s.l. (Mont Veyrier at 1104 m and Mount Lucia at 1095 m). There was still snow on the Groulx Mountains on 22 May 1991, and the modified SNOWMAP algorithm, unlike the original version, has successfully detected it. The modified version combined with the spatial correction produce a homogeneous and continues snow cover map. It should also be noted that certain sections of the Manicouagan Reservoir are still frozen, unlike rivers and most lakes.
Scene #3 (48°51′N, 71°46′W) is also a mountainous region: the altitude varies between 0 and 1120 m. The image centre is occupied by the valley of Lake St-Jean and the Saguenay River, which constitutes the outlet of the lake, and flows eastwards and runs into St Lawrence River. Many rivers also flow into the lake: their snow-free valleys are visible on the image. The region is characterized by hardwood and mixed forests in the lowlands and coniferous forests at altitude. The detection algorithm allowed the spatial distribution of snow cover to be captured. This is consistent with the terrain characteristics and the acquisition date (21 April 1998): a continuous snow cover at altitude (northeast sector of the image) and snow-free valleys and lowlands, as well as detecting the ice still covering St-Jean Lake on that date.
Scene #4 (46°01′N, 74°25′W) is the southernmost studied scene. The southern part of the image is the region of the St Lawrence River lowlands around the Montreal metropolitan area (southeast). However, the upper part of the scene is occupied by the Laurentian Mountains (the highest peak on this image stands at 1180 m a.s.l.). The Laurentian Mountains are mainly covered by hardwood forests, while the lowlands are occupied by agricultural and urban areas. On 28 April 1998, the acquisition date, the snow cover has almost melted everywhere, except at altitude, where the ice was still present in some lakes. This was correctly captured by the modified SNOWMAP.
Scene #5 (47°27′N, 78°35′W), located in the boreal forest, is a region dominated by “conifers” (mixed forest and coniferous forests). The forestry activity there is very developed and clear cuttings are frequent, resulting in the presence of many open forest areas. The terrain is rugged. There is approximately 450 m difference between the highest and the lowest point. On 4 April 1999 the snow cover is still widely present in the territory, except for the lowlands around the lake located on the west side of the image. The snow cover spatial distribution produced by the original version of SNOWMAP displays a fragmented aspect which does not correspond to the reality of snow conditions. This algorithm also failed to detect the snow in open areas with low NDVI values (recent clear cuttings) or coniferous dominated forest. However, the results of the modified version were consistent with snow cover conditions (visible on the Landsat image) as well as with the territory topography.
Scene #6 (53°05′N, 77°41′W) is the most northerly. The region is under maritime influence from James Bay. It is relatively flat (around 400 m of elevation difference) and mostly covered with sparse coniferous forests (mainly spruce). It features a lot of peat lands (wetlands). The upper part of the scene is occupied by the LG-2 Reservoir of the hydropower complex located on the La Grande River. The image was acquired on 28 April 1988. The James Bay and the majority of lakes and reservoirs in the region were still frozen. However, snow free areas in the centre-east and south sectors of the scene correspond to open land areas. Indeed, in the spring, the snow melts first in open land, more exposed to sun radiation. The original version of SNOWMAP, unlike the modified one, does not detect all the snow and ice over areas with low NDVI values (peat lands, lakes and reservoirs).
Comparison with snow observations
As mentioned earlier, due to the non optimal spatial distribution and density of the observation network, it is very difficult to find enough historical ground-based observations which can be used to evaluate snow mapping results. This is especially true for northern scenes. Even for southern scenes which are located in populated areas and where the network is relatively dense, reference ground-based observations were problematic. Indeed, most of observation sites are located in lowlands and/or around urban and agriculture areas, limiting consequently the possibility to validate results in forested and/or high altitude areas. Thus, only 45 ground observations were available for all scenes (). However, up to 69% of the locations correspond to the two southernmost scenes: Saguenay (#3) and Montréal (#4) and up to 49% are located within only one scene (#4).
presents the comparison between the two versions of SNOWMAP algorithm results over the six scenes and the corresponding ground-based reference data. Firstly, it should be noticed that only five observations out of 40 corresponded to snow presence, all others were snow-free. Both original and modified SNOWMAP performed very well in detecting snow-free conditions: 33 out of 35 (up to 82%) of snow-free observations were correctly detected. As for snow conditions, it was difficult to make a definitive conclusion since the snow observations sample was small and therefore very under-represented in the validation data set. However, the modified SNOWMAP seems to perform better than the original one in detecting the snow presence since it succeeded to correctly identify three observations out of five against none for the original version. The two misclassified sites belong to the scenes located in dense coniferous forest which could explain the failure of the algorithm to correctly identify them. Moreover, one of the misclassified sites which belongs to the Churchill-Falls (#1) was under shallow snow conditions.
Table 2 Ground-based validation of the SNOWMAP algorithm
Application case
The application case illustrates how the results of the snow mapping at high spatial resolution using the modified SNOWMAP algorithm could be used as reference data for assessing the quality of regional snow mapping produced by Chokmani et al. (Citation2006b) using NOAA-AVHRR and DSMP-SSSM/I data. The example shown in is Scene #2. From visual examination of the two snow maps: regional () and local (), it is possible to conclude that snow mapping on a regional scale reproduced quite well the spatial distribution of snow cover, at least in the areas where the snow is continuous. In contrast, the areas of patchy and isolated snow cover were not correctly identified by the regional mapping algorithm. Depending on the percentage of snow cover in the neighbourhood, these areas were classified as either continuous snow cover or outright without snow.
Fig. 7 The modified SNOWMAP results as reference data for the validation of regional snow mapping: (a) regional snow map produced using medium spatial resolution sensors (1 km × 1 km); (b) local snow map produced by the modified SNOWMAP; (c) compilation of regional mapping results according to the snow coverage at the sub-pixel level given by SNOWMAP.
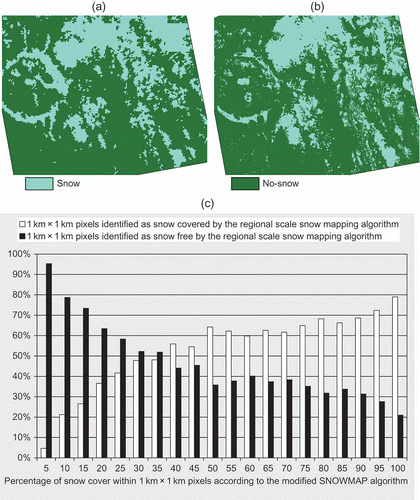
Given their nominal 1 km × 1 km spatial resolution, it was thus possible to calculate the percentage of the snow cover at the sub-pixel level of regional mapping since each pixel of the regional map covers nearly 1100 pixels of the local map produced with SNOWMAP (30 m × 30 m). The results are reported in (c), depending on whether the pixel has been identified as snow-covered or not by regional mapping. According to this figure, the 1 km × 1 km pixels with sub-pixel snow coverage higher than 35% are mostly identified as snow. Below that threshold, the pixels are mainly identified as snow-free. Moreover, the regional mapping algorithm seems to be more efficient to detect the absence of snow since the portion of pixels with coverage below 35%, which have been wrongly classified by the regional algorithm, is lower than for those with coverage beyond that threshold.
CONCLUSIONS
The objectives of this study were to apply and adapt the snow mapping Snowmap algorithm to Landsat-TM data and the context of the eastern Canada territory (Quebec and Labrador). The Snowmap algorithm was retained because of its simplicity and transparency. Six Landsat-5 TM scenes were used. The images were acquired during the critical snow melting period. Scene locations were selected to take climatic and landscape gradients characterizing the territory under study into account.
The application of the original version of the SNOWMAP algorithm demonstrated that it largely underestimates the snow cover extent, and this not only under dense forest cover, as expected, but also in open areas with low vegetation cover corresponding to NDVI values less than 0.1. Also, this version does not detect ice over freshwater bodies and hence underestimates a large part of the continental cryosphere. Therefore, we have proposed a modified version of the SNOWMAP algorithm which does not include the minimum NDVI value of 0.1. This modification allows these omissions to be cancelled. However, snow detection in coniferous forests is not sufficient. Consequently, a spatial correction procedure is applied on the modified SNOWMAP results obtained by extending snow detection results from the open areas to adjacent coniferous-dominated forests. The quality of the results relies on the accuracy of the land cover maps used. Such a procedure causes a loss of speed of the algorithm: the use of a moving window is time consuming in terms of computing. Moreover, the size of the window must be empirically adapted to the landscape and topography of the territory. Thus, the modified version of SNOWMAP combined with the spatial correction, is able to correctly identify the majority of snow-covered areas under coniferous/mixed forests.
Limited ground-based observation data of snow depth corresponding to image acquisition were used to validate the performance of the snow detection procedures using Landsat-TM imagery. Both original and modified SNOWMAP performed very well in detecting snow-free conditions (up to 82% of snow-free observations). However, due to the lack of information, it was difficult to make a definitive conclusion about their capacity to detect the presence of snow, but the modified SNOWMAP seemed to perform better than the original since it successfully identified three observations out of five against none for the original version.
In conclusion, based on the visual assessment and partially on the quantitative analysis, the six snow maps produced using the adapted SNOWMAP with Landsat-TM imagery can be considered as acceptable reference. The application case presented shows the pertinence of using these mapping results as surface-based reference to validate historical snow mapping at the regional scale using coarser spatial resolution satellite data.
Acknowledgements
The authors would like to acknowledge the funding from the Natural Sciences and Engineering Research Council of Canada (NSERC) and from the OURANOS Consortium.
Notes
1According to the sample size calculation approach proposed by Congalton & Green (Citation1999), a minimal size of 600 pixels is necessary in order to obtain, at a level of significance of 95%, 50% of the window in the class “snow-covered surface other than coniferous/mixed forest”.
REFERENCES
- Caya , D. and Laprise , R. 1999 . A semi-implicit semi-lagrangian regional climate model: The Canadian RCM . Monthly Weather Rev. , 127 ( 3 ) : 341 – 362 .
- Chokmani , K. , Bernier , M. and Slivitzky , M. 2005 . Validation of a method for snow cover extent monitoring over Quebec (Canada) using NOAA-AVHRR data . EARSeL eProceedings , 4 ( 1 ) : 106 – 118 .
- Chokmani , K. , Bernier , M. and Gauthier , Y. 2006a . Suivi spatio-temporel du couvert nival du Québec à l'aide des données NOAA-AVHRR . Rev. Sci. Eau , 19 ( 3 ) : 163 – 179 .
- Chokmani , K. , Bernier , M. , Pâquet , L. M. , Dever , K. , Gauthier , Y. and Royer , A. July 2006b . “ Snow mapping over eastern Canada for climate change studies purpose using historical NOAA-AVHRR and SSM/I data ” . In IEEE Geoscience and Remote Sensing Symposium , July , 747 – 750 . Denver, Colorado, , USA : IGARSS 2006 . 2006
- Cihlar , J. and Beaubien , J. 1995 . “ Canada Centre for Remote Sensing, Natural Resources Canada ” . In Land Cover of Canada 1995 Version 1.1 , Northern Biosphere Observation and Modeling Experiment (NBIOME) .
- Congalton , R. G. and Green , K. 1999 . Assessing the Accuracy of Remotely Sensed Data: Principles and Practices , Florida, , USA : Lewis Publishers, Boca Raton .
- Dozier , J. 1989 . Spectral Signature of Alpine Snow Cover from the Landsat Thematic Mapper . Remote Sens. Environ. , 82 : 9 – 22 .
- Hall , D. K. , Rhoads , J. D. and Salomonson , V. V. 1995 . Development of methods for mapping global snow cover using Moderate Resolution Imaging Spectroradiometer data . Remote Sens. Environ. , 54 : 127 – 140 .
- Hall, D. K., Riggs, G. A. & Salomonson, V. V. (2001) Algorithm Theoretical Basis Document (ATBD) for the MODIS Snow and Sea Ice-Mapping Algorithms http://modis-snow-ice.gsfc.nasa.gov/atbd.html
- Hall , D. K. , Riggs , G. A. , Salomonson , V. V. , DiGirolamo , N. E. and Bayr , K. J. 2002 . MODIS snow-cover products . Remote Sens. Environ. , 83 : 181 – 194 .
- Klein , A. G. , Hall , D. K. and Riggs , G. A. 4–8 August 1997 . “ Improving the MODIS global snow-mapping algorithm ” . In IEEE Geoscience and Remote Sensing Symposium , 4–8 August , 619 – 621 . Singapore : , IGARSS'97 . 1997
- Klein , A. G. , Hall , D. K. and Riggs , G. A. 1998 . Improving snow cover mapping in forests through the use of a canopy reflectance model . Hydrol. Processes , 12 : 1723 – 1744 .
- Langlois , A. 2003 . Etude de la variation spatio-temporelle du couvert nival par télédétection micro-ondes passives et validation du Modèle Régional Canadien du Climat (MRCC) , Canada : MSc thesis Université de Sherbrooke, Sherbrooke .
- Langlois , A. , Royer , A. , Fillol , E. , Frigon , A. and Laprise , R. 2004 . Evaluation of the snow cover variation in the Canadian regional climate model over eastern Canada using passive microwave satellite data . Hydrol. Processes , 18 : 1127 – 1138 .
- Riggs , G. and Hall , D. K. Snow mapping with the MODIS Aqua Instrument . 61st Eastern Snow Conference . Portland, Maine, USA. pp. 81 – 84 .
- Rosenthal , W. and Dozier , J. 1996 . Automated mapping of montane snow cover at subpixel resolution from the Landsat Thematic Mapper . Water Resour. Res. , 32 ( 1 ) : 115 – 130 .
- Shimamura , Y. , Izumi , T. and Matsuyama , H. 2006 . Evaluation of a useful method to identifiy snow-covered areas under vegetation – comparisons among a newly proposed snow index, normalized difference snow index, and visible reflectance . Int. J. Remote Sens. , 27 ( 21 ) : 4867 – 4884 .
- Vikhamar , D. and Solberg , R. 2002 . Subpixel mapping of snow cover in forests by optical remote sensing . Remote Sens. Environ. , 84 : 69 – 82 .
- Wulder , M. A. , Dechka , J. A. , Gillis , M. A. , Luther , J. E. , Hall , R. J. , Beaudoin , A. and Franklin , S. E. 2003 . Operational mapping of the land cover of the forested area of Canada with Landsat data: EOSD land cover program . For. Chron. , 79 ( 6 ) : 1075 – 1083 .
