Abstract
The hydrological regime of a river is defined by variables or representative curves that in turn have characteristics related to fluctuations in flow rates resulting from climate variability. Distinguishing between the causes of streamflow variations, i.e. those resulting from human intervention in the watershed and those due to climate variability, is not trivial. To discriminate the alterations resulting from climate variation from those due to regulation by dams, a reference hydrological regime was established using the classification of events based on mean annual streamflow anomalies and inferred climatic conditions. The applicability of this approach was demonstrated by analysis of the streamflow duration curves. An assessment of the hydrological regime in the lower reaches of the São Francisco River, Brazil, after the implementation of hydropower plants showed that the operation of the dams has been responsible for 59% of the hydrological changes, while the climate (in driest conditions) has contributed to 41% of the total changes.
Editor Z.W. Kundzewicz
Citation Genz, F. and Luz, L.D., 2012. Distinguishing the effects of climate on discharge in a tropical river highly impacted by large dams. Hydrological Sciences Journal, 57 (5), 1020–1034.
Résumé
Le régime hydrologique d'une rivière est défini par des variables ou des courbes représentatives qui à leur tour ont des caractéristiques liées aux fluctuations des débits résultant de la variabilité du climat. La distinction entre les causes des variations de débits, c'est à dire celles qui résultent de l'intervention humaine dans le bassin versant, et celles dues à la variabilité climatique, n'est pas simple. Pour déterminer les modifications résultant de la variation du climat et celles qui sont dues à la régulation par les barrages, un régime de référence hydrologique a été établi en utilisant la classification des événements basés sur la moyenne des anomalies de débits annuels et les conditions climatiques associées. L'applicabilité de cette approche a été démontrée par l'analyse des débits classés. Une évaluation du régime hydrologique dans les cours inférieurs du fleuve São Francisco, au Brésil, après la mise en œuvre de centrales hydroélectriques, a montré que le fonctionnement des barrages a été responsable de 59% du changement de régime hydrologique, tandis que le climat (en conditions les plus sèches) a contribué pour 41% à la variation.
INTRODUCTION
Accurate quantification of hydrological parameters is a basic requirement for reliable assessments, evaluations, projects, planning and management. On the one hand, the availability of hydrological series for the locations of interest, or the reliability of transferring information from another site is the primary concern. On the other hand, the level of uncertainty in the data must be as low as possible to confer confidence to the outcomes. Such uncertainties may derive from data quality, series length, or even from mixed sources of variability, and are certainly a matter of concern.
Hydrological impact assessments, for instance, mostly require the accurate prediction or identification of changes caused by a certain action or intervention and are usually conducted as comparisons between conditions before and after an event related to a causal factor has taken place. The initiation of such a causal factor may occur at a point in time (e.g. stream water diversion, damming), or it may evolve continuously (e.g. modification of catchment land use). In these cases, the focus is on the consequences of the interventions, and the variations in the hydrological series caused by normal climatic variability are not of primary interest. Thus, intervention effects should be assessed separately from, or free of, the climatic effects to gain a better understanding of their impacts.
In contrast, identifying the hydrological characteristics that should be considered, for example, for the prescription of an environmental flow regime, requires a different focus. Understanding hydrological characteristics under different climatic conditions, e.g. wet and dry years, is of importance for rational management, and such characteristics should not be confused with the consequences of artificial interventions that could modify streamflow. This concern has its foundations in the Natural Flow Paradigm (Poff et al. Citation1997). Despite the necessary parsimony that has been expressed in the literature with respect to the appropriateness of such a concept (Ward et al. Citation2002), several studies have supported the importance of natural flow regimes in maintaining the good condition of rivers, flood plains and estuaries (Arthington et al. Citation1992, Sparks Citation1995, Walker et al. Citation1995, Bunn and Arthington Citation2002, Baron et al. Citation2003, Poff et al. Citation2007). Natural, or even pre-impact, characteristics should guide experts in defining and assessing which aspects of the fluvial regime may be of essential ecological importance. Limitations in implementing such environmental flow characteristics due to irreversible human interventions should then be analysed.
The characterization of the hydrological regime of a river usually consists of certain variables, indices or representative curves. The representative variables commonly utilized include: (a) the long-term average flow, (b) the annual average of maximum flows, (c) the annual average of minimum flows, and (d) flows associated with a percentile or a probability. In the case of representative curves, the following are usually considered: (i) the seasonality of monthly average streamflows, (ii) the flow duration curve, and (iii) probability curves.
Estimates of the variables or curves are representative of a sample of data and are therefore tied to available time series of flows. In turn, these time series show fluctuations in flow rates due to climate variability. Indeed, wet years have flow characteristics that are different from those of years with low precipitation.
Mauget (Citation2003) noted that intra-annual to multi-decadal climate variation could influence the simple definition of climate. That is, whereas climate normals are typically calculated over 30-year periods, the dominance of one particular mode of intra- to multi-decadal variability during these periods can produce biased statistics. For instance, Mauget (Citation2003) shows that the abnormally wet conditions in the USA during the last 30 years of the 20th century produced 1971–2000 normals that were wetter in comparison to the climate of the 20th century as a whole.
A special behaviour of hydrological and other geophysical time series has become known as the “Hurst phenomenon”. This is the tendency of wet years to cluster into wet periods, or of dry years to cluster into dry periods (Koutsoyiannis Citation2002), resulting in natural multi-decadal variability.
Recently, Milly et al. (Citation2008) questioned the traditional assumption that hydrological series are stationary. According to these authors, the stationarity assumption has long been compromised by human disturbances in river basins. Flood risk, water supply and water quality are affected by water infrastructure, channel modifications, drainage works and changes in land cover and land use. Two other (sometimes indistinguishable) challenges to stationarity have been externally forced: natural climate changes and low-frequency internal variability (e.g. the Atlantic multi-decadal oscillation), which is enhanced by the slow dynamics of the oceans and ice sheets.
As reported by Paturel et al. (Citation2003), the rainfall deficit (15–20% on average) and the river-flow deficit (about 30–50% and sometimes more) observed over the past 30 years in West and Central Africa raise the question of which reference period to consider in estimates of hydrological characteristics. The effects of taking or not taking into account the data of recent years in producing estimates of the normals can lead to very different results, which would have serious consequences for the development and management of water resource systems.
When analysing hydrological changes, whether due to climate change or due to human action (e.g. changes in land use and damming), if there is no criterion, climate variability acting on the generation of flows will interfere with the evaluation results. Richter et al. (Citation1997) emphasized that climatic differences between the pre- and post-dam-impact periods obviously have the potential to substantially influence the outcome of the Indicators of Hydrologic Alteration Method analysis.
In the case of the construction of large dams in Brazil, for example, most of which were built prior to the 1980s (Brazilian Committee on Dams Citation2000), some downstream effects are only now being noticed. In the Brazilian northeast, the 1990s was one of the driest decades of the last century and its direct comparison with previous periods can lead to an overestimation of changes resulting from the large dams. In addition, the use of time series from different periods can result in discrepant representative flows, especially for the rivers of the semi-arid region, where annual flows have shown high values of standard deviation.
The assessment of hydrological changes resulting from human intervention in the catchment area must be referenced by a natural or pre-impact hydrological regime, which will be used to define periods and reference data. Historical flow data are most commonly found in the form of (Richter et al. 1997): (a) an extensive series of flow data (>20 years) adequate to represent the natural conditions; (b) a shorter series of data during the period of interest (<20 years) requiring extension; or (c) an absence of data observed during the period of interest, therefore creating a need to generate data by information transfer or hydrological modelling.
Kennard et al. (Citation2010) argued that the estimation of hydrological metrics, based on at least 15 years of the discharge record, is suitable for use in hydrological analyses aiming to detect important spatial variation in hydrological characteristics. Some studies call for longer series, such as Chen and Grasby (Citation2009), who argued that, based on the predominance of 45–60-year climate cycles observed in instrumental records, trend analyses of time series less than 60 years should be treated with caution. Additionally, the consideration of autocorrelated data should increase confidence. For instance, Hamed and Rao (Citation1998) proposed a modified trend test that is robust in the presence of autocorrelation in the data.
In addition to the concern over having an available time series with little or no influence from human intervention, we must consider the spatial availability of information, because there may be no data for the affected river reach prior to the intervention. Upstream gauging stations can be very useful in this case and can identify whether the data have compatible hydrological characteristics in the pre- and post-intervention periods, i.e. whether there are different characteristics in flows that result from climate variability. Upstream information was used by Smakhtin (Citation1999), who proposed the use of a flow duration curve as a key “transfer function” to derive natural streamflows for sites without data, or affected by dams.
Collischonn et al. (Citation2001) described a change in the patterns of stages in the Paraguay River (La Plata basin) due to changes in precipitation. The flow regime during the period 1960–1970 differed substantially from the flow regimes both before and after this period. The long record of water levels at the Ladario gauging station suggested that the changes between one period and the next were considerably abrupt and that the periods differed, not only in terms of mean water levels, but also in terms of year-to-year correlational structure within the records.
Gibson et al. (Citation2006) studied the variability in the water levels of Great Slave Lake, Canada, to distinguish climatic effects from those resulting from regulation by dams. For this purpose, the authors used a series of naturalized flows obtained with hydrological simulation models. Climatic and regulation impacts appear to have generally counter-balanced changes in the amplitude of water-level changes and magnitude of peak levels, but have contributed to a seasonal shift toward earlier peak water levels in the lake.
The São Francisco River (SFR), the fourth-largest river basin in Brazil, is a strongly regulated river. For the main channel, fragmentation is ranked in Class 2 (50.74%) and flow regulation is at least 37% (Nilsson et al. Citation2005). Additionally, after the implementation of the last major dam in the 1990s, there were consecutive years of significantly below-average discharges, as presented in this work, that resulted in dramatic hydrological alterations.
To analyse the hydrological regime in the lower reach of the SFR and distinguish the alterations resulting from climate variation from those derived from human intervention in the watershed, with an emphasis on large dams, the study presented in this paper proposes to establish a reference hydrological regime by analysing the time series. Such treatment uses the classification of events based on mean annual streamflow anomalies and the inferred climatic conditions of the basin. The results show that climate has important effects on the recent hydrological alterations of the SFR's lower reach, even though it has already been impacted on by the operation of large dams.
STUDY AREA AND DATA
The São Francisco River (SFR) basin has an area of 634 000 km2 and is located between latitudes 7° and 21°S. Its headwaters rise in the Serra da Canastra Mountains (in Minas Gerais State), along which the river runs 2800 km to its mouth in the Atlantic Ocean, from an altitude of 1600 m a.s.l. The SFR basin area has 13 million inhabitants distributed among 464 municipalities.
The SFR basin is usually divided into four segments: the Upper (100 060 km2—16%), Central (398 716 km2—63%), Sub-Central (110 481 km2—17%) and Lower (25 524 km2—4%) river reaches (Agência Nacional de Águas Citation2004), as shown in The basin encompasses diverse climate conditions, comprising: annual average rainfall from 400 mm (Sub-central region) to 1500 mm (Upper region); annual average air temperatures of 18–27°C; relatively high evaporation rates of 2300–3000 mm/year; 2400–3300 h of light per year; ecological domains ranging from Atlantic forest to savanna (Cerrado) and shrubs (Caatinga); and climates varying from humid tropical to semi-arid (Sato and Godinho Citation2004).
Fig. 1 São Francisco River Basin: river reaches and the locations of large dams and gauging stations of interest.
The river has 36 tributaries, of which only 19 are perennial. The main perennial tributaries are located in the Upper river reach and in the west (left) margin of the Central reach. In the opposite margin of the Central reach, as well as in the Sub-Central and Lower sections, the rivers are seasonal (Sato and Godinho Citation2004).
The SFR has important hydropower plants (HPP) all along its main course. In its Sub-central reach, the power plants installed by the Hydroelectric Company of São Francisco (CHESF) comprise the largest hydropower complex in Brazil (total power: 10 618 MW; accumulation volume of 50 × 109 m3). There is another large HPP located in the Upper SFR: Três Marias (15 × 109 m3), which is operated by the Companhia Energética de Minas Gerais (CEMIG) (, ).
Table 1 Major reservoirs in the São Francisco River
The mean discharges of the SFR increase from the headwaters to the mouth. This can be observed from the naturalized streamflow series (1931–2001) reconstituted by Agência Nacional de Águas (Citation2004, p. 17) for three locations (see ): 686 m3 s-1 at Três Marias; 2708 m3 s-1 at Sobradinho; and 2812 m3 s-1 at Xingó. However, the opposite occurs with the streamflow per unit area. Based on data for the 1950–1999 period, Pruski et al. (2004) showed that the streamflow per unit area varied from 14 to 28 L s-1 km-2 in the Upper reach of the SFR basin, from 10 to 14 L s-1 km-2 in the southern part of the left Central reach, and from 4 to 10 L s-1 km-2 in its northern part, as well as in the Sub-central and Lower reaches. Notice that the limits of the ranges adopted by the authors to characterize streamflow per unit area regionally do not allow one to identify the very low runoff (and therefore also streamflow per unit area) expected in the semi-arid basin increments between Sobradinho HPP and Traipu gauging station.
A series of inflows to the Sobradinho Reservoir (main power plant system), was used in this study to characterize the hydrological behaviour of the SFR. The series consists of the sum of streamflows of the Morpará (SFR) and Boqueirão (Grande River) gauging stations, covering the period from 1934 to 2006. The data (1939–2006) of Traipu gauging station, which is located downstream of the CHESF hydropower system in the Lower reach, were used to determine the alterations to the hydrological regime resulting from climate variation and regulation by dams. The records of the gauging stations are shown in , and shows their locations.
Table 2 Gauging station records
The average annual inflows to the Sobradinho Reservoir (upstream of the HPP system), the streamflows released by Xingó Reservoir (downstream of the HPP system), and the timing of installation of the CHESF HPPs in the SFR are shown in
Fig. 2 Average annual flows upstream of the Sobradinho HPP (Morpará + Boqueirão streamflows) and downstream of the Xingó HPP (at Traipu station) and timing of deployment of HPPs.
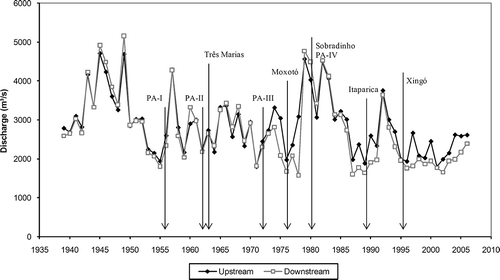
Historical data from the gauging stations considered in this study (Morpará, Boqueirão and Traipu; ) confirm that the basin increment between the inlet of the Sobradinho Reservoir and the Traipu gauging station provides a very small contribution to the mean annual streamflow of the SFR. The mean annual inflow to Sobradinho Reservoir, composed by adding together the flows of Morpará and Boqueirão gauging stations, prior to the deployment of the largest reservoirs (1939–1975), equals 2987 m3 s-1 and corresponds to 99% of the discharge at Traipu (Lower reach). This can be explained by the low precipitation in the Sub-central region (as mentioned before), as well as the fact that rainfall events are short in duration, which results in a weak influence on the values of average annual discharges. In addition, the tributaries of the left bank of the SFR have dozens of small (Carvalho et al. Citation2009), and a few large, reservoirs that retain part of the runoff during the rainy season, therefore reducing the incremental discharge.
Referring to the dams upstream of the Sub-central region, the Três Marias Reservoir has the capacity to release a regulated discharge of 513 m3 s-1, while the Sobradinho Reservoir can regulate 1815 m3 s-1 to be released to that region. The effects of the SFR dam complex on the hydrological regime include losses by evaporation, diversions for multiple uses and the capacity of regulation. Therefore, an important element in understanding the hydrological alterations in the Sub-central and Lower reaches of SFR is the size of the surface of the Sobradinho Reservoir, which is one of the largest in the world (4214 km2 at its normal stage). The mean net evaporation from this reservoir during the period 1979–2000 was estimated to be 132 m3 s-1. The mean difference between inflows and outflows was 163 m3 s-1, which comprises net evaporation loss and consumptive uses (Pereira et al. Citation2009).
According to Agência Nacional de Águas (Citation2004), the discharge diverted in the Sub-central region in 2001 for urban, irrigation, cattle and industrial water supplies was estimated as 41.6 m3 s-1, 96% of which was consumed by irrigation. Downstream of the Sobradinho Dam, there are several irrigation districts that were developed from the beginning of the 1960s. Such districts total 65 709 ha in operation and 39 167 ha that are being implemented.
METHODOLOGY
The variation of stream discharge is due to the interaction of various physical factors, but it mainly results from precipitation. The variation of rainfall is subject to phenomena at scales ranging from regional to global. The frequency of fluctuations in rainfall and streamflow occur in time spans ranging from seasons to decades. Although studies of climate variability have relied, in general, on precipitation, the use of streamflow is justified for the following reasons according to Pekárová et al. (Citation2003):
| a. | Changes in precipitation will become more evident in the flow due to the nonlinearity of the basin response. | ||||
| b. | The water balance in catchments depends not only on precipitation, but also on temperature, solar radiation and evapotranspiration. | ||||
| c. | Measuring flows at the exit of the catchment is simpler and more accurate than determining the average rainfall over the area. | ||||
| d. | The analysis of long-term oscillations in large rivers eliminates variations in precipitation and temperature due to local orographic processes. | ||||
In spite of the convenience of using streamflow instead of rainfall data, according to Pekárová et al. (Citation2003), it is important to be careful about the quality of the available time series. Estimates of streamflow data may contain errors due to several factors, such as: imprecision of the current meter, variability of the river flow velocity over the cross-section, the exposure time of the current meter, the number of sampling points where velocity is measured, uncertainty in the estimation of the cross-section geometry, and imperfect estimation of the rating curve (Sauer and Meyer Citation1992, Di Baldassarre and Montanari Citation2009).
However, it remains to be investigated whether intervention in a basin, such as the construction of dams, may lead to significant changes in the streamflow patterns. To determine the contribution of climate variability in the flow regime of a river reach under the influence of large dams, a reference regime, based on the classification of annual streamflow events without the influence of dams, was first sought. By having a reference flow regime, the influence of dams and climate may be determined.
Obtaining streamflow time series by hydrological modelling is an attractive and flexible approach, although information-consuming, that requires thorough calibration and is commonly time- and labour-intensive (Smakhtin Citation1999). The availability of streamflow records in the SFR, both upstream and downstream of the dam system, and before and after the dam implementation periods, enabled a simple and straightforward way of carrying out SFR analyses.
Hydrological condition of the basin (HyC)
The hydrological condition (HyC) of the basin was assumed as a primary criterion for distinguishing data. The classification of annual streamflow events based on their variation was adopted to characterize the hydrological variability. Thus, the HyC was inferred, distinguishing between dry, average and wet years.
The reference value for the annual hydrological condition was the mean annual flow (Qm), while the variations were evaluated by the standard deviation (σ) of the annual average streamflow values. The value of one standard deviation was adopted to set the limits for the different classes of HyC. Thus, the method defines the variability of annual streamflow around the Qm by normalizing the series, which is called an “anomaly” in climatology. The anomaly for the streamflow is defined as follows:
where Q i is the annual average streamflow (m3 s-1) in year i, Qm is the mean annual streamflow (m3 s-1) and σ is the standard deviation (m3 s-1).
Once the anomalies were defined and 1σ was adopted to establish the limits, a rank of classes of HyC of the basin was established, as shown in .
Table 3 Classification of HyC based on the anomaly of annual average streamflow and 1σ
The use of standard deviation to establish the limits of analysis has been adopted in other procedures, such as the range of variability approach (RVA) (Richter et al. 1997) and the standardized precipitation index (SPI) (McKee et al. Citation1993). The RVA uses the mean ±1σ as the default to set the limits in the range of variation, or, alternatively, the median and the 25th and 75th percentiles. These limits of variation were established only with the purpose of accepting or rejecting an event, while the HyC method was proposed to classify annual events, similar to the SPI method.
The use of the anomaly is an important feature when it is necessary to compare data from other gauging stations or even other types of variables (e.g. precipitation).
Obtaining the reference curve by classes
The use of Qm as a reference for the classification of annual events, and the adoption of strict limits on the division of classes, require assessment of events that lie on the borderline between two classes. This outcome is expected, because maximum flows very often may have characteristics of the upper HyC class. For instance, an event of great magnitude but short duration would not greatly influence the annual average streamflow in a given year.
After assessing the classes, the natural or reference streamflow regime of the different hydrological conditions was characterized by the flow duration curve (FDC). The FDC represents the relationship between the magnitude and frequency of streamflow discharges (Smakhtin Citation2001), and is one of the most informative methods for displaying the complete range of river discharges, from low flows to floods.
The FDCs were used in this study as reference curves for the analyses because of their capacity to characterize the whole range of streamflow variation. They were also used because FDCs expose distinct HyC effects and dam regulation impacts across different ranges of frequencies.
Strategy for FDC comparison
The period-of-record FDC represents the variability and exceedence probability of flow over the available (or selected) period (Smakhtin Citation2001). Vogel and Fennessey (Citation1994) suggested a different interpretation of FDCs that considers FDCs for individual years and treats those annual FDCs similarly to a sequence of annual flow maxima or minima. This interpretation allows mean and median FDCs to be estimated. Such curves were demonstrated to be less sensitive to the length of the record period, especially in the area of low flows.
The HyC method presented in this paper relies on daily data of the years classified in each class with the aim of defining the FDC of that class. By separating events by class, the shorter the data series, the fewer events there are in each class. Therefore, one would expect that the FDC of a certain class might limit its use as a reference curve. To evaluate the ability of the method to obtain a reference curve of different HyC classes from shorter streamflow series, the full range of daily streamflows (1934–2006, 73 years), P1, was divided into three subsets: P2 (1963–2006, 44 years); P3 (1979–2006, 28 years); and P4 (1995–2006, 12 years). The years 1963, 1979 and 1995 mark the implementation of the hydropower plants (HPPs) at Três Marias, Sobradinho and Xingó, respectively.
The classification of the subsets of events should be based on the mean and standard deviation of annual streamflows of the whole set to avoid considering flow characteristics over shorter periods that may predominate in a class (several dry years, for example). Thus, the reference parameters of the analysis were specified. The curves representing the SFR hydrological regimes obtained with the HyC method for the entire upstream Sobradinho HPP data set, P1 (1934–2006) were used as a reference for comparison with the other periods (P2–P4).
For comparison purposes, the curves were chosen without using average curves, such as those proposed by Vogel and Fennessey (Citation1994), because we are interested in the possible differences that may arise in the analysis of the effects of climate variability or reservoirs on the hydrological regime of interest.
RESULTS
Applying the HyC method
The HyC method departs from the definition of the anomaly for each year of the data series upstream of the Sobradinho HPP. For the São Francisco River (Morpará and Boqueirão gauging stations), Qm was 2856 m3 s-1, with σ = 728 m3 s-1 and these values were used for the classification of the events. shows the anomaly time series of streamflow values in the SFR. Classification of the annual events by the HyC method resulted in the following groupings:
Fig. 3 Anomaly time series of annual average flow upstream of the Sobradinho HPP (Morpará and Boqueirão stations).
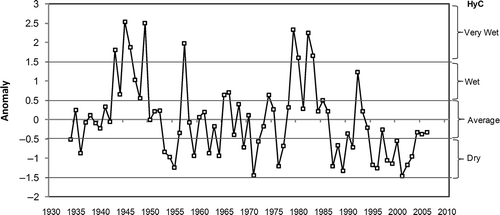
| Very dry: | = |
none; |
| Dry: | = |
25 events (1934, 1936, 1953, 1954, 1955, 1959, 1962, 1964, 1969, 1971, 1972, 1976, 1977, 1987, 1988, 1989, 1991, 1995, 1996, 1998, 1999, 2000, 2001, 2002 and 2003); |
| Average: | = |
32 events (1935, 1937, 1938, 1939, 1940, 1941, 1942, 1950, 1951, 1952, 1956, 1958, 1960, 1961, 1963, 1967, 1968, 1970, 1973, 1975, 1978, 1981, 1984, 1985, 1986, 1990, 1993, 1994, 1997, 2004, 2005 and 2006); |
| Wet: | = |
7 events (1944, 1947, 1948, 1965, 1966, 1974 and 1992); and |
| Very wet: | = |
9 events (1943, 1945, 1946, 1949, 1957, 1979, 1980, 1982 and 1983). |
The 1985 event was reclassified as “average” because the anomaly obtained (0.50) was at the boundary between the “average” and “wet” classes and its flow characteristics were more compatible with events of the “average” type.
The curves obtained by the HyC classifications for each of the considered subseries are shown in , allowing us to distinguish between curves with different characteristics. These classifications define four classes of flow duration curves for the first three periods (subseries). For the subseries of the shorter period (1995–2006), only the “average” and “dry” classes were identified. It was, in fact, a very dry period overall, comprising eight years in the HyC class “dry” and four years in HyC class “average”. Out of this period, three events in the HyC “average” class occurred between 2004 and 2006.
Fig. 4 Flow duration curves obtained by HyC for different classes in the same periods: (a) 1934–2006, (b) 1963–2006, (c) 1979–2006, and (d) 1995–2006. Flow upstream of Sobradinho HPP.
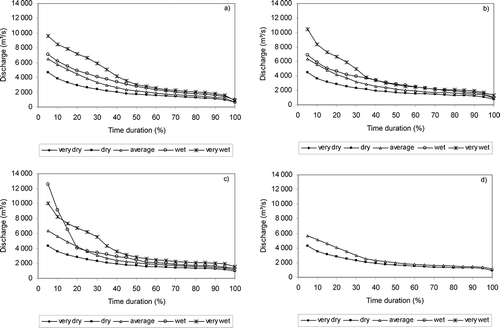
The FDCs were not presented on a logarithmic scale, as proposed by Vogel and Fennessey (Citation1994), because the differences would become less noticeable in the class-based comparison.
The SFR has a remarkably long period of streamflow hydrogram recession (5–6 months) after the flooding period. The magnitudes of the low flows depend on the contributions from aquifers in tributary catchments of the upper main course and catchments on the left margin of the central region. Additionally, the low-flow recession usually has very little variation. For this reason, the curves for the streamflow values of larger duration (>50%) are somewhat parallel and very close. However, the curves of each subseries show a well-defined separation when considered by the HyC classification method.
It is worth noting that, in the period between 1979 and 2006, the duration curve of the HyC “wet” class ((c)) has a distinct pattern, crossing the curves “very wet” and “average”, because the curve was derived from the daily streamflows of a single year (1992) in this period. It was observed that the maximum flows had a magnitude consistent with those of the “very wet” class, but because the flood was short in duration, the mean annual flow led to an anomaly in the “wet” class.
A comparison of the curves considering different periods (subseries) for the same classes demonstrates the ability of the method to obtain the curves of a class with minor dependency on the size of the data series (). The order from best (more points of coincidence in the curves) to worst, was “dry” condition, followed by “average”, “very wet” and, finally, “wet”. Interestingly, in the case of “average” HyC ((b)), it was found that the duration curve for the period 1995–2006, in particular, differed from the others at flows of less than 70%. This represents the influence of this period of low flows on the SFR, as all four years of “average” HyC had negative anomaly values (this class ranges from 0.5 to –0.5; see or ).
Fig. 5 Flow duration curves obtained by HyC in different periods for the same classes: (a) dry, (b) average, (c) wet, and (d) very wet. Flow upstream of Sobradinho HPP.
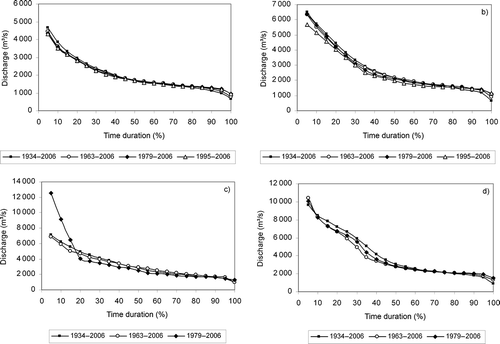
The evaluation of the relative errors for the shorter subseries of curves (periods P2, P3 and P4, as defined in the Methodology Section) compared to the curves of the whole set (P1) obtained by the HyC, numerically illustrates the performance of the method (). The first column identifies the durations for which the statistics of the relative error in the streamflow (second column) were determined.
Table 4 Relative error (%) in relation to the streamflow duration curve for the period 1934–2006 (P1). (P2: 1963–2006, P3: 1979–2006, P4: 1995–2006)
The relative errors confirm the good performance of the HyC method; that is, the weak influence of the size of the series on the results, as presented above and highlighted by visual analysis of the graphs. The mean values of the relative errors of streamflow between 5 and 95% of the duration curves were lower than 5% (). The mean values reflect a compensation in the occurrence of opposing values of relative differences that occurred between 5–50% and 55–95% of the duration (relative errors lower than 11%). The subseries discharges of shorter durations were smaller than those of the reference flow, while the discharges of longer durations were larger than those of the reference (, rows 4 and 5).
The maximum relative errors indicated that values in the shorter subseries were greater than those of the reference duration curve, P1 (1934–2006) by up to 24%, except for the value for Wet P3. The Wet P3 curve has the greatest difference (77%), because it represents only one year (1992) in the period, as mentioned previously. In the case of the minima, the relative errors indicated streamflow values lower than those from the reference curve, and reached values of 25% (, row 3).
Distinguishing the effects of climate on discharge
The analysis of the hydrological condition in the lower reach of the São Francisco River after the deployment of the Sobradinho HHP in 1978 was considered to demonstrate the application of the reference hydrological regime obtained using the HyC classification procedure. A comparison to the reference regime ultimately sought to discriminate between changes that derived from climatic variation and those resulting from streamflow regulation by dams. Recall that the Sobradinho Dam accounts for almost all of the regulation effect of the CHESF HPP system. The Traipu gauging station, located downstream of the whole HPP system, provided the streamflows occurring in the river's lower reach (see ).
The reference regime for the SFR can be obtained using either of two sets of available data:
| 1. | streamflow data from the lower reach of the river, downstream of the power plants prior to their installation (Traipu gauging station: 1939–1977) and streamflow data from upstream of the plants prior to their installation (Morpará and Boqueirão gauging stations: 1934–1977); or | ||||
| 2. | streamflow data upstream of the power plants after they were installed (Morpará and Boqueirão gauging stations: 1979–2006). | ||||
The first case considers the deployment of some dams (Paulo Afonso I, II and III, Moxotó and Três Marias) during the period. However, Moxotó and Paulo Afonso I, II and III do not have capacity to regulate flows, so they do not interfere significantly with the flows at the Traipu gauging station. The Três Marias Dam, situated far upstream of Sobradinho, has little influence on the river regime at this location, because important tributaries contribute to the SFR along the Três Marias–Sobradinho reach. Therefore, for the purposes of this study, the Sobradinho Dam was considered the major source of interference in the river main channel. The second case certainly indicates possible effects on flows resulting from changes in land use during 27 years, although it does not express the effects of the CHESF's HPP system.
To facilitate understanding, we first analysed the flow data without separation into HyC classes. The flow duration curves for the period prior to the installation of the power plants () show that the hydrological regimes upstream of the plants and in the lower reach of the SFR were the same (overlapping curves).
Fig. 6 Flow duration curves: upstream and downstream, post-Sobradinho Dam (1979–2006), pre-Sobradinho Dam upstream (1934–1977) and downstream (1939–1977).
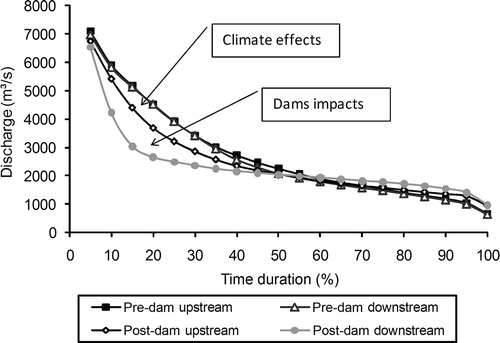
Using the duration curve of the period prior to the installation of the power plants as a reference for the hydrological regime of the SFR, and comparing it to that obtained for the post-dam period (), reductions in streamflows in the lower course of the SFR for durations between 10 and 50%, and an increase in the flow rates between durations 60 and 95% were observed.
Figure 6 shows that the FDC of the post-dam period upstream of the power plants differs from those of the pre-dam period, implying that there was a different hydrological regime for the period 1979–2006 in the SFR due to climate effects.
The difference between the pre-dam reference curves and the downstream post-dam curve represents the change in the hydrological regime resulting from the combined effect of different climatic conditions and changes resulting from interventions in the watershed. However, the difference between the upstream and downstream post-dam curves represents the direct effects of the deployment and operation of power plants, diversion for irrigation, and other possible changes in the watersheds of the incremental area. Thus, the difference between the reference curve (pre-dam) and the upstream post-dam curve should be the result of different climatic conditions and, possibly, some effects of human use and occupation in the upstream basin. If there was a similar climatic condition, the “post-dam upstream” curve would overlap the “pre-dam” curves and the difference in the “post-dam downstream” curve would be a result of dam operation.
Estimates of the annual volumes of streamflow corresponding to the integral of the duration curves allowed us to analyse the climate and dam effects. The pre-dam volume from the curves was equivalent to about 85.9 × 10⁹ m3, while the post-dam upstream and downstream volumes were 81.2 and 74.3 × 10⁹ m3, respectively. The difference between the pre-dam (reference condition) and post-dam curves indicates a reduction of 11.6 × 10⁹ m3 (i.e. 369 m3 s-1). Of these volumes, the climatic condition is responsible for a difference of 4.79 × 10⁹ m3 (152 m3 s-1; 41%) between pre- and post-dam periods and a difference of 6.85 × 10⁹ m3 (217 m3 s-1; 59%) was derived from damming effects.
Figure 7 shows the flow duration curves obtained using the HyC method. The first aspect to highlight is that the climate variability tended to disappear when the curves were separated by class, although there was some difference with respect to climatic condition. Because the applied method adopts ranges of values to classify the annual events, small differences between the curves can be expected.
In the “average” class, there was practically no difference between the upstream pre- and post-dam curves ((b)), while in the “dry” class, there was a small difference ((a)). The “wet” class presented an important case of differentiated conditions because its behaviour was very distinct from those of the reference curves ((c)). In the case of the “very wet” class, despite the apparent similarity of the curves ((d)), the streamflows were of great magnitude, which resulted in a difference in annual flow volume of 7.18 × 10⁹ m3 (228 m3 s-1), corresponding to the effect of a changed climatic condition. The differences in annual flow volumes of the other classes are presented in . Considering the HyC classes, these differences, when compared to the volumes that entered upstream of the Sobradinho Dam, correspond to 4% for the “dry” class, 2% for the “average” class, –6% for the “wet” class and 6% for the “very wet” class.
Table 5 Differences in annual volumes and streamflows according to the HyC classes in 109 m3 (m s-1)
Fig. 7 Flow duration curves for pre- and post-Sobradinho Dam periods (1939–1977 and 1979–2006), upstream and downstream: (a) HyC “dry”, (b) HyC “average”, (c) HyC “wet”, and (d) HyC “very wet”.
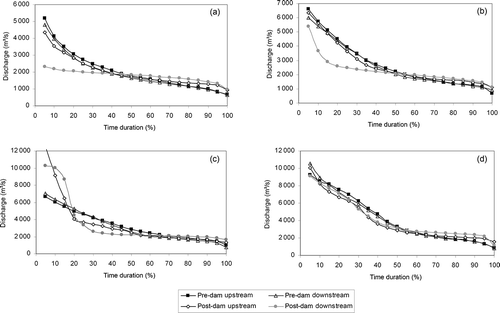
The second aspect to note is that the proposed method made it evident that the changes varied with class. Years of low flows (“dry” HyC class) and medium flows (“average” HyC class) were highly impacted, drastically reducing variation of the streamflows ((a) and (b)). The events of the “very wet” HyC class were practically unchanged because the dam system was unable to attenuate the major floods significantly ((d)). However, for the events of the “wet” HyC class, the effect of reservoir operation can be observed in the hydrological regime, because it refers to 1992, a single event in the period 1979–2006 ((c)).
The dams' impacts on the “dry” and “average” HyC classes () show reductions in the annual flow volume upstream of the HPP system of 11% and 15%, respectively. The operation of the reservoirs had a negligible effect on the flow volume in the “wet” class (decrease of 0.2%), while in the “very wet” class there was a small increase in volume with respect to upstream (5%). The latter occurs due to the higher flow rates released during the dry season (flow rates of higher frequency in the duration curve), which result from climatic conditions and the releases necessary to provide flood storage volumes.
DISCUSSION
In observing the anomalies classified by the HyC method (), it is worth noting that, from 1987 to 2006, there were important influences of climate variability and hydrological effects on the curves of the impacted reach of the SFR (). This occurred due to the sequence of years in the “dry” HyC class (all 12 years occurring after 1979) interspersed with seven years of the “average” class and one year of the “wet” class. It is also worth noting that, in the same period, the expansion of the CHESF hydropower plant (HPP) system occurred, beginning with the operations of the Itaparica and Xingó HPPs in 1988 and 1994, respectively.
Because the Sobradinho Reservoir has the highest capacity of flow regulation, the effects of the reservoirs of Itaparica and Xingó are relatively much less important. Moreover, such impacts are not easily identifiable because these reservoirs were constructed during different short-term climatic conditions. Thus, they were not considered in the main scope of this paper.
The period 1979–2006 (P3) allowed the analysis of the effects of the dams of the SFR for all HyC classes. However, the period 1995–2006 (P4) considered only the events of the “dry” and “average” classes and was therefore not incorporated into this paper.
A comparison between curves related to pre- and post-damming indicate a decrease in the volume of the discharges in the lower reach of the SFR. A simple estimate of the causes of such a reduction was made based on the information presented in the description of the study area. The volume (6.85 × 10⁹ m3; 217 m3 s-1) can be separated into evaporation losses in the Sobradinho Reservoir (4.16 × 10⁹ m3; 132 m3 s-1, Pereira et al. 2009), effective consumption by irrigation (1.31 × 10⁹ m3; 41.6 m3 s-1; Agência Nacional de Águas Citation2004). By difference, the remaining 1.38 × 10⁹ m3 (43.6 m3 s-1) seem to be related to the regulation effect and other minor effects in the watersheds of the incremental area.
Although the incremental area between the Morpará + Boqueirão and Traipu gauging stations exceeds 200 000 km2, the flow contribution is very small because they come from watersheds located in a semi-arid region, as described in the Study Area and Data Section. During the rainy season, significant intake inflows may occur, but they are of short duration (a few days). For instance, the biggest tributary in this incremental area is the Pajeú River (19 000 km2 basin area), which has an average of the annual maxima equal to 514 m3 s-1 and a 2% frequency daily mean flow equal to 219 m3 s-1 (Floresta gauging station: 12 300 km2; 1977–2006), illustrating the very low frequency of significant peak discharges. In addition, the reservoirs in the Pajeú River basin total 524 × 106 m3 (only those with storage >106 m3). The short duration of the flood events results in a weak influence on the values of SFR average annual discharges and FDCs.
The particular characteristics of the SFR hydrological regime and its system of dams require the HyC method to be tested in basins with other hydro-climatic conditions.
Large basins, including the SFR, present a more attenuated discharge response to rainfall temporal and spatial variability than smaller basins, which may result in the similarity between FDCs for different data periods or series sizes.
The size of hydrological time series is the main issue concerning the limitations of the reference curves obtained by the method. Short time series may result in few events in some HyC classes, therefore diminishing the representativeness of such reference curves.
Although normalization of data is a usual procedure, variations in the definition of the index considered (Anomaly) may interfere in the performance of the method. Results may change depending on the streamflow statistic used to define the HyC reference value (e.g. mean, median, monthly max).
In addition, the amplitude and number of classes for the HyC determined by the thresholds adopted (e.g. standard deviation, frequency percentiles) may lead to different reference curves.
In spite of the mentioned limitations, the major strengths of the applied method are its simplicity and the possibility of discriminating causes of hydrological variability, as illustrated by the São Francisco River example.
CONCLUSIONS
The proposed methodology for considering the effects of climate variability on the flow regime applied criteria for the classification of annual streamflow events according to the hydrological conditions of the basin (HyC). This approach allows the establishment of hydrological reference regimes and for the distinction between climate effects and dam impacts on the hydrological regime, which is useful to assess hydrological alterations.
The applicability of the method was demonstrated by the flow duration curves (FDC) of the São Francisco River, a large tropical Brazilian river strongly influenced by dams. Analyses of the SFR hydrological regime over the period after the implementation of the main hydropower plant (1978) show that dam effects are responsible for 59% of the hydrological changes to the environment, while the climate (in driest conditions) contributed 41% of the total changes. Dam effects result not only from their operation and capacity for regulation but also from the high losses by evaporation in their reservoirs and diversions for irrigation.
Furthermore, the analysis of the FDCs separated by HyC class allowed a more detailed characterization of the impacts of hydropower plant operation on the hydrological regime of the lower course of the SFR.
In addition to categorizing different hydrological regimes, the methodology allows the estimation of hydrographs of different features that are needed for the analysis and design of instream environmental flows, among many other applications.
Future studies are recommended to evaluate the method for the classification of events to define a seasonal hydrograph for reference, which is another important element for the assessment of hydrological changes in regulated rivers.
When short streamflow series are used to define a hydrological reference regime, it is recommended to analyse the normalized anomalies of longer series of precipitation to help assess the representativeness of extreme years (dry or very wet).
The application of the HyC method in the study of hydrological alterations in the lower reach of the São Francisco River demonstrates its potential for the analysis of climatic and hydrological variabilities. It would be valuable to test the method in basins of other sizes and hydro-climatic conditions. In addition, the influence of the size of the time series on the results of the HyC method must be further investigated in future studies to assure the general usability of the method.
Acknowledgements
Fernando Genz was supported by a CNPq/CT-Energ research grant (554662/2006-0). This work was part of a CNPq-funded project (“Identification of a hydrological regime compatible with ecological objectives for the lower São Francisco River”, CNPq grant number 555469/2006-9).
REFERENCES
- Agência Nacional de Águas . 2004 . “ Disponibilidade hídrica quantitativa e usos consuntivos ” . In Projeto de Gerenciamento Integrado das Atividades Desenvolvidas em Terra na Bacia do São Francisco, Subprojeto 4.5C – Plano Decenal de Recursos Hídricos da Bacia Hidrográfica do Rio São Francisco—PBHSF (2004–2013) , Brasília : Estudo Técnico de Apoio ao PBHSF – N 01 .
- Arthington , A.H. 1992 . “ Development of a holistic approach for assessing environmental flow requirements of riverine ecosystems ” . In Water allocation for the environment , Edited by: Pigram , J.J. and Hooper , B.P. 69 – 76 . Proceedings of an International Seminar and Workshop. Armidale, NSW: Centre for Water Policy Research, University of New England .
- Baron , J.S. 2003 . Sustaining healthy freshwater ecosystems . Ecological Society of America, Issues in Ecology , 10
- Bunn , S.E. and Arthington , A.H. 2002 . Basic principles and ecological consequences of altered flow regimes for aquatic biodiversity . Environmental Management , 30 : 492 – 507 .
- Brazilian Committee on Dams . 2000 . Highlights of Brazilian dam engineering , Rio de Janeiro , Brazil : Brazilian Committee on Dams .
- Carvalho , M.S.B.S. 2009 . Levantamento dos espelhos d’água acima de 20 ha em todo o território brasileiro através de sensoriamento remoto , 1967 – 1974 . Natal , , Brazil : Anais, XIV Simpósio Brasileiro de Sensoriamento Remoto .
- Chen , Z. and Grasby , S.E. 2009 . Impact of decadal and century-scale oscillations on hydroclimate trend analyses . Journal of Hydrology , 365 : 122 – 133 .
- Collischonn , W. , Clarke , R.T. and Tucci , C.E.M. 2001 . Further evidence of changes in the hydrological regime of the River Paraguay: part of a wider phenomenon of climate change? . Journal of Hydrology , 245 : 218 – 238 .
- Di Baldassarre , G. and Montanari , A. 2009 . Uncertainty in river discharge observations: a quantitative analysis . Hydrology and Earth System Sciences , 13 : 913 – 921 .
- Kennard , M.J. 2010 . Quantifying uncertainty in estimation of hydrologic metrics for ecohydrological studies . River Research and Applications , 26 : 137 – 156 .
- Koutsoyiannis , D. 2002 . The Hurst phenomenon and fractional Gaussian noise made easy . Hydrological Sciences Journal , 47 ( 4 ) : 573 – 595 .
- Gibson , J.J. , Prowse , T.D. and Peters , D.L. 2006 . Partitioning impacts of climate and regulation on water level variability in Great Slave Lake . Journal of Hydrology , 329 : 196 – 206 .
- Hamed , K.H. and Rao , A.R. 1998 . A modified Mann-Kendall trend test for autocorrelated data . Journal of Hydrology , 204 : 182 – 196 .
- McKee , T.B. , Doesken , N.J. and Kliest , J. 17–22 January 1993 . “ The relationship of drought frequency and duration to time scales ” . In Proceedings of the 8th conference of applied climatology , 17–22 January , 179 – 184 . Boston , MA : American Meterological Society . Anaheim, CA
- Mauget , S.A. 2003 . Multidecadal regime shifts in US streamflow, precipitation, and temperature at the end of the twentieth century . Journal of Climate , 16 ( 23 ) : 3905 – 3916 .
- Milly , P.C.D. 2008 . Stationarity is dead: whither water management? . Science , 319 : 573 – 574 .
- Nilsson , C. 2005 . Fragmentation and flow regulation of the world's large river systems . Science , 308 : 405 – 408 .
- Paturel , J.E. 2003 . The concept of rainfall and streamflow normals in West and Central Africa in the context of climatic variability . Hydrological Sciences Journal , 48 ( 1 ) : 125 – 137 .
- Pekárová , P. , Miklánek , P. and Pekar , J . 2003 . Spatial and temporal runoff oscillation analysis of the main rivers of the world during the 19th–20th centuries . Journal of Hydrology , 274 : 62 – 79 .
- Pereira , S.B. 2009 . Evaporação líquida no lago de Sobradinho e impactos no escoamento devido á construção do reservatório . Revista Brasileira de Engenharia Agrícola e Ambiental , 13 : 346 – 352 .
- Poff , N.L. 1997 . The natural flow regime: a paradigm for river conservation and restoration . Bioscience , 47 : 769 – 784 .
- Poff , N.L. 2007 . Homogenization of regional river dynamics by dams and global biodiversity implications . Proceedings of the National Academy of Sciences , 104 : 5732 – 5737 .
- Richter , B.D. 1997 . How much water does a river need? . Freshwater Biology , 37 : 231 – 249 .
- Sato , Y. and Godinho , H.P. 2004 . “ Migratory fishes of the São Francisco river ” . In Migratory fishes of South America: Biology, fisheries, and conservation status , Edited by: Carolsfield , J. World Fisheries Trust/World Bank/IDRC .
- Sauer , V.B. and Meyer , R.W. 1992 . Determination of error in individual discharge measurements . US Geological Survey Open-File Report , : 92 – 144 .
- Smakhtin , V.U. 1999 . Generation of natural daily flow time series regulate rivers using a non-linear spatial interpolation technique . Regulated Rivers: Research and Management , 15 : 311 – 323 .
- Smakhtin , V.U. 2001 . Low flow hydrology: a review . Journal of Hydrology , 240 : 147 – 186 .
- Sparks , RE. 1995 . Need for ecosystem management of large rivers and their floodplains . Bioscience , 45 : 169 – 182 .
- Walker , K.F. , Sheldon , F. and Puckridge , J.T. 1995 . A perspective on dryland river ecosystems . Regulated Rivers , 11 : 85 – 104 .
- Vogel , R.M. and Fennessey , N.M. 1994 . Flow-duration curves. I: New interpretation and confidence intervals . Journal of Water Resources Planning and Management , 120 ( 4 ) : 485 – 504 .
- Ward , J.V. , Robinson , C.T. and Tockner , K. 2002 . Applicability of ecological theory to riverine ecosystems . Verhandlungen des Internationalen Vereins Limnologie (Stuttgart) , 28 : 443 – 450 .