Abstract
Reservoir silting is one of the principal problems affecting the performance of dams in Algeria from the standpoint of reservoir capacity for storage. Foum El Kherza Reservoir (also known as Foum El Gherza), near Biskra Town, Algeria, is subject to dredging operations with the intent of recovering 70% of its initial storage capacity of 47 hm3 (million cubic metres). The forecasting of sediment volume trapped in the reservoir is essential to plan the future use of this resource and to sustain irrigation for the palm groves characteristic of the region. However, there are currently no sediment data, nor a sediment rating curve, for predicting sediment inflow based on hydrological data. This paper describes the optimization of a cumulative trapped sediment curve for Foum El Kherza Reservoir based on 44 years of daily inflows, by using a spreadsheet optimization tool, Microsoft Excel® Solver to calibrate the cumulative sediment load against the cumulative sediment inflow as documented by eight bathymetric surveys since the dam construction.
Editor D. Koutsoyiannis; Associate editor A. Montanari
Citation Tebbi, F.Z., Dridi, H., and Morris, G.L., 2012. Optimization of cumulative trapped sediment curve for an arid zone reservoir: Foum El Kherza (Biskra, Algeria). Hydrological Sciences Journal, 57 (7), 1368–1377.
Résumé
La sédimentation dans les réservoirs est l'un des principaux problèmes qui affectent la performance des barrages en Algérie, du point de vue de la sécurité des structures, de la capacité des retenues pour le stockage ainsi que de la qualité des eaux. Le réservoir de Foum El Kherza (aussi connu sous le nom d'El Gherza) à Biskra en Algérie, est l'objet d'une opération de dévasement visant à récupérer 70% de sa capacité initiale de 47 hm3. La nécessité de prévoir le volume des sédiments retenus dans le réservoir est essentielle pour planifier l'utilisation future de cette ressource et maintenir l'irrigation des palmeraies de la région. Il n'existe cependant pas actuellement de données sur les sédiments, ni de courbe de tarage des sédiments, pour prévoir les apports solides à partir des données hydrologiques. Le présent article décrit l'optimisation d'une courbe cumulative de sédiments piégés pour le réservoir de Foum El Kherza basée sur 44 années d'apports journaliers et sur le calage du cumul de l'apport solide tenant compte de huit levés bathymétriques réalisés depuis sa construction.
1 INTRODUCTION
Reservoir sedimentation is a complicated pheno-menon, governed by multiple hydraulic and hydrological variables. Unfortunately, there is no analytical relationship to accurately predict the rate of deposition or capacity loss in a reservoir from the relevant parameters (Singh and Durgunoglu Citation1990). This leads to the use of empirical relationships that often diverge from in situ measurements (Remini and Hallouche Citation2005). Several methods have been used to predict sediment yields, the most widely-used being construction of a sediment rating curve, which combines sediment concentration data with discharge data to create a rating equation that can be applied to a long-term hydrological discharge time series. Other methods include regional sediment yield estimates (Grauso et al. Citation2008), erosion-based models based on USLE and its later modifications (Demmak Citation1984, MacArthur et al. Citation1995), and methods such as the PSIAC and similar semi-quantitative models based primarily on watershed geomorphic characteristics (De Vente and Poesen Citation2005). Many mathematical models have been developed for simulation of fluvial sediment behaviour: HEC6® and HEC-RAS® (HEC Citation1991, Citation1995), FLUVIAL® (Chang Citation1998), GSTARS/SRH-1D® (Molinas and Yang Citation1986, Huang and Greimann Citation2007). All these models are strongly data-dependent and require adequate data for calibration and verification, but in practice the field data required for this purpose are often lacking (Morris and Fan Citation1998).
Most Algerian dams are subject to high rates of silting, losing nearly 1% of their capacity each year (Bessenasse et al. Citation2004). However, gauging sites are few and data may not be reliable or continuously available. This data deficiency constitutes an important constraint for studying these sites and hinders the use of numerical models (Remini and Hallouche Citation2005).
Many attempts have been made to estimate sediment yield entering reservoirs in Algeria. Tixeront (Citation1960) established a power relationship between the annual erosion rate and the annual runoff depth. Remini and Avenard (Citation1998) estimated sedimentation of the Foum El Kherza Reservoir as a polynomial function of time. Remini and Hallouche (Citation2005) established two relationships giving annual sediment inflows as a function of operational time, a power function for Maghreb's reservoirs having a high sedimentation rate, and a linear function for those having a low rate. Meddi et al. (Citation1998) used data from 18 Algerian reservoirs to establish a model of annual sediment inflow as a function of two parameters, annual inflows and watershed area. Kassoul et al. (Citation1997) developed a classification abacus function model, and Bessenasse et al. (Citation2004) applied a two-dimensional hydraulic model using Saint Venant equations and a convection–diffusion model to predict the evolution of the deposits in Zardezas Reservoir.
Usually, a sediment rating curve is developed from several years of sediment gauging data, and this is then applied to the hydrological time series to estimate long-term sediment yield. By correcting for reservoir trap efficiency and sediment bulk density, the volume of sediment accumulation within a reservoir can be computed (Morris and Fan Citation1998). However, a sediment gauge has never been installed above Foum El Kherza Reservoir and thus no independent means of estimating the sediment rating curve exists. Therefore, in the present study, the sediment rating relationship is back-estimated from reservoir survey data taken at several points in time, plus water inflow data. The sediment rating relationship, concentration vs discharge, is developed by using the rating relationship applied on a daily time step to compute a cumulative trapped sediment curve, which is fitted against the available reservoir sedimentation data. Optimization of the rating relationship is achieved via the Solver Add-In within Microsoft Excel®, which can analyse a variety of mathematical programming problems: linear problems are solved by simplex method; integer variable problems by branch-hand-bound method and nonlinear problems are solved by generalized-reduced-gradient (Lasdon and Waren Citation1982).
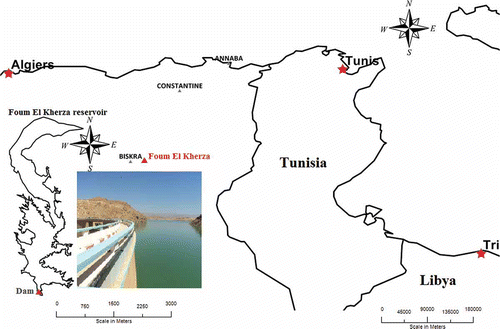
2 STUDY AREA
Foum El Kherza Reservoir (also known as El Gherza) is located on the Labiod River near the town of Biskra, Algeria (). Principal characteristics of the Foum El Kherza Dam are given in . The reservoir receives approximately 0.60 hm3 of sediment per year from its 1300-km2 watershed in the southern foothills of the Aurès Mountains, an area characterized by a semi-arid to arid climate, sparse vegetative cover and high relief. Built in 1950, it is one of the oldest reservoirs in Algeria, but has lost nearly 75% of its capacity due to sedimentation. The reservoir is considered a national heritage site, and because of its importance in preserving the region's traditional date palm groves, a dredging operation has been initiated to recover 70% of the initial storage capacity of 47 hm3. Knowledge of the time-wise variation in sediment inflows can provide information that is useful to analyse and improve future sediment management options.
Table 1 Principal characteristics of Foum El Kherza Dam and its drainage area
Fig. 1 Foum El Kherza dam location map.
3 METHODS
3.1 Data
Daily inflows computed from a daily reservoir water balance for the period September 1967 to May 2011 were available from the national agency for dams and water transfer (ANBT, Biskra) and are shown in . More than 95% of daily inflows are less than 0.2 hm3 with periodic flood events of short duration, a pattern characteristic of arid regions. Major inflow events occurred on 1 September 1990, 16 April 2004 and 4 May 2006, with inflow volumes of 13.74, 25.21 and 19.20 hm3, respectively. Several descriptive statistics are presented in .
Fig. 2 Daily inflows to Foum El Kherza Reservoir.
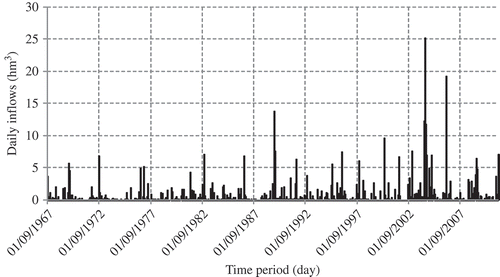
Table 2 Descriptive statistics of daily inflows
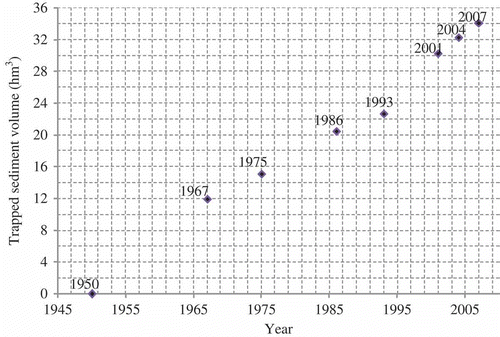
shows the cumulative loss of reservoir capacity documented by seven reservoir bathymetric surveys performed in 1967, 1975, 1986, 1993, 2001, 2004 and 2007. The last survey was immediately following the first tranche of dredging which removed 4 hm3.
Fig. 3 Cumulative storage loss at Foum El Kherza Reservoir over time.
3.2 Available methods
3.2.1 Sediment Rating Curve
A sediment rating curve (hereafter SRC) is an empirical relationship between the water discharge Q (m3 s-1) and sediment concentration C (kg m-3) or sediment discharge QS (kg s-1). It is a “black box” type model, not directly related to any physical parameters and having a standard form of:
or
Coefficients a, a′, b and b′ are empirically determined, where a represents the sediment concentration for a discharge of 1.0 m3 s-1, a′ represents the sediment load for a discharge of 1.0 m3 s-1and b and b′ reflect the concentration or load response to changes in discharge. Values for b typically fall in the range of 1 to 2, or possibly higher (Julien Citation2010), and tend to be inversely correlated to the intercept a (Asselman Citation2000). Several studies have examined the potential physical meaning associated with the SRC coefficient values. Benkhaled and Remini (Citation2003) showed that sediment rating curve parameters are strongly influenced by rainfall, runoff and soil moisture. Frostick et al. (Citation1983) noted that dryland streams are associated with values of b less than 1 and high values for a.
Sediment rating curves are commonly used to estimate reservoir sedimentation. Khanchoul and Remini (Citation2009) judged that sediment rating curves were adequate to predict sedimentation at the Bouhamdane Reservoir. Jahani (Citation1992) demonstrated that the rating relationship based on all available samples produces the most reliable results when compared to Dez Reservoir bathymetric surveys. Olesen et al. (Citation2000) established a sediment rating curve for evaluating the useful life of Itiquira Reservoir, and Chutachindakate (Citation2009) compared both multi-linear regression neural network and SRC method to estimate sedimentation at Managawa Reservoir. However, care is needed in the use of the SRC method. Measurements not based on continuous recordings could give unreliable estimates of sediment yields primarily due to the potential for under-reporting the larger events that transport most sediment (Walling Citation1977a, Citation1977b, Asselman Citation2000, Horowitz Citation2002, Citation2003). Data extrapolation to estimate sediment concentration at high discharges can also lead to serious error.
3.2.2 Bathymetric survey
Sediment yield from the watershed can be computed from reservoir deposit volume determined by repeated bathymetric surveys, combined with the deposit mean bulk density estimated by empirical methods or core samples and correcting for reservoir trap efficiency. Reservoir resurvey data generally represent a more reliable measure of the long-term basin sediment yield than fluvial gauging stations, because they trap sediment from all events and because bed load, which is frequently not measured at fluvial sediment stations, is also accounted for (Morris and Fan Citation1998). Reservoir survey technology has changed significantly over recent decades with the dramatic increase in the speed of data acquisition and computer system processing (Bruk Citation1985, USBR Citation2006). Collection of bathymetric data at multi-year intervals is typically much less costly than continuous operation of fluvial sediment gauging stations. The main sources of error in reservoir surveys are related to changes in measurement methodology (photogrammetry or topographic maps for pre-impoundment, range line surveys and computer-assisted contour surveys for underwater survey). Another important source of error is the mean sediment bulk density, which is usually estimated rather than sampled, varies over the area of the reservoir, and can change from one survey to the next due to sediment compaction (Morris and Fan Citation1998).
Many studies have used reservoir resurveys to estimate sediment yield and reservoir sedimentation rates. Rowan et al. (Citation1995) obtained sediment yield between successive surveys of Abbeystead Reservoir, UK by gravimetric conversion of storage capacity losses, corrected for untrapped sediment lost directly over the spillway. Furnans and Austin (Citation2008) estimated from over 100 bathymetric surveys of Texas reservoirs, capacity loss over time due to sedimentation. Snyder et al. (Citation2004) quantified the mass, grain size and accumulation rates of the material deposited in Englebright Lake, California, USA. White et al. (Citation1997) calculated the sediment yield for the Strines catchment, UK, comparing estimates of original reservoir capacity against measured capacities in 1956, 1993 and 1994. Batalla and Vericat (Citation2011) estimated sediment yield of the Ebro basin in Spain from reservoir sedimentation records over the 20th century.
3.2.3 Trap efficiency
Reservoir trap efficiency is the percentage of the total inflowing sediment retained in a reservoir. The most widely used empirical method for estimating long-term trap efficiency is by Brune's curve (Brune Citation1953), which estimates trap efficiency based on the ratio of storage capacity to mean annual inflow of water (Heinemann Citation1984, Morris and Fan Citation1998, Batuca and Jordaan Citation2000). Trap efficiency varies greatly from one event to another and can also be strongly influenced by reservoir operation (hydraulic residence time). Nevertheless, the long-term trap efficiency declines as a reservoir fills with sediment and the capacity/inflow ratio diminishes, as predicted by Brune.
3.3 Methodology
3.3.1 Sediment inflow by rating equation
A sediment rating curve relating mean daily total sediment concentration to daily discharge entering Foum El Kherza Reservoir was constructed and calibrated against the curve of cumulative trapped sediment. The initial rating curve parameters were selected based on other studies in the region, and optimized to provide the best fit against the reservoir sedimentation documented by bathymetric surveys of sediment volume. Because the surveys documented the entire trapped sediment load, the rating curve will include both suspended and bed material. The inflowing sediment rating curve was also adjusted to account for reservoir trap efficiency by the Brune curve plus sediment removal by pressure flushing, dredging and the two large full reservoir flood events of 2004 and 2006. At this site, pressure flushing is performed by opening the bottom outlet during or following a flood to release turbid water while the reservoir level remains high. Detailed information on this procedure is not available.
The following procedure was used to fit the best cumulative trapped sediment curve to the available data. First, the 44 years of recorded daily water volumes in the reservoir were converted into mean daily discharges Q (in m3 s-1) and total sediment concentration Ct
(in kg m-3) was computed as a power function of water discharge using Equationequation (1)(1). Total sediment load Q
s
(in kg s-1) was calculated from concentration by:
and then converted to daily sediment mass Ms (t). This time series was adjusted by the mass of sediment released by specific activities, as described below. Daily volumes flushed (FV s , m3) or spilled (SV s , m3) were converted into sediment mass flushed (FM s , t) or spilled (SM s , t) out of the reservoir.
3.3.2 Historical sediment inflow time series
To a convert surveyed sediment volume to mass, it was necessary to estimate the dry bulk density of the deposits, which varies as a function of both grain size and the consolidation process. Field data on the composition of reservoir sediment are not available, but based on Remini and Avenard (Citation1998) they are estimated to consist of a combination of silts and sands. The typical value of dry bulk density of such a combination of reservoir sediments is in the range of ρ = 1.4 t m-3 (Geiger Citation1963). All sediment volumes were converted to mass by this bulk density value.
In 44 years of observations, six flushing events were reported, typically after each major flood, with the largest flushing volume being that of 2009. Lacking data on the water–sediment ratio for flushing events at Foum El Kherza Reservoir, this value was taken as 10, considered as a mean value for Algerian dams (Remini et al. Citation1997).
Two major floods occurred in 2004 and 2006, with the reservoir nearly full at the start of both events. For these events the water–sediment volume ratio is taken as 20.
Dredging started in 2006, and 4 hm3 had been removed prior to undertaking the bathymetric survey in July 2007. The dredged sediments were discharged to basins upstream of the reservoir. This volume was converted to mass DM S by the same sediment bulk density. The second tranche of the dredging operation had not started at the time of writing. The curve of cumulative sediment accumulation was converted to mass, adjusted for the sediment removal events as computed above, and plotted as a function of time.
3.3.3 Cumulative trapped sediment curve optimization
The cumulative trapped sediment curve (CTSC) is obtained by summing the daily inflows of sediment mass for all years Ms (t). Through the Microsoft Excel® Solver graphical user interface (GUI), cells that contain an objective function were specified as well as constraints, variables and Solver options, which affect the resolution and accuracy of the result.
| a. | Objective function Maximization of Nash criterion calculated between mass of cumulative trapped sediment and mass by bathymetric survey for the six survey dates after the initial 1967 survey: where BM is the bathymetric survey mass (t); CM is the cumulative trapped sediment mass (t); and | ||||||||||||||||
| b. | Variables Intercept a and power b of the rating curve | ||||||||||||||||
| c. | Constraints
| ||||||||||||||||
The objective function is specified as a nonlinear function in Microsoft Excel® Solver.
Table 3 Some values of intercept a from Algerian studies
4 RESULTS AND DISCUSSION
By comparison against the cumulative trapped sediment at Foum El Kherza Reservoir (), the inflowing sediment rating curve (SRC) was determined to be:
Fig. 4 Optimized cumulative trapped sediment curve (CTSC) at Foum El Kherza Reservoir.
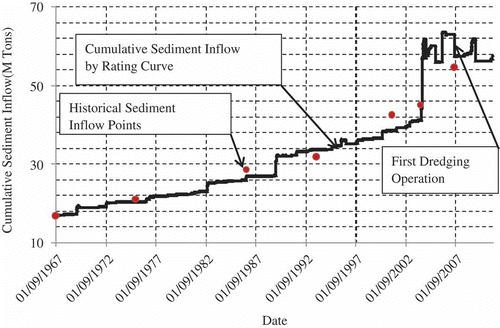
Performance criteria were tested against the six sedimentation survey points.
In their study on the same reservoir, Remini and Avenard (Citation1998) concluded that the reservoir's sedimentation evolution is a second-degree polynomial function of time and tends towards stabilization, which is not the case, as the number of flash floods with large sediment loads has increased from 2004 to 2009. Fortunately, sediment spilling was probably more efficient during the 2004 and 2006 floods, because the reservoir was already full, plus there were beneficial effects from the operation of bottom outlet and dredging. The sediment rating curve approach shows the influence of such events.
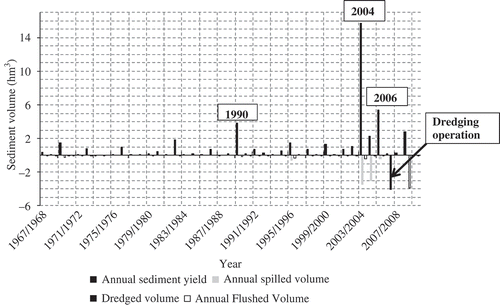
As expected, the results in indicate that annual sediment trap efficiency is quite variable and can differ from the long-term mean predicted by the Brune curve. This is due to year-to-year hydrological variability and reservoir operation, such as the occurrence of large floods when the reservoir is almost full (e.g. the floods of 2004 and 2005). shows the inter-annual variability of sediment yield at Foum El Kherza Reservoir obtained from the CTSC and the corresponding flushing, spilling and the first tranche of dredging operation after the 2004 event.
Table 4 Trap efficiency, TE, of Foum El Kherza Reservoir
Fig. 5 Annual sediment balances, showing both sediment inputs and releases.
Several uncertainties are associated with the application of this approach, the principal one being the sediment dry bulk density which is estimated from Geiger (1963). The water–sediment ratios are estimated from observations of Algerian dams, and may be very different from those of Foum El Kherza; they have also been taken as constant values, although in reality these values will differ between one event and another. More accurate values for these parameters will certainly improve results. Exponent b and intercept a are closely correlated coefficients, and such optimization problems can have more than one solution. Thus, constraints derived from knowledge of the anticipated reasonable range of values helps keep the solution realistic.
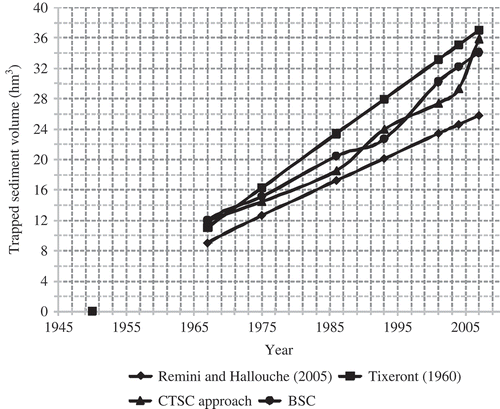
summarizes results from the present approach and previous studies by Remini and Hallouche (Citation2005) and Tixeront (1960), as well as the bathymetric survey data, showing that the CTSC approach has performed satisfactorily.
Fig. 6 Cumulative storage loss at Foum El Kherza Reservoir from bathymetric surveys (BSC), CTSC approach and prior studies.
5 FINAL REMARKS
Use of a cumulative trapped sediment curve as a means to develop and calibrate a sediment rating curve from bathymetric survey data constitutes a tool to solve constraints imposed by the lack of gauged data on sediment load. The resulting sediment rating curve can provide information on the temporal characteristics of sediment yield that is not available from bathymetric survey data. An interesting benefit of this approach is that the sediment yield can be estimated over short time scales using daily water inflows. This allows better prediction of storage loss since the last survey, and also provides information that can assist in the development of alternative sediment management techniques, such as sediment pass-through, which requires data on daily sediment loads.
Acknowledgements
The Authors would like to thank D. E. Walling, A. Montanari and three anonymous reviewers for their useful comments. Thanks are also due to M. Kalla and L. Houichi for fruitful discussions and comments on reservoir sedimentation modelling, and to M. Chelihi for checking the text. Special thanks go to the National Agency for Dams and water Transfer (ANBT, Algiers and Biskra) for their help in providing us with complementary and valuable data.
REFERENCES
- Achite , M. and Ouillon , S. 2007 . Suspended sediment transport in a semiarid watershed, Wadi Abd, Algeria (1973–1995) . Journal of Hydrology , 343 ( 3–4 ) : 187 – 202 .
- Asselman , N.E.M. 2000 . Fitting and interpretation of sediment rating curves . Journal of Hydrology , 234 ( 3–4 ) : 228 – 248 .
- Batalla , R. and Vericat , D. 2011 . An appraisal of the contemporary sediment yield in the Ebro Basin . Journal of Soils and Sediments , 11 ( 6 ) : 1070 – 1081 .
- Batuca , D.G. and Jordaan , J.M. 2000 . Silting and desilting of reservoirs , Taylor & Francis .
- Benkhaled , A. and Remini , B. 2003 . Analyse de la relation de puissance: débit solide-débit liquide à l’échelle du bassin versant de l'Oued Wahrane (Algérie) . Journal of Water Science , 16 ( 3 ) : 333 – 356 .
- Bessenasse , M. , Kettab , A. and Paquier , A. 2004 . Simulation numérique de la sédimentation dans les retenues de barrages : cas de la retenue de Zardezas . Revue des sciences de l'eau , 16 : 20
- Bruk , S. 1985 . Methods of computing sedimentation in lakes and reservoirs: Meeting of the 2nd International symposium on river sedimentation , Paris : Unesco Report .
- Brune , G.M. 1953 . Trap efficiency of reservoirs . Transactions of the American Geophysical Union , 34 ( 3 ) : 407 – 418 .
- Chang , H. 1998 . Fluvial-12 Mathematical model for erodible channels , San Diego , CA : San Diego University .
- Cherif , E.A. , Errih , M. and Cherif , H.M. 2009 . Statistical modelling of the solid transport in the Wadi Mekerra basin (Algeria) in the Mediterranean semi-arid zone . Hydrological Sciences Journal , 54 ( 2 ) : 338 – 348 .
- Chutachindakate , C. 2009 . Integrated sediment approach and impacts of climate change on reservoir sedimentation , Thesis (PhD), Kyoto University .
- De Vente , J. and Poesen , J. 2005 . Predicting soil erosion and sediment yield at the basin scale: scale issues and semi-quantitative models . Earth-Science Reviews , 71 ( 1–2 ) : 95 – 125 .
- Demmak, A., 1984. Recherche d'une relation empirique entre apports solides spécifiques et paramètres physico-climatiques des bassins: application au cas Algérien. In: D.E. Walling, S.S.D. Foster, and P. Wurzel, eds. Challenges in African hydrology and water resources. Wallingford: IAHS Press, IAHS Publ.144, 403–414. http://iahs.info/redbooks/a144/iahs_144_0403.pdf (http://iahs.info/redbooks/a144/iahs_144_0403.pdf) (Accessed: 18 August 2011 ).
- Frostick , L.E. , Reid , I. and Layman , J.T. 1983 . “ Changing size distribution of suspended sediment in arid-zone flash floods ” . In Modern and ancient fluvial systems , 97 – 106 . Oxford : Blackwell .
- Furnans , J. and Austin , B. 2008 . Hydrographic survey methods for determining reservoir volume . Environmental Modelling and Software , 23 ( 2 ) : 139 – 146 .
- Geiger, A.F., 1963. Developing sediment storage requirements for upstream retarding reservoirs. Federal Inter-agency Sedimentation Conference, 881–885. http://pubs.usgs.gov/misc/FISC_1947-2006/pdf/1st-7thFISCs-CD/2ndFISC/2Fisc-3.PDF (http://pubs.usgs.gov/misc/FISC_1947-2006/pdf/1st-7thFISCs-CD/2ndFISC/2Fisc-3.PDF)
- Grauso , S. 2008 . Estimating the suspended sediment yield in a river network by means of geomorphic parameters and regression relationships . Hydrology and Earth System Sciences , 12 : 177 – 191 .
- HEC . 1991 . HEC-6: Scour and deposition in rivers and reservoirs, user's manual , Davis , CA : Hydrologic Engineering Center .
- HEC . 1995 . HEC-RAS: River analysis system, user's manual , Davis , CA : Hydrologic Engineering Center .
- Heinemann , H.G. 1984 . “ Reservoir trap efficiency ” . In Erosion and sediment yield: some methods of measurement and modelling , Edited by: Hadley , R.F. and Walling , D.E. 201 Norwich : GeoBooks .
- Horowitz , A.J. 2002 . “ The use of rating (transport) curves to predict suspended sediment concentration: a matter of temporal resolution ” . In Turbidity and Other Sediment Surrogates Workshop Reno , NV
- Horowitz , A.J. 2003 . An evaluation of sediment rating curves for estimating suspended sediment concentrations for subsequent flux calculations . Hydrological Processes , 17 : 3387 – 3409 .
- Huang , J.V. and Greimann , B.P. 2007 . User's Manual for SRH-1D (Generalized Sediment Transport for Alluvial Rivers - One-Dimensional) , Denver , CO : US Bureau of Reclamation, Technical Service Center .
- Jahani, A., 1992. Calculating the suspended sediment load of the Dez River. In: J. Bogen, D.E. Walling, and T.J. Day, eds. Erosion and sediment transport monitoring programmes in river basins. Wallingford: IAHS Press, IAHS Publ. 210, 219–224. http://iahs.info/redbooks/a210/iahs_210_0219.pdf (http://iahs.info/redbooks/a210/iahs_210_0219.pdf) (Accessed: 6 December 2010 ).
- Julien , P.Y. 2010 . Erosion and sedimentation , 2nd , Cambrigde : Cambridge University Press .
- Kassoul , M. , Abdelgader , A. and Belorgey , M. 1997 . Caractérisation de la sédimentation des barrages en Algérie . Revue scientifique de l'eau , 10 ( 3 ) : 339 – 358 .
- Khanchoul , K. 2012 . Estimation of suspended sediment transport in the Kebir drainage basin, Algeria . Quaternary International , 262 ( WAQUA special issue ) : 25 – 31 .
- Khanchoul , K. and Jansson , M.B. 2008 . Sediment rating curves developed on stage and seasonal means in discharge classes for the Mellah Wadi, Algeria . Geografiska Annaler: Series A, Physical Geography , 90 ( 3 ) : 227 – 236 .
- Khanchoul , K. , Jansson , M.B. and Lange , J. 2007 . Comparison of suspended sediment yield in two catchments, northeast Algeria . Zeitschrift für Geomorphologie , 51 ( 1 ) : 63 – 94 .
- Khanchoul , K. and Remini , B. 2009 . Regressions on monthly stream discharge to predict sediment inflow to a reservoir in Algeria . Journal of Geography and Geology , 2 ( 1 ) : 37 – 47 .
- Lasdon , L.S. and Waren , A.D. 1982 . GRG2 user's guide , Austin , TX : University of Texas at Austin, School of Business Administration, Department of General Business .
- MacArthur , R.C. , Hamilton , D. and Gee , D.M. 1995 . Application of methods and models of prediction of land surface erosion and yield , Davis , CA : Hydrologic Engineering Center, Training document .
- Meddi, M., Khaldi, A., and Meddi, H., 1998. Contribution à l’étude du transport solide en Algérie du nord. In: W. Summer, E., Klaghofer and W. Zhang, eds. Modelling soil erosion, sediment transport and closely related hydrological processes. Wallingford: IAHS Press, IAHS Publ. 249, 393–397. http://iahs.info/redbooks/a249/iahs_249_0393.pdf (http://iahs.info/redbooks/a249/iahs_249_0393.pdf) (Accessed: 9 September 2011 ).
- Molinas , A. and Yang , C.T. 1986 . Computer Program User's Manual for GSTARS , Denver , CO : US Bureau of Reclamation Engineering and Research Center .
- Morris , G.L. and Fan , J. 1998 . Reservoir sedimentation handbook , New York , NY : McGraw-Hill .
- Olesen , K.W. , Refsgaard , A. and Haveno , K. 2000 . “ Restoring river ecology ” . In New trends in water and environmental engineering for safety and life , Taylor & Francis .
- Remini , B. and Avenard , J.M. 1998 . Evolution de l'envasement dans la retenue du barrage de Foum El Gherza . Bulletin du Réseau Erosion , 18 : 98 – 105 .
- Remini , B. , Avenard , J.M. and Kettab , A. 1997 . The technical of the evacuation dam Algerian . Technique Sciences et Méthodes , 2 : 69 – 76 .
- Remini , B. and Hallouche , W. 2005 . Prévision de l'envasement dans les barrages du Maghreb . Larhyss Journal , 4 : 69 – 80 .
- Rowan , J.S. , Goodwill , P. and Greco , M. 1995 . Temporal variability in catchment sediment yield determined from repeated bathymetric surveys: Abbeystead Reservoir, U.K . Physics and Chemistry of the Earth , 20 ( 2 ) : 199 – 206 .
- Singh , K.P. and Durgunoglu , A. 1990 . An improved methodology for estimating future reservoir storage capacities: Application to surface water supply reservoirs in Illinois , Champaign , IL : Division of Water Resources, Illinois Department of Transportation .
- Snyder , N.P. 2004 . Estimating accumulation rates and physical properties of sediment behind a dam: Englebright Lake, Yuba River, northern California . Water Resources Research , 40 ( 11 ) : W11301
- Terfous , A. , Megnounif , A. and Bouanani , A. 2001 . Etude du transport solide en suspension dans l'Oued Mouilah (Nord Ouest Algérien) . Revue des Sciences de l'Eau , 14 ( 2 ) : 173 – 185 .
- Tixeront, J., 1960. Débit solide des cours d'eau en Algérie et en Tunisie. General Assembly of Helsinki. Wallingford: IAHS Press, IAHS Publ. 53, 26–42. http://iahs.info/redbooks/a053/053004.pdf (http://iahs.info/redbooks/a053/053004.pdf) (Accessed: 10 January 2011 ).
- Touaibia , B. 2001 . Temporal quantification and variability of sediment discharge in a semiarid area in northern Algeria . Hydrological Sciences Journal , 46 ( 1 ) : 41 – 53 .
- USBR (US Bureau of Reclamation) . 2006 . Erosion and sedimentation manual , US Department of the Interior, Bureau of Reclamation, Technical Service Center, Sedimentation and River Hydraulics Group .
- Walling , D. 1977a . Assessing the accuracy of suspended sediment rating curves for a small basin . Water Resources Research , 13 ( 3 ) : 531 – 538 .
- Walling, D.E., 1977b. Limitations of the rating curve technique for estimating suspended sediment loads, with particular reference to British rivers. In: Erosion and solid matter transport in inland waters. Wallingford: IAHS Press, IAHS Publ. 122, 34–48. http://iahs.info/redbooks/a122/iahs_122_0034.pdf (http://iahs.info/redbooks/a122/iahs_122_0034.pdf) (Accessed: 22 December 2010 ).
- White , P. , Butcher , D.P. and Labadz , J.C. 1997 . Reservoir sedimentation and catchment sediment yield in the Strines catchment, UK . Physics and Chemistry of the Earth , 22 ( 3–4 ) : 321 – 328 .