Abstract
Tile drainage influences infiltration and surface runoff and is thus an important factor in the erosion process. Tile drainage reduces surface runoff, but questions abound on its influence on sediment transport through its dense network and into the stream network. The impact of subsurface tiling on upland erosion rates in the Le Sueur River watershed, USA, was assessed using the Water Erosion Prediction Project (WEPP) model. Six different scenarios of tile drainage with varying drainage coefficient and management type (no till and autumn mulch-till) were evaluated. The mean annual surface runoff depth, soil loss rate and sediment delivery ratio (SDR) for croplands, based on a 30-year simulation for the watershed with untiled autumn mulch-till (Scenario 1), were estimated to be 83.5 mm, 0.27 kg/m2 and 86.7%, respectively; on no-till management systems (Scenario 4), the respective results were 72.3 mm, 0.06 kg/m2 and 88.2%. Tile drains reduced surface runoff, soil loss and SDR estimates for Scenario 1 by, on average, 14.5, 8.1 and 7.9%, respectively; and for Scenario 4 by an estimated 31.5, 22.1 and 20.2%, respectively. The impact of tile drains on surface runoff, soil loss and SDR was greater under the no-till management system than under the autumn mulch-till management system. Comparison of WEPP outputs with those of the Soil Water Assessment Tool (SWAT) showed differences between the two methods.
Editor Z.W. Kundzewicz
Citation Maalim, F.K. and Melesse. A.M., 2013. Modelling impacts of subsurface drainage on surface runoff and sediment yield in the Le Sueur Watershed in Minnesota, USA. Hydrological Sciences Journal, 58 (3), 570–586.
Résumé
Le drainage influence l'infiltration et le ruissellement de surface et est donc un facteur important dans le processus d’érosion. Le drainage par drains enterrés réduit le ruissellement de surface, mais les questions abondent sur son influence sur le transport des sédiments à travers son réseau dense et dans le réseau hydrographique. Nous avons évalué l'impact de la pose de drains enterrés sur les taux d’érosion de surface dans le bassin versant de la rivière Le Sueur, aux Etats-Unis, à l'aide du modèle Water Erosion Prediction Project (WEPP). Six scénarios différents de drainage avec un coefficient de drainage et un type de gestion (culture sans labour et labour du paillis en automne) variables ont été évalués. En se basant sur une simulation de 30 ans en considérant le bassin versant avec labour du paillis d'automne et sans drainage (Scénario 1), nous avons évalué la hauteur moyenne annuelle du ruissellement de surface, le taux de perte de sol et le taux d'export de sédiments (TES) pour les terres cultivées respectivement à 83,5 mm, 0,27 kg/m2 et 86,7%. Sur des systèmes de gestion sans labour (Scénario 4), les résultats étaient respectivement de 72,3 mm, 0,06 kg/m2 et 88,2%. Les drains ont réduit les estimations de ruissellement de surface, perte de sol et TES pour le Scénario 1, en moyenne, de 14,5, 8,1 et 7,9%, respectivement, et pour le Scénario 4, de 31,5, 22,1 et 20,2%, respectivement. L'impact des drains sur le ruissellement de surface, l’érosion et le TES était plus grand dans le cas du système de gestion sans labour que dans celui avec labour du paillis d'automne. La comparaison des sorties du modèle WEPP avec celles du Soil Water Assessment Tool (SWAT) a montré des différences entre les deux méthodes.
INTRODUCTION
Tile drainage influences infiltration and runoff and is consequently an important factor in the erosion processes. It reduces surface runoff but questions abound on its influence on sediment transport through its dense network and into the stream network. Tile drainage is practiced to remove excess water from the subsurface of soil intended for agriculture. Excessive subsurface water can adversely affect root development, thus affecting plant growth and development. It also limits access to the land, particularly by farm machinery and promotes soil compaction. Tile drains have been shown to shorten nutrient discharge pathways in a watershed, effectively reducing denitrification capacity, leading to increased delivery of diffuse nitrogen into rivers (Behrendt et al. Citation2000, Amatya Citation2004, Hirt et al. Citation2005). Tiles have also been shown to increase peak flows and have gained recognition for their influence in the development of floodwaters (Wesström et al. Citation2000, Wiskow and van der Ploeg Citation2003). Ditches enhance internal drainage and are significant sediment sources, particularly when their soils are exposed because of under-vegetation of the ditch banks. Sediment transport rates from basins following flood events have been observed to be more than 100 times greater with the presence of forest ditches than they are without forest ditches (Painter et al. Citation1974).
Various studies on the impact of surface and subsurface drainage on the fluxes of water, sediment and nutrients have been reported (Skaggs et al. Citation1994, Citation2005, Robinson and Rycroft Citation1999, Dinnes et al. Citation2002, Frankenberger et al. Citation2007, Blann et al. Citation2009, Sands et al. Citation2008, Thorp et al. Citation2008). Impacts of artificial drainage on runoff are always associated with modifying otherwise natural flow paths. There have been numerous studies on tile drainage, and various modelling approaches have been proposed such as the classical Hooghoudt equation (Hooghoudt Citation1940), Kirkham equation (Kirkham Citation1958), Ernst equation (Ernst Citation1956), Richards equation (Ahmad et al. Citation1991, Fipps and Skaggs Citation1991) and the Laplace or Boussinesq equations (Bouarfa and Zimmer Citation2000). However, these equations are applicable at field scale and require the exact locations of the tile drains, which are not often available and, moreover, how their effects are scaled up to the watershed level is also not well quantified. Different attempts have been made to integrate artificially drained systems into hydrological models using mass balance equations in TOPMODEL (Kim and Delleur Citation1997), or discretized partial differential equations of mass momentum and energy conservation, or with empirically determined equations as in MIKE-SHE (DHI Citation2000) using the empirical water table height–drainage flow relationship and a similar approach was used by Purkey et al. (Citation2004). Nangia et al. (Citation2010) used the Sediment Nutrient Assessment Program (SNAP), a functionally distributed model which uses Geographic Information System (GIS)-based methodology employing the commonly used Revised Universal Soil Loss Equation (RUSLE) to estimate the amount of erosion that can occur in the study area and a flux model for estimating the sediment transport. They found that the GIS-based application was promising in simulating sediment flux. Schilling and Helmers (Citation2008) used a hydrograph analysis and compared model simulation output and field monitoring from tile-drained watersheds to understand the effect of drainage tiles on stream baseflow and streamflow recession characteristics using DRAINMOD. The results showed that recession curves from tile-drained watersheds appear to be more linear than less-tiled watersheds although comparative results of the recession index were inconsistent. Jones et al. (Citation2008) applied a physically-based, three-dimensional model that fully integrates surface and variably-saturated subsurface flow processes to the 75 km2 Laurel Creek watershed within the Grand River basin in Southern Ontario, Canada to assess the ability of the model in simulating surface and subsurface hydrodynamic processes at the watershed scale. Their findings indicate that the model successfully reproduced the observed surface runoff. Carlier et al. (Citation2007) incorporated drainage systems into large-scale hydrological models using an equivalent representation of drains buried in a soil profile by using a homogeneous anisotropic porous medium without drains. Comparisons of this approach with others, which represent tile drains using the SWMS 3D code that solves the Richards equation, gave satisfying results for global water outflow and mean water table elevation.
Other approaches include the use of models capable of simulating water and sediment flux at the field and watershed scales. One such is the Water Erosion Experiment Project (WEPP) model, a process-based semi-distributed parameter, continuous model founded on the fundamentals of hydrology, erosion mechanics, plant growth and open channel hydraulics (Flanagan et al. Citation1995). WEPP has both a hillslope and a watershed version and can be used to model spatial and temporal distributions of net soil loss and sediment deposition along a hillslope or across a watershed on an event or a continuous basis (Flanagan and Nearing Citation1995). The WEPP model has been applied to various regions of the world for quantifying sediment yield and runoff from agricultural and forested areas (Ghidey and Alberts Citation1996, Huang et al. Citation1996, Cochrane and Flanagan Citation1999, Citation2003, Schröder Citation2000, Tiwari et al. Citation2000, Yu et al. Citation2000, Zeleke Citation2001, Pieri et al. Citation2007, Pandey et al. Citation2009, Defersha and Melesse 2011). In an agricultural watershed in Western Oregon, a subsurface drainage system reduced surface runoff and sediment yield by 65% and 55%, respectively (Istok and Kling Citation1983).
The Minnesota River basin (MRB) has been identified as a significant source of nutrient and sediment loading in the Mississippi River basin (Antweiler et al. Citation1995). The MRB was historically covered with wetlands, but when European settlers arrived in 1830, the landscape drastically altered. Since that time, settlers have cleared prairie and forest, and drained the wetlands to farm the rich, productive soils. In the prairie region of Minnesota, the wetlands have been drained via a system of ditches in order to develop them into productive agricultural lands (Tester Citation1995). Almost all the farm fields have artificial drainage, either as subsurface tile drainage or ditches or both. The depths, densities and drainage capacities of these systems have been on the increase since their establishment (Water Resources Center Citation2000).
In order to reduce erosion to the tolerable rate and alleviate the water quality problem of the basin, sound conservation structures may need to be designed in the upstream. However, this may in turn require quantifying of the current rate of erosion and identifying potential sediment source areas. Considering this, the study reported in this paper has the objective of: (a) determining susceptibility of overland flow elements (OFEs, also referred to as hillslopes) to erosion and their estimated sediment yields and runoff fluxes using the WEPP model, (b) comparing sediment yields and runoff fluxes and assessing erosion susceptibility of agricultural lands with/without subsurface drainage systems, and (c) analysing the results and identifying the hotspots for erosion within the agricultural fields of the watershed.
Determining the sediment yield from the uplands is the key objective of the study as it can serve as an input for the watershed's sediment budget. To fulfil these objectives, accurate predictions of the potential erosion and sediment contribution of the agricultural uplands is important to constrain their contribution to the total sediment budget. This requires a simulation model that will integrate the different factors that govern the erosion process and covers both spatial and temporal variations. A process-based model is appropriate for such a study, overcoming many limitations on model input parameters and spatial scale. This study will thus be an important contribution to the development of the sediment budget, as well as evaluation of watershed management actions and targeting of Best Management Practices (BMPs).
SOIL EROSION MODELLING AND WEPP
Soil erosion modelling
The choice of model depends basically on the desired information and the data available for the area of study. Process-based models offer several advantages over empirical models. These include: (a) ability to estimate spatial and temporal distributions of net soil loss, (b) more accurate extrapolation to ungauged sites, and (c) an enhanced ability to predict sediment yield including particle size information. The WEPP model (Flanagan et al. Citation1995) is ideal for this study because of its demonstrated capabilities as a process-based model as well as its ability to simulate events over a wide variety of spatial and temporal scales. It incorporates site-specific input data (such as STATSGO soil types) and is also capable of simulating the effect of subsurface drainage on watershed hydrology.
WEPP model
Soil erosion prediction models are useful tools in assessing the impacts of land-use changes and land management on sediment dynamics. WEPP has several components that determine the response of soil to the eroding agent, water. These components are: weather generation, winter processes, irrigation, infiltration, overland flow hydraulics, water balance, plant growth, residue decomposition, soil parameters, hillslope erosion and deposition, watershed channel hydrology and erosion processes, and the watershed impoundment component. These components are essential to simulate the mechanisms that dictate the detachment, entrainment and transport, and the deposition of soil within a catchment or at the field scale.
The WEPP model uses a climate component, Climate Generator (CLIGEN) (Nicks et al. Citation1995) that generates important parameters that are used to determine the effect of climatic input on the soil erosion process. These include mean daily values for precipitation, minimum and maximum temperatures, wind velocity and solar radiation.
The climate component also includes a disaggregation model that uses daily rainfall amounts to generate a time–rainfall intensity data set that is an essential input for determining rainfall excess and thus runoff in the infiltration component of the WEPP model.
Winter processes are important because they alter soil properties. Soil rapidly weakens during thawing and the susceptibility of such soils to erosion increases if precipitation immediately follows surface thawing (Kok and McCool Citation1990). The freeze–thaw processes affect soil cohesive strength and increase soil erodibility (Formanek et al. Citation1984) and severe erosion from such unconsolidated soil may result even from low intensity rainfall and saturation excess runoff (Van Klaveren and McCool Citation1998). The WEPP model simulates the development of frost and thaw, accumulation of snow and the melting of snow using hourly temperature, radiation and snow fall values generated from their respective daily values, and makes appropriate adjustments to infiltration and soil erodibility parameters.
Infiltration and subsurface drainage rainfall duration and intensity represent the driving forces of water induced erosion. Runoff in the hillslope version of WEPP is calculated by a Green-Ampt Mein-Larson (GAML) infiltration equation. The equation is a time-based physical model whose infiltration parameters are directly related to the catchment characteristics (Wilcox et al. Citation1990). The infiltration rate is expressed by:
Another important component is the subsurface drainage. Poorly drained soils in humid areas are found usually close to the land surface and this retards infiltration thereby increasing runoff and soil loss. Decreases in surface runoff and soil loss have been reported when subsurface drainage was enhanced (Skaggs et al. Citation1982).
In WEPP, the algorithm that simulates this subsurface flow draws extensively from DRAINMOD (Skaggs Citation1978) and it assumes flow in the saturated zone only. On any given simulation day, drainage flux is calculated using the following equation:
Soil parameters Soil properties influence fundamental processes in the erosion process. Soil detachment, infiltration and surface runoff, and sediment entrainment and deposition are all dependent on inherent soil properties (Alberts et al. Citation1995) and these properties have been shown by many studies to exert their influences on soil erodibility with varying effectiveness in different situations (Breshears et al. Citation2003). The soil component of the WEPP model is basically composed of soil detachment and hydrology parameters. Soil hydrology parameters predicted in this component are random roughness, ridge height, bulk density and effective hydraulic conductivity. These properties affect other model components, primarily infiltration, and are also influenced by land management practices. The soil detachment parameters are inter-rill erodibility (K i) and rill erodibility (K r). Inter-rill erodibility is a measures how well a soil can resist detachment by raindrop impact while rill erodibility represents a soils resistance to detachment by concentrated rill flow.
Rill and inter-rill erosion Soil erosion models usually partition hillslope erosion into rill flow and inter-rill mechanisms (Lal Citation1988). Inter-rill erosion involves the detachment of soil particles by rain splash and its subsequent transport by broad, shallow surface flow. WEPP, like many other erosion models regards inter-rill sediment yield as a function of rainfall intensity and computes it as follows:
Rill erosion involves the detachment and transport of soil by a concentrated flow in a streamlet and is described in WEPP by a steady-state sediment continuity equation as follows:
The rill erosion is obtained using the following equation:
METHODS
Study area
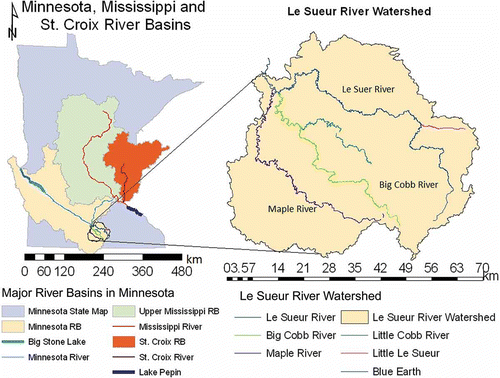
The Le Sueur watershed () has been identified as one of the most important sources of sediment for the Minnesota River. Despite its area of 2880 km2 comprising only 6.56% of the total MRB area, it contributes an estimated 24–30% of the total suspended solids (TSS) delivered to the Minnesota River (MPCA Citation2007). It is located in south central Minnesota and is one of the 12 major watersheds that make up the MRB. It is drained by the Le Sueur River and its tributaries, the Maple and Cobb Rivers. The Le Sueur River drains north and finally west to the Minnesota River (). Soils of the watershed are predominantly glacial till plains. Landscapes within this till plain are characterized as being a complex mixture of gently sloping (2–6%) well drained loamy soils and nearly level (0–2%) poorly drained loamy soils (USDA-NRCS Citation2011). The highest elevation within the watershed is 343 m a.s.l. (1126 feet) located in the eastern and southeastern portions of the watershed, and the lowest elevation is in the central and western regions approaching the Minnesota River valley. The annual average precipitation in the watershed ranges from 74 to 84 mm (29 to 33 inches). Most land within this watershed is located on flatter topography, well to moderately well suited to agricultural uses.
Table 1 Profiles of weather recording stations whose data were used in the study and intersection of Thiessen polygons with study area
Fig. 1 Location of the Le Sueur River watershed.
WEPP input data preparation
Hillslope profile Channel network delineation in Geospatial interface of WEPP (GeoWEPP) is based on the steepest slope path. The TOPAZ program uses the D8 method, considering the eight adjacent pixels of each raster cell and the critical source area (CSA) concept (Garbrecht and Martz Citation1997). The CSA concept defines the minimum area that potential upslope catchment areas must have to be able to act as a channel source or initiate an exterior link. Another threshold value, the minimum source channel length (MSCL) is set to determine which of the existing source channels or exterior links will be permitted in the drainage network.
With these considerations, a stream network layer of the Le Sueur River watershed obtained from the Minnesota River Basin Data Center (MRBDC) was compared visually with TOPAZ generated drainage networks using a number of different combinations of CSA and MSCL limits. A combination of 50 ha for the CSA and 1000 m for the MSCL was used as this presented the closest match of all the combinations tested.
Climate file Climate data for the study area were obtained from archives maintained by the National Climatic Data Centre (NCDC). Stations in or near the study area and with 30 or more years of daily data were selected and their data acquired for further processing. The stations are part of the National Weather Service's Cooperative Station Network (NWS-CSN). Maximum and minimum daily temperatures and precipitation depths are required as model inputs and these were acquired for the period 1 January 1979 to 31 December 2008 for each one of the four stations (). The data were analysed for completion and the identified missing data points (<1%) were filled using their respective long-term mean values.
The completed data sets were then used to create a new climate file consisting of areal averages. A point GIS layer was created using the geographical locations of the stations and these were then used to construct Thiessen polygons to determine areal weights for each station used. These weights were then used to calculate the Thiessen areal averages for each one of the three inputs and for each day. The resulting climate file was uploaded into WEPP and processed by the model climate generator, CLIGEN (Nicks et al. Citation1995), to create a 100-year climate file.
Management file Land-use/land-cover maps for the study area were obtained for the most recent period. The present land-use/land-cover map used for this study was the Cropland Data Layer (CDL) from 2007, available at the time of model set up. This was the 2007 CDL produced by the USDA's statistical branch, the National Agricultural Statistical Survey (NASS). Remotely sensed data were acquired from the Advanced Wide Field Sensor (AWiFS) housed in the Indian Space Research Organizations IRS-P6 (RESOURCESAT-1) satellite. The sensor has a 56-m resolution and revisits the same area every ∼5 days. The Spatial Analysis Research Section (SARS) of NASS collects AWiFS data throughout the year and accessorizes the CDL classification process with data from the Moderate-Resolution Imaging Spectroradiometer (MoDIS) (USDA-NASS 2008). The major land use types according to the 2007 land-cover map are corn (43.5%) and soybeans (30%). Other land uses include developed areas (9%), grasslands (4.9%), wetlands (4.1%) and forest cover (3.5%).
Soil file The soil map for the study area was obtained from the US General Soil Map (STATSGO2) for Minnesota. shows key properties pertaining to erodibility of the soils in the study area as determined by the WEPP model using soil survey information and in-built parameter estimation components.
Table 2 Properties of soils within the Le Sueur River watershed
GeoWEPP set-up The model used for this study consists of two independent software products: WEPP Model and ArcGIS. These two products are linked via GeoWEPP. The GeoWEPP package for ArcGIS includes two tools that further expand its utility (). These are the Topographic Parameterization tool (TOPAZ) and TOPWEPP software products developed by the USDA-ARS.
Fig. 2 Flow of information between the WEPP Geo-spatial Interface and WEPP (Water Erosion Prediction Project model).
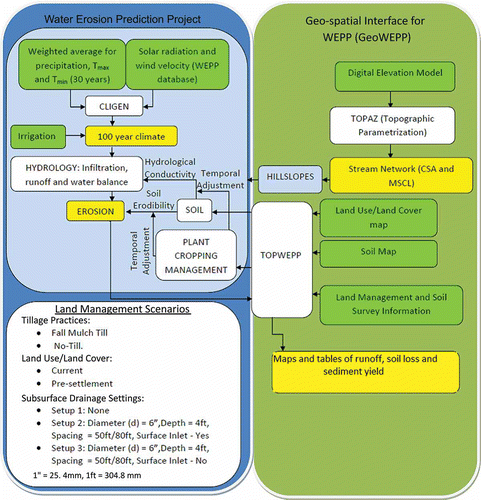
The TOPAZ tool generates hillslope profiles by parameterizing topographic data using a given DEM. The assignment of land cover and soil types to hillslopes is done by TOPWEPP which uses grid based information stored in the raster layers of the land cover and soil. The TOPWEPP program also executes the model runs and produces the output maps.
Model application
Model simulations can be performed using one of three available options: the watershed method, the flowpath method, and both watershed and flowpath methods concurrently. In the watershed method, the hillslope is the unit of interest. For each hillslope, all possible flowpaths are used to generate a single representative slope profile and the major soil type and land-cover types are applied to the whole hillslope. This method reports the total runoff, soil loss, soil deposition and sediment yield of each hillslope in the sub-catchment. In the flowpath method, every flowpath is considered as an overland flow element and each retains its unique slope profile. The soil and land-use/land-cover type in every section of the flowpath is maintained, thus conserving spatial heterogeneity. Unlike the hillslope-based watershed method, there is no limit on the number of flowpaths that a single model run can accommodate. This method only reports soil loss and soil deposition within the flow paths. Each of the methods has its benefits depending on desired outputs.
Table 3 Scenarios and modifications in model input parameters for different simulations
However, the watershed method was applied here because it serves the objectives of this study. The flowpath method provides more insight into erosion hotspots within a hillslope but is a much more memory intensive simulation and is preferred for analysing on-site erosion dynamics on smaller scales.
The model was thus run using the watershed method for a simulation period of 30 years using the climate file created in WEPP. The TOPWEPP component of GeoWEPP maps the 30-year mean sediment yield outputs using a Tolerable Soil Loss scheme. Soil loss tolerance as a parameter is not uniform for the different soils of a watershed or even for the same soil under different managements, but the default soil loss tolerance of 1 t ha−1 year−1 (0.1 kg m−2) was applied uniformly to map sediment yield across the watershed in order to identify the areas with the highest sediment yield rates.
Table 4 Mean annual value in surface runoff, mean annual soil loss rate, sediment yield and sediment delivery ratio for the six scenarios at the watershed level
SCENARIOS
The impacts of subsurface drainage systems on farmlands under specific tillage practices were explored by determining their effects on runoff generation, soil loss and sediment yield. Model simulations were run by appropriately modifying model input parameters to reflect these specific conditions (). The land-use/land-cover management files were edited in the WEPP model to include subsurface drainage in the management of agricultural lands. Drainage parameters specified include the drainage coefficient, depth to tile, tile diameter and tile spacing. The drainage coefficient describes the desired quantity of water removed on a daily basis and is usually expressed as depth per 24 hours (mm d−1). The drainage coefficients used were based on figures from the NRCS Engineering Field Handbook and were 25.4 and 12.7 mm d−1 to represent subsurface drainage systems with and without surface inlets, respectively. The other parameters were set to match those of subsurface drainage installations in a field-scale drainage water quality demonstration site maintained by the Minnesota Department of Agriculture (MDA) and are as described in .
RESULTS
The results of the simulations presented in this paper include surface runoff, soil loss and sediment yield under the different subsurface drainage scenarios.
Surface runoff
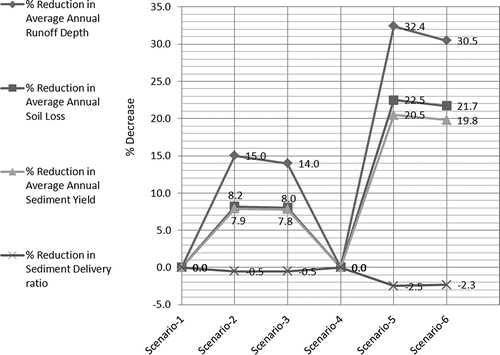
The average annual surface runoff depth for the watershed under Scenario 1 (Till and no tile drains) () was 83.5 mm. The depth of surface runoff estimated varied in time and space depending on the individual slope profiles of hillslopes, their soil and land-use/land-cover types. As depicted in , the depth of runoff estimated for the watershed under scenarios 2 and 3 (both with till and tile drains) were 70.9 mm and 71.8 mm, respectively. These runoff depths represent reductions of 15% and 14%, respectively when compared with Scenario 1. The surface runoff depths under scenarios 5 and 6 (both with no till and with tile drains) were 48.9 mm and 50.3 mm, respectively, corresponding to decreases of 32.4% and 30.5% when compared to the 72.3 mm depth reported for Scenario 4. The difference is attributed to the effect of tillage operation, which can increase overland flow, unlike no-till types of field management. shows the spatial map of runoff for the different scenarios. Scenarios 4, 5 and 6 (no tills) have shown a reduction in surface runoff compared to scenarios 2, 3 and 4 (till operations).
Table 5 Effect of subsurface drainage on surface runoff depth, runoff coefficient, soil loss, sediment yield and sediment delivery ratios on a land-use basis
Fig. 3 Annual surface runoff depth under scenarios 1, 2, 3, 4, 5 and 6.
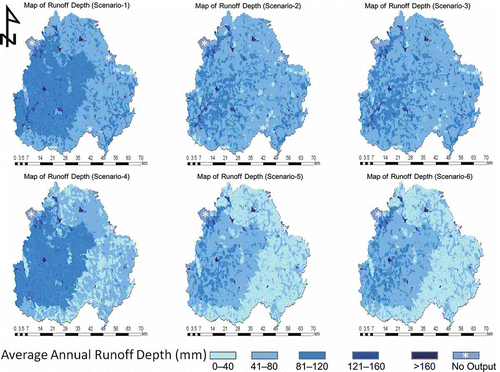
shows the impact of the tile drains on the agricultural areas only while shows the watershed-scale effect of the tile drains.
Soil loss
Soil loss is the amount of onsite detachment of soil material from a location by the action of an eroding agent. The average annual total soil loss for the entire watershed under Scenario 1 was 735 000 t, approx. 0.27 kg m2 (2.7 t ha−1). As described above, the presence of tile drains and their design affect the depth of surface runoff in agricultural lands. Because surface runoff is the most important component in the erosion process, an increase in this parameter has a direct effect on soil loss, if other variables remain constant. Attributed to this, soil loss rates were noticeably lower in plots when tile-drains were installed as opposed to their un-tiled state. Soil loss rates under scenarios 2 and 3 represent reductions of 8.0% when compared with Scenario 1.
Sediment yield
Sediment yield (the amount of eroded material delivered to an offsite location by an eroding agent) from an area is always less than the amount of soil loss and the actual amount varies with topography, land-use/land-cover and the presence or absence of conservation structures. Under Scenario 1, an average 620 000 t of soil is delivered from uplands to streams while an estimated 115 000 t is deposited within the uplands. The sediment delivery ratio (SDR), the fraction of soil loss transported out of the uplands, was found to be approximately 0.87. Based on the observed total suspended sediment (TSS) data, it was found that the 2010 TSS value was 544 000 t.
Average sediment yield rates and SDRs for the watershed under Scenario 1 were 0.23 kg m−2 and 0.87 while the average sediment yield rates and SDRs under the drained scenarios (2 and 3) were 0.21 kg m−2 and 0.87. The difference of the drainage coefficient under scenarios 2 and 3 did not show any measurable difference in the sediment yield as well as the soil loss and surface runoff (, and ). For Scenario 4, the mean sediment yield rates and sediment delivery ratios for the watershed were 0.05 kg m−2 and 0.88 while the average sediment yield rates and SDRs under the drained scenarios were 0.04 kg m−2 and 0.9 for Scenario 5 and 0.04 kg m−2 and 0.9 for Scenario 6. shows the spatial map of sediment yield for the different scenarios, indicating the effect of till management under tiled drains on the increase of sediment yield. This was also observed for surface runoff and soil loss from and , respectively. shows the summary of the trends in surface runoff, soil loss, sediment yield and SDR for the six scenarios at the watershed scale. It is shown that scenarios 1 and 4, both untiled, are similar in their effect on runoff, soil loss, sediment yield and SDR compared to scenarios 2, 3, 5 and 6, which are tiled (Fig. 6).
Fig. 5 Annual sediment yield under scenarios 1, 2, 3, 4, 5 and 6.
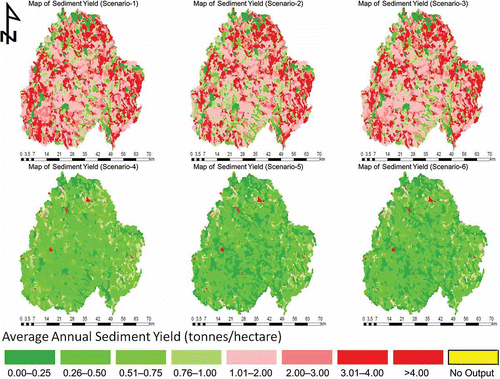
Fig. 4 Annual soil loss depth under scenarios 1, 2, 3, 4, 5 and 6.
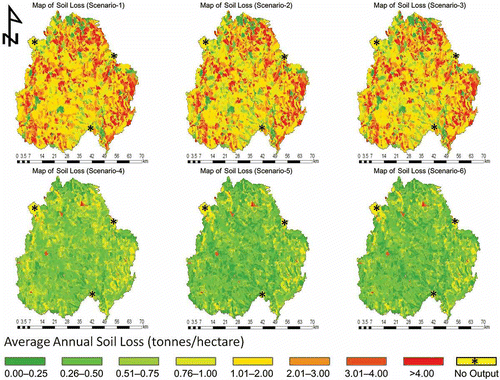
Fig. 6 Effects of subsurface drainage and land management on average annual runoff depth, soil loss, sediment yield and sediment delivery ratio under the different scenarios.
Land-use and land-management effect
The results obtained through this study show that surface runoff fluxes, soil loss and sediment yield rates vary with land use/land cover as well as land management practices. Urban/developed areas produced the greatest amount of surface runoff in the simulations (193.6 mm) due to their impermeability. Forested areas had a mean surface runoff of 113.6 mm and this was greater than that of grasslands (76.2 mm) (). As shown in , these three land uses (urban, grassland and forest) remained unchanged for all scenarios because they were not subjected to any management practices (tiles and tillage) unlike the agricultural lands. For the agricultural lands, scenarios 1 and 4 had the greatest surface runoff amounts, 82.4 and 71.3 mm, respectively (). These results suggest that no tillage (Scenario 6) produces less surface runoff than autumn mulch-tillage (Scenario 1) and that subsurface drains indeed reduce surface runoff (scenarios 2, 3, 5 and 6).
Urban/developed areas also produced the greatest amount of soil loss in the simulations (0.46 kg m−2). The WEPP model was primarily designed for agricultural areas and modelling of impervious and non-erodible materials is not well accommodated. Thus, this figure is grossly misleading. While forests had the second highest mean surface runoff depth, their mean soil loss rate (0.08 kg m−2) was greater than the simulated soil loss for grasslands (0.01 kg m−2) and agricultural areas under scenarios 4, 5, and 6. Grasslands had the least predicted soil loss despite having a higher mean surface runoff depth than the agricultural fields, except for Scenario 1. For the agricultural lands, Scenario 1 had the greatest soil loss amount (0.29 kg m−2). It was followed 0.26 kg/m2 for scenarios 2 and 3, 0.05 kg m−2 for Scenario 4 and 0.04 kg m−2 for scenarios 6 and 5 (). The soil loss trend was very similar to the surface runoff trend for all the scenarios for the agricultural areas.
SDR was lowest for the grasslands (70.36%) and highest for the urban/developed areas (98.1%). For forests (84.1%), the SDR was comparable to that of scenarios 1, 2 and 3, which were 84.2%, 84.4% and 84.4%, respectively. Scenarios 4, 5, and 6 had SDRs of 87.9%, 90.3% and 90.1%, respectively. The trend in SDR seems to be in complete contrast with that in surface runoff, soil loss and sediment yield for scenarios 1 through 6.
DISCUSSION
In this section, comparisons and effect of the tile drainage system on the water and sediment fluxes is discussed. The findings of this study are also reviewed in comparison to other studies using WEPP and other models. Finally, comparisons of the WEPP and Soil and Water Assessment Tool (SWAT) (Arnold et al. Citation1998) surface runoff and sediment yield outputs are made.
For saturation excess type of runoff, subsurface drainage impacts runoff generation by facilitating deep percolation. The presence and type of subsurface drainage produced variations in the runoff depths reported for the model simulations. Surface runoff depths in the tile drained areas were less than those of the un-tiled plots. Various studies have used WEPP and other soil erosion models to estimate surface runoff and sediment yield under various hydrological and land management conditions. Similar to our findings, Singh et al. (Citation2011) used the WEPP model and tested its applicability in the high rainfall and steep slope conditions of eastern Himalaya using field-measured data. The calibrated and validated WEPP model was used to develop conservation strategies for agricultural sustainability.
Our study showed that the subsurface drains also seem to be more efficient at reducing surface runoff under no till management (scenarios 5 and 6) than they are under autumn mulch-tillage (scenarios 2 and 3). However, the differences in surface runoff between the scenarios with surface inlet equipped tile drains (scenarios 2 and 5) and those without the surface inlet (scenarios 3 and 6) were not large. Like that of surface runoff, the no-till scenarios (4, 5 and 6) showed less soil loss than those with till operations (1, 2 and 3). The pulverizing effect of the tillage operations can enhance the soil detachment and hence loss. The soil loss rates under scenarios 5 and 6 were 0.04 kg m−2 corresponding to decreases of 22.5% when compared to the 0.06 kg m−2 soil loss rate reported for Scenario 4. This reduction in soil loss under scenarios 5 and 6 compared to scenarios 2 and 3 could be also due to the absence of disturbance of the top soil because of the no-till operations in the former. shows the spatial map of soil loss for the different scenarios.
The observed TSS value for 2010 was found to be 544 000 t, smaller than the Scenario 1 simulated value of 620 000 t. The average observed TSS for the period 2000–2012 was even lower than the simulated values. One explanation for the discrepancy could be the inability of WEPP to simulate gully erosion. The downstream section of the watershed has networks of gullies which require a different approach for estimation of their contribution to the sediment budget. Tiled fields generally reported lower sediment delivery rates than un-tiled fields as a result of the reduced surface runoff. Another possible reason could be the delivery of sediment through the subsurface drainage system. Sediment yield rates for fields with tile-drains having surface inlets were also slightly lower than the rates reported under tile-drains without surface inlets. This calls for a closer look into the contribution of gulley areas to the overall sediment budget.
Defersha and Melesse (Citation2012) used the WEPP and EROSION 3D models to estimate sediment yield at field and watershed scales in the Mara River basin, Kenya. Their results showed that the models were capable of reproducing observed runoff and sediment values. Savabi (Citation1993) compared the model-simulated and measured storm-runoff hydrographs for pre- and post-subsurface drainage installation, and the results indicated that, in general, the model does an acceptable job of predicting storm and peak surface runoff rate for pre- and post-subsurface drainage installation. Our finding is in line with this finding that subsurface drainage scenarios reduced surface runoff and hence sediment yield, unlike untiled scenarios. In line with Schilling and Helmers (Citation2008), the results of our study have clearly demonstrated the effect of not only land management, but also subsurface drainage on the hydrology and sediment flux.
A comparison of the WEPP outputs with results of using the Soil Water Assessment Tool (SWAT) (Arnold et al. Citation1995) in a similar study in the Le Sueur watershed. Basin-wide studies on Watershed hydrology and fluvial dynamics of the Le Sueur River watershed comparable to the research using the WEPP model are very useful, especially because no observed data sets of use at this scale are available. A regression analysis of the surface runoff and sediment yield predictions of the WEPP and SWAT models for the simulation period 1994–2006 showed that WEPP accounted for approximately 45% of the variability in both surface runoff and sediment yield predictions of the SWAT model. shows the surface runoff and sediment yield predictions comparison. The index of agreement (a measure of a model's prediction strength based on the Nash-Sutcliffe Efficiency) was 0.77 and 0.70 for the surface runoff and sediment yield, respectively.
Fig. 7 Comparison of WEPP and SWAT simulations for Le Sueur watershed: (a) surface runoff and (b) sediment yield.
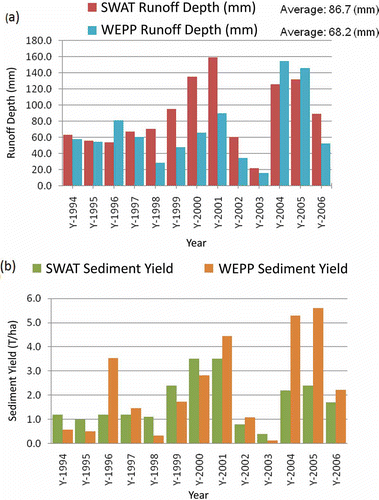
These analyses show that WEPP accounted for approx. 80% of the variability in surface runoff predictions of the SWAT model and 79% of the sediment yield predictions of the SWAT model. The indexes of agreement for these sets of data points were 0.93 and 0.56 for the surface runoff and sediment yield, respectively. These observations are consistent with some studies that have compared sediment yield prediction by the WEPP and SWAT models (Shen et al. Citation2009) as well as WEPP and USLE (Amore et al. Citation2004).
CONCLUSIONS
The effect of subsurface tile drainage and land management on surface runoff, soil loss and sediment yield was evaluated for the Le Sueur Watershed using the WEPP model. Analysis of the model simulated data showed that the presence of subsurface tile drains reduced surface runoff, soil loss and sediment yield, though the different subsurface drainage systems did not show any significant difference in drainage capacity (drainage coefficient). The reduction in surface runoff, soil loss and sediment yield was slightly higher for the tile drain systems with surface inlets but this difference was not significant. The tile drains were much more effective in reducing surface runoff, soil loss and sediment yield where the croplands were under a no-till management system. No-till systems preserve soil properties such as porosity and this serves to increase infiltration as well. The difference in surface runoff, soil loss and sediment yield data for scenarios differing in the drainage coefficient of tile drains were negligible. Tillage practices pulverize the soil increasing soil detachment and enhance the transportation of soil particles by surface runoff. The effect of tillage operations on the water and sediment fluxes was also evaluated and it was found that areas under no-till operations showed an average reduction of surface runoff, soil loss and sediment yield of 13.3%, 79.2% and 78.1%, respectively, relative to tilled areas. The effect of till was high on the soil and sediment fluxes. Analysis of the effect of land use on water and sediment flux showed that agricultural use of land increases the surface runoff, soil loss and sediment yield more than those of the forest and grassland. This effect was also higher even when tilled and tile drains were not used.
The results of the study are useful in understanding the fluxes of water and sediment under different field management conditions. The use of WEPP in evaluating the upland sediment flux needs to be verified with well recorded observed data. WEPP's capability is limited to estimating upland erosion and for watersheds like Le Sueur, estimation of the gully and river bed erosion will require different approaches.
Acknowledgements
The authors thank the National Centre for Earth-surface Dynamics (NCED), Efi Foufoula-Georgiou, Diana Dalbotten of NCED and Carrie Jennings of the Minnesota Geological Survey. We also thank the US Geological Survey, the National Agricultural Statistical Service and the Agricultural Research Service of the US Department of Agriculture (USDA-NASSS and USDA-ARS), the National Climatic Data Center (NCDC), the Minnesota River Basin Data Center (MRBDC), the Minnesota Department of Natural Resources’ (Minnesota DNR) GIS Data Deli, and the Department of Geology at the University at Buffalo for sharing their data and software that enabled the execution of this study. We extend our thanks to Patrick Belmont and Karen Gran for their support and feedback.
REFERENCES
- Ahmad , S. , Kashyap , D. and Mathur , B.S. 1991 . Numerical modelling of two-dimensional transient flow to ditches . Journal of Irrigation and Drainage, ASCE , 117 ( 6 ) : 839 – 851 .
- Alberts , E.E. 1995 . “ Soil component ” . In USDA Water Erosion Prediction Project: Hillslope profile and watershed model documentation , Edited by: Flanagan , D.C. and Nearing , M.A. West Lafayette , IN : US Department of Agriculture – Agricultural Research Service National Soil Erosion Research Laboratory (NSERL), Report No. 10 .
- Amatya , D.M. 2004 . DRAINWAT-based methods for estimating nitrogen transport in poorly drained soils . Transactions of the American Society of Agricultural Engineers , 43 ( 3 ) : 677 – 687 .
- Amore , E. 2004 . Scale effect in USLE and WEPP application for soil erosion computation from three Sicilian basins . Journal of Hydrology , 293 ( 1–4 ) : 100 – 114 .
- Antweiler , R.C. , Goolsby , D.A. and Taylor , H.E. 1995 . “ Nutrients in the Mississippi River ” . In Contaminants in the Mississippi River, 1987–92 , Edited by: Meade , R. Vol. 1133 , 73 – 86 . Denver , CO : US Geological Survey Circular .
- Arnold , J.G. 1995 . “ Plant growth component ” . In WEPP Technical Documentation , Edited by: Flanagan , D.C. and Nearing , M.A. West Lafayette , IN : WEPP Technical Documentation, NSERL Report No. 10 .
- Arnold , J.G. 1998 . Large area hydrologic modelling and assessment, Part I: Model development . Journal of the American Water Resources Association , 34 ( 1 ) : 73 – 89 .
- Behrendt , H. 2000 . Nutrient emissions into river basins of Germany , Berlin : Umweltbundesamt (UBA), Research Report 23/00 .
- Blann , K.L. 2009 . “ Effects of agricultural drainage on aquatic ecosystems ” . In Critical Reviews in Environmental Science and Technology 909 – 1001 .
- Bouarfa , S. and Zimmer , D. 2000 . Water-table shapes and drain flow rates in shallow drainage systems . Journal of Hydrology , 235 ( 3–4 ) : 264 – 275 .
- Breshears , D.D. 2003 . Wind and water erosion and transport in semi-arid shrubland, grassland and forest ecosystems: quantifying dominance of horizontal wind-driven transport . Earth Surface Processes and Landforms , 28 : 1189 – 1209 .
- Carlier , J.P. , Kao , C. and Ginzburg , I. 2007 . Field-scale modelling of subsurface tile-drained soils using an equivalent-medium approach . Journal of Hydrology , 341 : 105 – 113 .
- Cochrane , T.A. and Flanagan , D.C. 1999 . Assessing water erosion in small watersheds using WEPP with GIS and digital elevation models . Journal of Soil Water and Conservation , 54 ( 4 ) : 678 – 685 .
- Cochrane , T.A. and Flanagan , D.C. 2003 . Representative hillslope methods for applying the WEPP model with DEMS and GIS . Transactions of the American Society of Agricultural Engineers , 46 ( 4 ) : 1041 – 1049 .
- Defersha , M. and Melesse , A.M. 2012 . Field-scale investigation of the effect of land use on sediment yield and surface runoff using runoff plot data and models in the Mara River basin, Kenya . CATENA , 89 : 54 – 64 .
- 2000 . MIKE SHE water movement user manual , Hørsholm : DHI Water and Environment . DHI
- Dinnes . 2002 . Nitrogen management strategies to reduce nitrate leaching in tile drained Midwestern soils . Agronomy Journal , 94 ( 1 ) : 53 – 171 .
- Ernst , L.F. 1956 . Calculations of the steady flow of groundwater in vertical sections . Netherlands Journal of Agricultural Science , 4 : 126 – 131 .
- Fipps , G. and Skaggs , R.W. 1991 . Simple methods for predicting flow to drains . Journal of Irrigation and Drainage, ASCE , 117 ( 6 ) : 881 – 896 .
- Flanagan , D.C. and Nearing , M.A. , eds. 1995 . USDA water erosion prediction project: Hillslope profile and watershed model documentation , West Lafayette , IN : US Department of Agriculture – Agricultural Research Service National Soil Erosion Research Laboratory (NSERL), Report No. 10 .
- Flanagan , D.C. 1995 . “ Overview of the WEPP erosion prediction model. In ” . In USDA water erosion prediction project: Hillslope profile and watershed model documentation , Edited by: Flanagan , D.C. and Nearing , M.A. West Lafayette , IN : US Department of Agriculture – Agricultural Research Service National Soil Erosion Research Laboratory (NSERL), Report No. 10 .
- Formanek , G.E. , McCool , D.K. and Papendick , R.I. 1984 . Freeze-thaw and consolidation effects on strength of a wet silt loam . Transactions of the American Society of Agricultural Engineers , 27 : 1749 – 1752 .
- Frankenberger, J., et al., 2007. Drainage water management for the Midwest: questions and answers about drainage water management for the Midwest [online]. Purdue Extension Publication WQ-44, Available from:[Accessed 24 January 2011]. http://www.extension.purdue.edu/extmedia/WQ/WQ-44.pdf (http://www.extension.purdue.edu/extmedia/WQ/WQ-44.pdf)
- Garbrecht , J. and Martz , L.W. 1997 . TOPAZ: An automated digital landscape analysis tool for topographic evaluation, drainage identification, watershed segmentation and subcatchment parameterization: overview , Durant , OK : US Department of Agriculture, Agricultural Research Service, ARS-NAWQL 95-1 .
- Ghidey , F. and Alberts , E.E. 1996 . Comparison of measured and WEPP predicted runoff and soil loss for midwest claypan soil . Transactions of the American Society of Agricultural Engineers , 39 ( 4 ) : 1395 – 1402 .
- Hirt , U. , Meyer , B.C. and Hammann , T. 2005 . Proportions of subsurface drainages in large areas—methodological study in the Middle Mulde catchment (Germany) . Journal of Plant Nutrition and Soil Science , 168 : 375 – 385 .
- Hooghoudt , S.B. 1940 . General consideration of the problem of field drainage by parallel drains, ditches, watercourses, and channels. Contribution to the knowledge of some physical parameters of the soil, Publ. No. 7. Groningen: Bodemkundig Instituut (in Dutch)
- Huang , C.H. , Bradford , J.M. and Laflen , J.M. 1996 . Evaluation of the detachment transport coupling concept in the WEPP rill erosion equation . Soil Science Society of America Journal , 60 : 734 – 739 .
- Istok , J.D. and Kling , G.F. 1983 . Effect of subsurface drainage on runoff and sediment yield from an agricultural watershed in western Oregon, USA . Journal of Hydrology , 65 : 279 – 291 .
- Jones , J.P. , Sudicky , E.A. and McLaren , R.G. 2008 . Application of a fully-integrated surface-subsurface flow model at the watershed-scale: a case study . Water Resources Research , 44 : W03407 doi: 10.1029/2006WR005603
- Kim , S.H. and Delleur , J.W. 1997 . Sensitivity analysis of extended TOPMODEL for agricultural watersheds equipped with tile drains . Hydrological Processes , 11 : 1243 – 1261 .
- Kirkham , D. 1958 . Seepage of steady rainfall through soil into drains . Transactions of the American Geophysical Union , 39 : 892 – 908 .
- Kok , H. and McCool , D.K. 1990 . Quantifying freeze/thaw-induced variability of soil strength . Transactions of the American Society of Agricultural Engineers , 33 : 501 – 506 .
- Lal , R. 1988 . Soil erosion research methods , Ankeny, IA : Soil & Water Conservation Association .
- MPCA (Minnesota Pollution Control Agency) . 2007 . State of the Minnesota River: summary of surface water quality monitoring, 2000–2005 , St. Paul : MPCA .
- Nangia , V. , Wymar , P. and Klang , J. 2010 . Evaluation of a GIS-based watershed modelling approach for sediment transport . International Journal of Agricultural and Biological Engineering , 3 ( 3 ) : 43 – 53 .
- Nicks , A.D. , Lane , L.J. and Gander , G.A. 1995 . “ Weather generator ” . In USDA Water Erosion Prediction Project: Hillslope profile and watershed model documentation , Edited by: Flanagan , D.C. and Nearing , M.A. West Lafayette , IN : US Department of Agriculture – Agricultural Research Service National Soil Erosion Research Laboratory (NSERL), Report No. 10 .
- Painter , R.B. 1974 . “ The effect of afforestation on erosion processes and sediment yield ” . In Effects of man on the interface of the hydrological cycle with the physical environment , Vol. 113 , 150 – 157 . Wallingford : IAHS Press. IAHS Publ .
- Pandey , A. 2009 . Application of the WEPP model for prioritization and evaluation of best management practices in an Indian watershed . Hydrological Processes , 23 : 2997 – 3005 .
- Pieri , L. 2007 . Using the Water Erosion Prediction Project (WEPP) model to simulate field-observed runoff and erosion in the Apennines mountain range, Italy . Journal of Hydrology , 33 : 84 – 97 .
- Purkey , D. 2004 . Describing near surface, transient flow processes in unconfined aquifers below irrigated lands: model application in the western San Joaquin Valley, California . Journal of Irrigation and Drainage Engineering , 130 ( 6 ) : 451 – 459 .
- Robinson , M. and Rycroft , D.W. 1999 . The impact of drainage on stream flows . Agronomy Monographs , 38 : 767 – 800 .
- Sands , G.R. 2008 . The effects of subsurface drainage depth and intensity on nitrate loads in the northern cornbelt . Transactions of the American Society of Agricultural and Biological Engineers , 51 ( 3 ) : 937 – 946 .
- Savabi , M.R. 1993 . Modelling subsurface drainage and surface runoff with WEPP . Journal of the Irrigation and Drainage Engineering Division, ASCE , 119 ( 5 ) : 801 – 813 .
- Schilling , K. E. and Helmers , M. 2008 . Effects of subsurface drainage tiles on streamflow in Iowa agricultural watersheds: Exploratory hydrograph analysis . Hydrological Processes , 22 : 4497 – 4506 .
- Schröder , A. 2000 . “ WEPP, EUROSEM, E-2D results of application at the plot scale ” . In Soil erosion: application of physically based models , Edited by: Schmidt , J. 199 – 250 . Berlin : Springer-Verlag .
- Shen , Z.Y. 2009 . A comparison of WEPP and SWAT for modelling soil erosion of the Zhangjiachong Watershed in the Three Gorges Reservoir Area . Agricultural Water Management , 96 ( 10 ) : 1435 – 1442 .
- Singh , R.K. 2011 . Simulation of runoff and sediment yield from a hilly watershed in the eastern Himalaya, India using the WEPP model . Journal of Hydrology , 405 : 261 – 276 .
- Skaggs , R.W. 1978 . A water management model for shallow water table soils , Raleigh : Water Resources Research Institute of the University of North Carolina, Report No. 134 .
- Skaggs , R.W. , Breve , M.A. and Gilliam , J.W. 1994 . Hydrologic and water quality impacts of agricultural drainage . Critical Reviews in Environmental Science and Technology , 24 : 1 – 32 .
- Skaggs , R.W. , Chescheir , G.M. and Phillips , B.D. 2005 . Methods to determine lateral effect of a drainage ditch on wetland hydrology . Transactions of the American Society of Agricultural Engineers , 48 : 577 – 584 .
- Skaggs , R.W. , Nassehzadeh-Tabrizi , A. and Foster , G.R. 1982 . Subsurface drainage effects on erosion . Journal of Soil and Water Conservation , 37 : 167 – 171 .
- Tester , J.R. 1995 . Minnesota's natural heritage: an ecological perspective , Minneapolis : University of Minnesota Press .
- Thorp , K.R. , Jaynes , D.B. and Malone , R.W. 2008 . Simulating the long-term performance of drainage water management across the Midwestern United States . Transactions of the American Society of Agricultural and Biological Engineers , 51 ( 3 ) : 961 – 976 .
- Tiwari , A.K. , Risse , L.M. and Nearing , M.A. 2000 . Evaluation of WEPP and its comparison with USLE and RUSLE . Transactions of the American Society of Agricultural Engineers , 43 : 1129 – 1135 .
- USDA-NASS (US Department of Agriculture, National Agricultural Statistics Service). 2008. Minnesota Cropland Data Layer (CDL) for 2007 [online]. Available from: [Accessed 8 March 2011] http://www.nass.usda.gov/research/Cropland/metadata/metadata_mn07.htm (http://www.nass.usda.gov/research/Cropland/metadata/metadata_mn07.htm)
- USDA-NRCS, 2011. Rapid watershed assessment resource profile Le Sueur (MN) HUC: 07020011 [online]. Available from: [Accessed 15 August 2011] http://www.mn.nrcs.usda.gov/technical/rwa/Assessments/reports/le_sueur.pdf (http://www.mn.nrcs.usda.gov/technical/rwa/Assessments/reports/le_sueur.pdf)
- Van Klaveren , R.W. and McCool , D.K. 1998 . Erodibility and critical shear of a previously frozen soil . Transactions of the American Society of Agricultural Engineers , 41 : 1315 – 1321 .
- Water Resources Center . 2000 . Le Sueur River Major Watershed Diagnostic Report: Le Sueur River Basin Implementation Framework , Mankato : Water Resources Center, Minnesota State University, MPCA Clean Water Partnership Project No. 951-1-194-07 .
- Wesström , I. , Linnér , H. and Messing , I. 2000 . Controlled drainage—effects on drain outflow and water quality . Agricultural Water Management , 47 : 5 – 100 .
- Wilcox , B.P. 1990 . Predicting runoff from rangeland catchments: a comparison of two models . Water Resources Research , 26 : 2401 – 2410 .
- Wiskow , E. and van der Ploeg , R.R. 2003 . Calculation of drain spacings for optimal rainstorm runoff control . Journal of Hydrology , 272 : 163 – 174 .
- Yu , B. 2000 . A validation test of WEPP to predict runoff and soil loss from a pineapple farm on a sandy soil in subtropical Queensland Australia. . Australian Journal of Soil Research , 38 : 537 – 554 .
- Zeleke , G. 2001 . “ Application and adaptation of WEPP to the traditional farming systems of the Ethiopian Highlands. In ” . In Sustaining the global farm (selected papers from the 10th International Soil Conservation Organization meeting, 24–29 May 1999) , Edited by: Stott , D.E. , Mohtar , R.H. and Steinhardt , G.C. 903 – 912 . West Lafayette, IN: Purdue University and the USDA-ARS National Soil Erosion Research Laboratory .