
Abstract
A practical approach to separate the impact of the processes of climate change (CC) and human activities (HA) on streamflow is presented. A non-parametric Mann-Kendall-Sneyers test, combined with moving t test and Yamamoto methods, was used to recognize abrupt change points in the runoff time series to determine a baseline period. A new algorithm to separate CC and HA influence on streamflow was deduced based on the climate elasticity concept. Application to the Chao River, China, shows that CC imposed a positive impact on streamflow in this region (25%, on average), while HA exerted a continuous negative impact of –75% in the period after the 1950s. These results are of great use in understanding the variation of CC and HA impacts under different human development patterns.
Editor Z.W. Kundzewicz; Associate editor H. Aksoy
Résumé
Nous présentons une approche pratique de séparation des impact du changement climatique (CC) et des activités humaines (AH) sur l’écoulement. Nous avons utilisé le test non-paramétrique de Mann-Kendall-Sneyers, combiné avec la méthode de Yamamoto et le t-test mobile, pour déterminer les points de changement brusque dans les séries chronologiques de débits, afin de déterminer une période de référence. Sur la base du concept d’élasticité climatique, nous avons élaboré un nouvel algorithme permettant de séparer l’influence du CC et de l’AH sur les débits,. Son application sur le fleuve Chao en Chine, a montré que le CC a provoqué une augmentation de l’écoulement dans cette région (25% en moyenne), tandis que l’AH a provoqué sa diminution continue de -75% depuis les années cinquante. Ces résultats sont d’une grande utilité pour comprendre les processus de variation des impacts du CC et de l’AH en liaison avec différents modes de développement.
1 INTRODUCTION
Rapid socio-economic development in developing countries can lead to many quality and quantity related problems in rivers (Szilagyi Citation2001, Ren et al. Citation2002, Wilk and Hughes Citation2002, Ye et al. Citation2003, Levashova et al. Citation2004, Liu et al. Citation2010), which can put pressure on available water resources. For example, Beijing, the capital of China, encountered 11 dry years continuously from 1999. Higher air temperatures and less rainfall meant water demand at Beijing City reached its peak (Nie and Fan Citation2010). Long-term impacts of climate change (CC) and human activities (HA) contributed to this. Water conservation in the catchment area of the Miyun Reservoir, the main water-supply source of Beijing, is critical to ensure adequate supply. Local public administrators have been aware of this and many helpful measures, such as ecological restoration, forestation, and adjustment of agricultural planting structure, have been adopted in this region (Liao and Li Citation2003, Hao Citation2004, Wang et al. Citation2009, Nie and Fan Citation2010). It is not clear how far these actions can alleviate the water supply issues or how to balance expenditure and revenue by water conservation measures.
A clear understanding of the impact processes of CC and HA on regional streamflow should help in determining appropriate strategies and limits. For sustainable water resources management it is important to understand hydrological changes and to differentiate between the impact of CC and HA (Liu et al. Citation2010). However, it is a great challenge to distinguish the impact processes of CC and HA on runoff (Liu et al. Citation2010).
The impacts of climate change on hydrology vary spatially and need to be investigated on a local scale (Liu et al. Citation2010). Many studies on climate and runoff change for individual basins have been conducted (Chen et al. Citation2006, Kezer and Matsuyama Citation2006, Li et al. Citation2006, Wang Citation2007, Chang et al. Citation2007, Jiang et al. Citation2007, Pohl et al. Citation2007, Savitskiy et al. Citation2008, Zhang et al. Citation2008, Fu et al. Citation2010) and show that over the past 50 years, climate change has influenced river discharge (Huo et al. Citation2008). Traditional research has mainly focused on the effect of CC on streamflow by studying relationships between runoff and climate variables using hydrological or circulation models. This research emphasised the sensitivity of runoff to climate change across the world. The concept of climate elasticity of streamflow attracted much attention with three categories of research: (a) Multivariate historical record regressions (Revelle and Waggoner Citation1983, Vogel et al. Citation1999); (b) Single parameter climate elasticity of runoff (Nash and Gleick Citation1991, Sankarasubramanian et al. Citation2001); (c) Two-parameter climate elasticity of streamflow index (Fu et al. Citation2007, Gardner Citation2009). In terms of HA effects, most studies were based on statistical methods to analyse land use change, or a combination of hydrological and global climatic models (Li et al. Citation2007, Barnett et al. Citation2008). Most results are qualitative or semi-quantitative, giving an approximate influencing proportion value of either CC or HA.
Some research has been devoted to quantifying the CC and HA impacts on streamflow based on hydrological models, scenarios setting and statistical methods (Su et al. Citation2007, Hao et al. Citation2008, Ye et al. Citation2009, Dong et al. Citation2010, Fan et al. Citation2010, Li et al. Citation2010). Most approaches were based on periodical transfer of climate data or simple periodical data comparison. A potential problem is that errors may be introduced because of CC impact transfer between two different periods, by replacing some climate related variables during a period by those during another period.
Huo et al. (Citation2008) and Liu et al. (Citation2010) made significant progress in the separation and quantification of CC and HA impacts on streamflow. Huo et al. (Citation2008) found that the naturalized flow may be under- or over-estimated because of the replacement of the CC effect during the high human impact period by that during the natural variation period. That also probably results in a failure to accurately estimate the CC effect. It can only explain the rough contributions of CC and HA to the long-term averaged flow decrease. The same issue occurred in Ma et al. (Citation2008). The research of Liu et al. (Citation2010) could only give an approximate impact ratio of CC to HA on the basis of average runoff decrement (increment) during baseline and variable periods.
Most previous research explains the impact proportions of CC and HA at a large temporal scale (e.g. a decade or even longer) and it is hard to give clear variation in CC and HA impacts. Processes of CC and HA impacts on streamflow are therefore still largely unknown.
The aim of this study was to develop a new method for retrieving the time series of CC impact on streamflows, and thereby estimate the impact of HA on streamflows. In this paper, an algorithm was developed for the computation of CC impact on streamflow in an arbitrary year and then an equation was put forward to estimate the corresponding HA impact. The baseline period was determined by using abrupt-change points in the streamflow sequence. This method was then implemented in the upper and middle reaches of the Chao River to separate and analyse the CC and HA impact from the observed streamflow time series. The study area is extremely important because it lies upstream of the water-supply source of Beijing City.
2 METHOD AND DATA
2.1 Study area
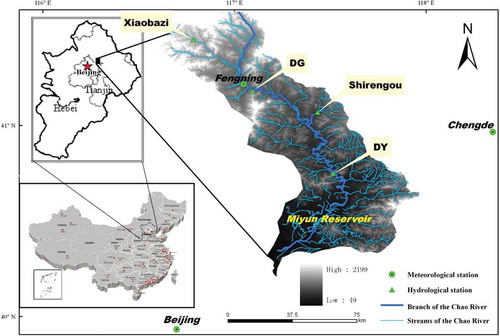
The Chao River, a tributary of the Hai River, is located in the north of China. It has a basin area of 6870 km2 (Dai Citation2009). The Miyun Reservoir, one of the most important water-supply sources for the capital of China, Beijing, is downstream on this river, as shown in . The mean annual precipitation is 600–700 mm, more than 70% of which occurs in summer. The mean annual air temperature is in the range 0–14°C, hot in summer and cold in winter (Dai Citation2009). The mean annual runoff is 0.18 ×10⁹ m3 and this has had a decreasing trend during the period from 1956 to 2000. Runoff is especially sensitive to the variation in the mean annual precipitation (Wu and Jiang Citation2010). Generally, the maximum monthly runoff occurs in August (Li and Li Citation2008). Spatially, the upper reaches have approximately the same mean annual runoff depth (51.84 mm) as the middle reaches (52.74 mm). In terms of runoff variation, the coefficient of variation in the upper and middle reaches has the same value of 0.21.
Fig. 1 Location of the Chao River in northern China.
Since the late 1970s, China has experienced rapid socio-economic development, and regional water consumption and land cover have changed dramatically (Wang et al. Citation2009). The result is the intensification of HA and a reduction in streamflow of the Chao River.
In this river, Dage (DG) and Daiying (DY) are two control hydrological stations, located in the upper and middle reaches, respectively (). The DG station, established in 1923, has a catchment area of 1850 km2. Annual precipitation ranged from 290–750 mm during the period 1951–2002; average annual air temperature ranged from 4.0–8.5°C for 1956–2001, with a maximum in excess of 40°C and a minimum of nearly –30°C. The DY station was established in 1950 and has a catchment area of 4266 km2. Annual precipitation was in the range 350–1000 mm during the 1951–2002 period.
Our proposed method is used herein to study the variation in CC and HA impacts since the 1950s on streamflows in the ‘upper’ (upstream of DG) and ‘middle’ (between DG and DY) reaches of the Chao River.
2.2 Data
Annual data of precipitation, pan evaporation, actual observed runoff and mean air temperature were collected from hydrological and meteorological stations, as shown in . As shows, in the upper reach (upstream of DG), precipitation was recorded at Xiaobazi, Fengning and DG; pan evaporation at Fengning and DG; runoff at DG; air temperature at Fengning and averages calculated. Averaged values of precipitation at DG, Shirengou and DY; pan evaporation at DG and DY; air temperature at Fengning, Chengde and Beijing were used in the middle reach (between DG and DY). Runoff at DY minus that at DG was used to represent the runoff in the middle reach.
Table 1 Meteorological and hydrological stations and parameters used in this study.
All data collected were quality controlled before distribution by hydrological and meteorological departments. Data of annual precipitation, pan evaporation, air temperature and streamflow were smoothed using the T4253H smoothing function in the SPSS 17.0 statistical software package (http://www-01.ibm.com/software/analytics/spss/) to lower the influence of observation errors and make trends clearer.
3 METHODOLOGY
3.1 Main framework
For a catchment with huge impacts from CC and HA, regulation or diversion can be categorized into impact of HA on streamflow. Then streamflow can be modelled as a function of climatic and HA variables:
On the assumption that the HA factors are independent of the climate factors, equation (1) can be written as:
With the concept of the climate elasticity of streamflow , equation (3) can be written as:
Considering the lead–lag effect of climate change on the streamflow, the average of the following N values of streamflow was taken as the current value, i.e.
Taking the period before the first abrupt-change point of the streamflow sequence as the baseline period, and under an assumption that in the baseline period CC and HA have no impact on streamflow (i.e. QC and QV are equal to zero), letting N = 3, and substituting equation (7) for Q in equation (5), the response function of streamflow variation induced by CC (QC) can be deduced with an initial condition of QC(0) = 0 by:
In brief, this framework can be applied as follows: first, parameters [a] in the model need to be calibrated with the data in the baseline period. Then, the model is used to calculate Q0(t) in the non-baseline period. In the non-baseline period, a1, a2, a3 in equation (8) of year t can be easily calibrated with flow series for the period t to t+N−1 by using N = 3 in the above polynomial of Q(t′). With the three calibrated parameters, QC(t) can be calculated using equation (8), and then, QV(t) is easy to calculate with equation (9).
3.2 Determination of abrupt-change points of a streamflow sequence
Abrupt-change points are recognized herein to help determine the baseline period for a streamflow sequence. Here a non-parametric Mann-Kendall-Sneyers test, combined with the moving t test method and Yamamoto method, was adopted to recognize the abrupt-change points in the runoff time series.
The non-parametric Mann-Kendall-Sneyers test (Mann Citation1945, Kendall Citation1975, Sneyers Citation1975) is a sequential version of the Mann-Kendall rank statistic (Li et al. Citation2007). Here, it was used to analyse the runoff trend and help determine the change points. This method (Li et al. Citation2007) is widely used.
Recognition of abrupt-change points has attracted considerable attention globally and a number of methods can be applied to determine the abrupt-change points of a time series (Yamamoto and Sanga Citation1986, Wei Citation1999, Hubert Citation2000, Shao and Campbell Citation2002, Kehagias and Fortin Citation2006, Zheng et al. Citation2007, Aksoy et al. Citation2008, Gedikli et al. Citation2008, Gedikli et al. Citation2010a, Citation2010b, Abrate et al. Citation2013).
The moving t test is globally used to detect the changes in a time series (Zheng et al. Citation2007). The t value in this method will be positive if the first mean is larger than the second, and negative if it is smaller (Shao and Campbell Citation2002). Yamamoto used signal-to-noise ratio (SNR) to study the abrupt change in time series of air temperature, precipitation etc. (Yamamoto and Sanga Citation1986, Wei Citation1999). In the research of Yamamoto and Sanga (Citation1986), SNR was defined as:
4 RESULTS AND DISCUSSION
4.1 Abrupt-change points in DG and DY
The Mann-Kendall-Sneyers test was primarily used to distinguish the trend in the streamflow sequence with α = 0.01. The results indicate that, from the start, runoff was decreasing. It is also shown that there may have been large changes during the period 1960–1965 and around 1975.
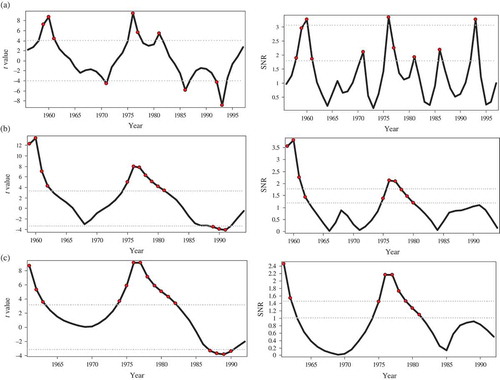
The moving t test method and the Yamamoto method were used to further identify the abrupt-change points. shows that change points occurred at about 1961 and 1976 with both methods. The results suggest 1961 as the first change point of runoff in the upstream reach (upper DG) and, similarly, 1960 as the first change point of runoff in the middle reach (DG–DY). Therefore, 1951–1961 and 1951–1960 were selected as baseline periods in the upper and middle reaches, respectively. The analysis above was completed with the help of DPS (data processing system) (Tang and Zhang Citation2012).
Fig. 2 Change points of DG streamflow obtained by using the moving t test (left) and the Yamamoto index (right), with α = 0.01 and different sub-series length (a–c): IH = 5, 8, 10. Sub-series length is the length of a sub-sequence (IH), i.e., number of data in the sub-sequence. In the moving t test, a sequence is divided into two sub-sequences whereby to test the changing points in the sequence.
4.2 Runoff yield before and after abrupt-change points
The two abrupt-change points (1961 and 1976) in the upstream reach divide the 1951–2001 period into three parts: 1951–1961 (S1), 1962–1976 (S2) and 1977–2001 (S3). There are great differences in the runoff yield in the three periods, as demonstrates. The middle reach showed a similar situation, with the runoff–yield coefficient reduced to a large degree.
Fig. 3 Runoff yield change in the three periods (S1, S2, S3) at DG station.
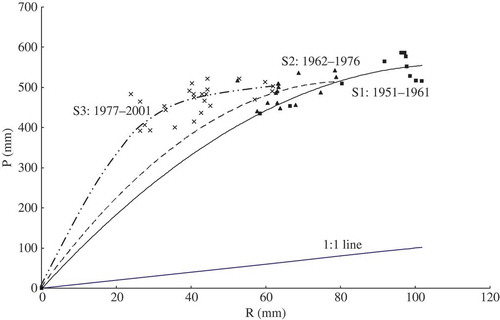
Undoubtedly, socio-economic development has had an enormous influence on the runoff yield situation. From S1 to S3, the same rainfall yields less river runoff. Moreover, the slope of the P–R curve also decreases. This implies that an equivalent increase in rainfall produces much more streamflow, which makes the flood peak higher and therefore threatens the safety of local and downstream residents. This may be attributed to the great change in the land use (e.g. deforestation, ground surface hardening) by human activities in the study area (Sun et al. Citation2007, Li and Li Citation2008).
4.3 Normal rainfall–runoff induced streamflow, Q0
Since we assumed that in the baseline period QC(t) = 0 and QV(t) = 0, Q0(t) = Q(t) in this period, according to equation (9). A relationship can then be fitted between annual rainfall data (P(t)) and Q0(t), as follows: with R2 = 0.87, root mean square error, RMSE = 10.73, F = 52.36 >> F0.01(1,10) = 10.04 in the upper reach and
with R2 = 0.97, RMSE = 8.99, F = 268.23 >> F0.01(1,9) = 10.56 in the middle reach. The F test shows the relationship is significant and it can be used to retrieve the normal rainfall–runoff induced streamflow (Q0), as illustrates.
Overall, Q0 fluctuated and showed no evident rise or decline after the 1950s; Q0 in the middle reach fluctuates more than Q0 in the upper reach.
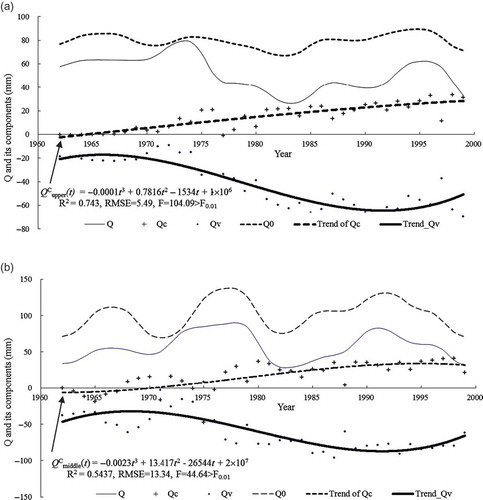
Fig. 4 Processes of observed streamflow (Q); CC-induced (QC), HA-induced (QV) and normal rainfall–runoff induced (Q0) streamflow variations in (a) the upper reach and (b) the middle reach.
4.4 CC-induced streamflow, QC
By using equation (8), QC sequences in the two regions after the 1950s were obtained (). On the whole, they show a rising trend and an increase of about 30 mm in the upper reach and 35 mm in the middle reach over four previous decades, accounting for 6.10% and 5.76% of mean rainfall in the baseline period, respectively.
The increasing rate in the upper reach slows down gradually since d2QC(t)/dt2 = –7.95 ×10⁻⁴t + 1.56 was negative in the upper reach during 1960–1999. The trend in the middle reach during the same period is divided into two stages: an accelerating period from 1961 to 1979, as d2QC(t)/dt2 = –0.16t + 31.72 was positive before 1979; and a decelerating period from 1980 to 1999 as d2QC(t)/dt2 was negative after 1979. This suggests that the increasing rate in the middle reach accelerated before 1979 and then slowed down after 1979.
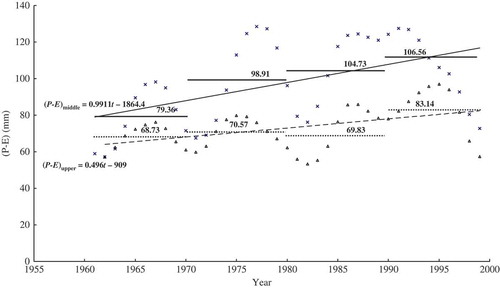
To verify the QC results, the corresponding process of rainfall minus evaporation (P – E) was drawn, which can be considered as the potential water for runoff yield. In the two regions, P – E shows a similar upward trend (). It is clear that in the study area, solely considering climatic factors that are induced by climate change, there exists a great potential for streamflow increase. According to Wang et al. (Citation2005), a large decrease in E may be due to reductions in regional water area. The increasing pattern of P – E is different in the two regions: in the middle reach, the decadal average of P – E continually increases, while in the upper reach it is more complicated with a reduction in P – E in the 1980s. The growth rate in the middle reach is greater than in the upper reach, which indicates that CC impact in the middle reach is larger than that in the upper reach. On the whole, the process of P – E after the 1950s in the two regions justified that of QC.
Fig. 5 Process of difference between precipitation and evaporation in the upper and middle reaches to verify results of QC: E is estimated according to equation (14) by Liu and Woo (Citation1996). Lines and values above them denote the decade average value.
At a decadal scale (), upper reach QC values have on average an increasing rate of 8.62 mm per decade in the 1970s and 12.25 mm in the 1980s, but the rate slows down to only 6.32 mm in the 1990s. This implies that QC has increased since the 1960s, but it will reach its maximum value sometime in the future. Middle reach QC values show a similar decadal trend as that in the upper region.
Table 2 Change of streamflow related variables in the upper and middle reaches during four previous decades and the four-decade average.
This suggests that the trend of QC in the Chao River is upward after the 1950s, but the pattern of increase is different between the upper and middle reaches and it is more complex in the middle reach. At a decade scale, the highest values occur in the 1990s, but the acceleration in the 1980s is the greatest.
4.5 HA-induced streamflow, QV
The HA-induced streamflow (QV) takes on a decreasing trend after the 1950s in the two regions (). In the four decades considered, it reduced by more than 65 mm (13.21% rainfall but 74.57% streamflow on average in the baseline period) in the upper region, and more than 90 mm (14.81% rainfall but 62.84% streamflow) in the middle reach. This signifies that HA had a great impact on streamflow. However, the decreasing trend slows down gradually, especially after 1990, as shown in . This may be attributed to some ecological rehabilitation, afforestation and agricultural restructuring in the study area that ultimately led to a substantial increase in forest coverage, but a reduction in farmland and grassland (Wang et al. Citation2005).
Considering the decadal average, QV decreased continuously (), yet the rate of decrease slowed. In the upper and middle reaches, respectively, QV decreased by less than 25 and 40 mm in the 1960s to 1970s, but more than 55 and 75 mm in the 1980s and 1990s, which signifies that HA intensified greatly from the 1980s. Compared with the previous decade, QV decreased by 3.28 mm (upper reach) and increased by 3.20 mm (middle reach) in the 1970s, and decreased by 34.13 mm (upper) and 42.83 mm (middle) in the 1980s, and by only 3.32 mm (upper) and 2.43 mm (middle) in the 1990s. This implies that local countermeasures using ecological rehabilitation and environmental protection by transferring agricultural land and grasslands to forestry (Wang et al. Citation2005) had a positive effect on the HA reduction.
In brief, streamflow variation induced by HA (QV) takes on a decreasing trend after the 1950s in the Chao River, and rainfall reduced by around 13–15%, with average streamflow in the baseline period reduced by 62–75%. A greater QV usually resulted from a larger runoff yield area: QV is about 30 mm more in the middle reach than in the upper reach. Human activity has greatly influenced streamflow in the four decades considered, but the impact weakened from the 1990s due to effective environmental protection and increase in forestry.
4.6 Comparison of CC and HA effect in the four decades
shows the variation of runoff-yield coefficient (α), observed streamflow (Q), normal rainfall–runoff induced streamflow (Q0), CC-induced streamflow (QC), HA-induced streamflow (QV) and the integrated effect of CC and HA (Q – Q0). The values of α and Q decreased with the intensification of HA, especially in the 1980s when the two variables reached their minimum values. Unexpectedly, Q0 fluctuates over time and displays no evident trend.
Conversely, QC and QV show opposing trends: the former rises and the latter drops. Their integrated impact on streamflow was different in different decades. The value of Q – Q0 during the 1980–1990s was about twice that during the 1960–1970s, which suggests the integrated impact in the former period was much more drastic. The value of Q – Q0 in the upper and middle reaches increased by 7.97 and 10.73 mm, respectively, in the 1970s compared with the previous decade; it decreased by 23.98 and 31.50 mm, respectively, in the 1980s and increased again in the 1990s by 1.13 and 11.38 mm, respectively, which indicates that the integrated effect of CC and HA on streamflow has declined since the 1990s. Evidently, the 1980s was the most affected period in terms of HA.
The proportion of the impact of the two factors on streamflow also varied greatly in different decades. In the 1960s, QV dominated in a less negative integrated impact. In the 1970s, CC had a positive effect of 25.78% and 22.24% in the upper and middle reaches, respectively, while HA had a negative influence of 74.22% and 77.76%, and CC impact was 29–35% that of HA. In the 1980s, there was more CC impact and less HA intensity. In the 1990s, the trend continued. In the Chao River, upstream of the Miyun Reservoir, on average, QC had a positive 25% impact on streamflow, while QV exerted a negative effect of –75% in the four decades since the 1950s, and HA exerted a more negative effect in the middle reach than in the upper.
Li and Li (Citation2008) studied the influences of CC and HA on streamflow based on precipitation, air temperature and runoff data between 1961 and 2005. Their results showed that precipitation and air temperature changes were not the main factors leading to the drastic decrease in annual runoff, and the runoff reduction was affected more by HA, such as water resources utilization, land-use change, construction of reservoirs and inter-basin water transfer. Our results suggest similar conclusions in that HA is the main factor causing the reduction in annual runoff.
Yao et al. (Citation2003) analysed HA and precipitation impacts on runoff during the period 1967–2000 at DY station using an annual runoff accumulation curve. Their results indicated that HA was the main factor leading to a reduction in annual runoff. During the four decades considered, the reduction induced by HA accounts for 53.92% of the total reduction in annual runoff, while that due to changed precipitation accounts for 46.08% (both impacts from HA and precipitation are negative). Our results indicate that HA leads to 76.51% reduction in runoff (i.e. negative), while the effect of CC of 23.49% increase is positive. This has several reasons. Firstly, we considered air temperature in addition to precipitation. The former is one of the dominant influencing factors for evaporation. Because Yao et al. (Citation2003) only accounted for precipitation, reduction in precipitation undoubtedly resulted in reduction in runoff. If they considered the difference between precipitation and evaporation (P – E), the impact of CC deduced from their results may have been positive. A slower decrease in precipitation plus a faster decrease in evaporation may lead to an increase in P – E. Secondly, they only used point-observed data (at DY station) of precipitation and runoff to establish the precipitation–runoff model, while we employed the areal rainfall and regional runoff (observed at DY station) to study the impacts of HA and CC. Obviously, the latter is more accurate. Thirdly, our result is for the middle reach between DG and DY, while they examined the whole area upstream of DY station including the region upstream of DG where HA is less intense. So it is reasonable that their HA impact value is smaller than ours.
According to Wang et al. (Citation2009), the coverage of forest increased from 48% in 1980 to 65% in 1995, while grassland and cultivated land decreased from 28% and 22% to 16% and 17%, respectively. Supporting our results, this may lead to a decrease in agricultural water consumption and therefore lower HA impact intensity.
4.7 Advantages and uncertainties in the method
The method used in this study was compared with other studies such as Kezer and Matsuyama (Citation2006), Zheng et al. (2006), Chang et al. (Citation2007), Jiang et al. (Citation2007), Pohl et al. (Citation2007), Savitskiy et al. (Citation2008), Huo et al. (Citation2008), Fan et al. (Citation2010), Fu et al. (Citation2010) and Liu et al. (Citation2010). The advantages of this method include: (a) it is able to retrieve the annual quantitative time series of CC and HA impact based on the observed streamflow sequences; (b) its base is climate elasticity, not periodical data transfer; therefore, it can compute CC impact more precisely; and (c) it is not based on period data comparison, so, unlike previous studies, it can describe CC- and HA-induced streamflow at a much smaller temporal scale (annual).
Theoretically, this method can be applied to any region where the CC and HA have an influence on streamflow. It can be employed by local water resources administrators to better understand the impact of CC and HA processes under different development patterns. It should also be considered that there are uncertainties in the results because of the assumption that streamflow variations induced by rainfall–runoff changes due to CC and to HA are independent of each other. Selection of the baseline period, when the CC and HA impacts can be disregarded, may also produce some uncertainties because of data limitations. The uncertainties need to be investigated in the future and further verification of the method by applying it to other regions is suggested.
5 CONCLUSIONS
A novel method is presented in this research to retrieve two time series from the observed streamflow: one is climate-change (CC) induced streamflow and the other is the human activities (HA) induced partition. This method is able to give the annual streamflow processes induced by both CC and HA. Its temporal resolution (one year) is much higher than that of traditional methods (a decade or even longer). Taking the 1950s as the baseline period, the method was used to separate and analyse the streamflow variation during the four decades since the baseline period, based on hydrological and meteorological data from the upper and middle reaches of the Chao River. This is upstream of the important water-supply source, the Miyun Reservoir, and enabled us to study the processes of CC and HA impacts on local streamflow. The results show that:
CC imposed a positive impact on streamflow. CC-induced streamflow (QC) has had a rising trend in the four decades since the 1960s. Its increment accounts for 5.76–6.10% of the mean rainfall in the baseline period. This is in accordance with the increasing trend in the runoff potential (rainfall minus evaporation), as shown in . At the decadal scale, the maximum occurred in the 1990s, while the acceleration was greatest in the 1980s.
HA exerted a continuous negative impact on streamflow. In the past four decades, it made streamflow reduce by 62–75% of the mean value in the baseline period. HA intensified greatly from the 1980s, which made the decadal mean decrement of HA-induced streamflow (QV) in the 1980–1990s more than twice that in the 1960–1970s. However, the rate of decrease slowed in the 1990s owing to large-scale ecological restoration in the Chao River basin. HA impact on streamflow is about 30 mm more in the middle than in the upper reach. On the whole, the runoff-yield coefficient and observed streamflow decrease with the intensification of HA, especially in the 1980s.
Normal rainfall–runoff induced streamflow variation shows no apparent trend whereas QC and QV reveal opposite trends: positive and negative, respectively. Their integrated impact on streamflow in the 1980–1990s was nearly twice that in the 1960–1970s, signifying that the integrated impact in the 1980–1990s was more drastic. The greatest integrated impact appeared in the 1980s.
The individual impact proportion of the two factors varies greatly in different decades. In the 1960s, QV dominated within the integrated impact; in the 1970s, CC vs HA exceeded 1/3; the CC proportion kept increasing after that until in the 1990s when CC vs HA was almost 1/2, which suggests a great reduction in HA in this decade with a lesser integrated impact, compared with the prior decade. On average, CC imposed a positive 25% impact on streamflow, while HA exerted a negative effect of –75% in the Chao River Basin, upstream of the Miyun Reservoir during the four decades after the 1950s.
These results are useful for local water resources management sectors to quantitatively evaluate the expenditure and revenue of water conservation measures, and make accurate decisions on allocation of valuable water resources to ensure the sustainable development of the regional society and economy.
Acknowledgements
We are very appreciative of the constructive suggestions and comments from the reviewers and editors.
Additional information
Funding
Related Research Data
REFERENCES
- Abrate, T., Hubert, P., and Sighomnou, D., 2013. A study on hydrological series of the Niger River. Hydrological Sciences Journal, 58 (2), 271–279. doi:10.1080/02626667.2012.752575.
- Aksoy, H., et al., 2008. Fast segmentation algorithms for long hydrometeorological time series. Hydrological Processes, 22 (23), 4600–4608. doi:10.1002/hyp.7064.
- Barnett, T.P., et al., 2008. Human-induced changes in the hydrology of the western United States. Science, 319 (5866), 1080–1083. doi:10.1126/science.1152538.
- Chang, H., et al., 2007. Vulnerability of Korean water resources to climate change and population growth. Water Science and Technology, 56 (4), 57–62. doi:10.2166/wst.2007.536.
- Chen, Y.N., et al., 2006. Regional climate change and its effects on river runoff in the Tarim Basin, China. Hydrological Processes, 20, 2207–2216. doi:10.1002/hyp.6200.
- Dai, X.Q., 2009. Measure and control of ecological flow in river system—Case study on Chaobaihe River. Thesis (PhD). Institute of Geographic Sciences and Natural Resources Research, Chinese Academy of Sciences. (in Chinese).
- Dong, P.G., Feng, S.Y., and Huo, Z.L., 2010. Effect of climatic changes and human activities on the runoff at downstream of the Shiyang River. China Rural Water and Hydropower, 7, 22–24. (in Chinese).
- Fan, J., et al., 2010. Quantifying the magnitude of the impact of climate change and human activity on runoff decline in Mian River Basin, China. Water Science and Technology, 62 (4), 783–791. doi:10.2166/wst.2010.294.
- Fu, G.B., et al., 2010. Impacts of climate change and variability on hydro-climate regimes of the Yellow River. Proceedings of the 4th International Yellow River Forum on Ecological Civilization and River Ethics, 131–139.
- Fu, G.B., Charles, S.P., and Chiew, F.H.S., 2007. A two-parameter climate elasticity of streamflow index to assess climate change effects on annual streamflow. Water Resources Research, 43 (11), W11419. doi:10.1029/2007wr005890.
- Gardner, L.R., 2009. Assessing the effect of climate change on mean annual runoff. Journal of Hydrology, 379 (3–4), 351–359. doi:10.1016/j.jhydrol.2009.10.021.
- Gedikli, A., Aksoy, H., and Unal, N.E., 2008. Segmentation algorithm for long time series analysis. Stochastic Environmental Research and Risk Assessment, 22 (3), 291–302. doi:10.1007/s00477-007-0115-4.
- Gedikli, A., Aksoy, H., and Unal, N.E., 2010a. AUG-Segmenter: a user-friendly tool for segmentation of long time series. Journal of Hydroinformatics, 12 (3), 318–328. doi:10.2166/hydro.2009.084.
- Gedikli, A., et al., 2010b. Modified dynamic programming approach for offline segmentation of long hydrometeorological time series. Stochastic Environmental Research and Risk Assessment, 24, 547–557. doi:10.1007/s00477-009-0335-x.
- Hao, L.J., 2004. Analysis on variation and influencing factors of rainfall–runoff relationship in Miyun Reservoir watershed. Beijing Water Resources, 3, 41–43. (in Chinese).
- Hao, X.M., et al., 2008. Impacts of climate change and human activities on the surface runoff in the Tarim River basin over the last fifty years. Water Resources Management, 22 (9), 1159–1171. doi:10.1007/s11269-007-9218-4.
- Hubert, P., 2000. The segmentation procedure as a tool for discrete modeling of hydrometeorological regimes. Stochastic Environmental Research and Risk Assessment, 14 (4–5), 297–304. doi:10.1007/PL00013450.
- Huo, Z.L., et al., 2008. Effect of climate changes and water‐related human activities on annual stream flows of the Shiyang River basin in arid north‐west China. Hydrological Processes, 22 (16), 3155–3167. doi:10.1002/hyp.6900.
- Jiang, T., et al., 2007. Comparison of hydrological impacts of climate change simulated by six hydrological models in the Dongjiang Basin, South China. Journal of Hydrology, 336 (3–4), 316–333. doi:10.1016/j.jhydrol.2007.01.010.
- Kehagias, A. and Fortin, V., 2006. Time series segmentation with shifting means hidden Markov models. Nonlinear Processes in Geophysics, 13, 339–352. doi:10.5194/npg-13-339-2006.
- Kendall, M.G., 1975. Rank correlation measures. London: Charles Griffin.
- Kezer, K. and Matsuyama, H., 2006. Decrease of river runoff in the Lake Balkhash basin in Central Asia. Hydrological Processes, 20, 1407–1423. doi:10.1002/hyp.6097.
- Levashova, E.A., et al., 2004. Natural and human-induced variations in water and sediment runoff in the Danube River mouth. Water Resources/Vodnye Resursy, 31, 235–246. doi:10.1023/B:WARE.0000028693.49051.d9.
- Li, L., Wang, Z.Y., and Wang, Q.C., 2006. Influence of climate change on flow over the upper reaches of Heihe River. Scientia Geographica Sinica, 26, 40–46. (in Chinese).
- Li, L.J., et al., 2007. Assessing the impact of climate variability and human activities on streamflow from the Wuding River basin in China. Hydrological Processes, 21 (25), 3485–3491. doi:10.1002/hyp.6485.
- Li, Z., et al., 2010. The impacts of climate change and human activities on river flow in the Loess Tableland of China. Acta Ecologica Sinica, 30 (9), 2379–2386. (in Chinese).
- Li, Z.J. and Li, X.B., 2008. Trend and causation analysis of runoff variation in the upper reach of Chaobaihe River Basin in northern China during 1961–2005. Journal of Beijing Forestry University, 30 (Supp. 2), 82–87. (in Chinese).
- Liao, R.H. and Li, Q.J., 2003. Studies on river basin sustainable development strategy for the Miyun Reservoir. China Water Resources, 8, 22–23. (in Chinese).
- Liu, C.M. and Woo, M.K., 1996. A method to assess the effects of climatic warming on the water balance of mountainous regions. In: J.A. Jones, et al., eds. Regional hydrological response to climate change. Dordrecht: Kluwer Academic Publishers, 301–315.
- Liu, D.D., et al., 2010. Impacts of climate change and human activities on surface runoff in the Dongjiang River basin of China. Hydrological Processes, 24 (11), 1487–1495.
- Ma, Z.M., et al., 2008. Analysis of impacts of climate variability and human activity on streamflow for a river basin in arid region of northwest China. Journal of Hydrology, 352 (3–4), 239–249. doi:10.1016/j.jhydrol.2007.12.022.
- Mann, H.B., 1945. Non-parametric tests against trend. Econometrica, 13, 245–259. doi:10.2307/1907187.
- Nash, L.L. and Gleick, P.H., 1991. Sensitivity of streamflow in the Colorado basin to climatic changes. Journal of Hydrology, 125 (3–4), 221–241. doi:10.1016/0022-1694(91)90030-L.
- Nie, Y.Z. and Fan, C.H., 2010. Countermeasures of Beijing City on continuous dry climate. China Water Resources, 11, 27–28. (in Chinese).
- Pohl, S., et al., 2007. Modeling the impact of climate change on runoff and annual water balance of an Arctic headwater basin. Arctic, 60 (2), 173–186.
- Ren, L.L., et al., 2002. Impacts of human activity on river runoff in the northern area of China. Journal of Hydrology, 261, 204–217. doi:10.1016/S0022-1694(02)00008-2.
- Revelle, R.R. and Waggoner, P.E., 1983. Effects of a carbon dioxide-induced climatic change on water supplies in the Western United States. Changing Climate, 419–432.
- Sankarasubramanian, A., Vogel, R.M., and Limbrunner, J.F., 2001. Climate elasticity of streamflow in the United States. Water Resources Research, 37 (6), 1771–1781. doi:10.1029/2000WR900330.
- Savitskiy, A.G., et al., 2008. Current and future impacts of climate change on river runoff in the Central Asian river basins. Adaptive and Integrated Water Management, 323–339. doi:10.1007/978-3-540-75941-6_17.
- Shao, Q. and Campbell, N.A., 2002. Modelling trends in groundwater levels by segmented regression with constraints. Australian & New Zealand Journal of Statistics, 44, 129–141. doi:10.1111/1467-842X.00216.
- Sneyers, R., 1975. Sur l’analyse statistique des séries d’observations. WMO Technology Note.
- Su, X.L., et al., 2007. Impact of climate change and human activity on the runoff of Wei River basin to the Yellow River. Journal of Northwest University (Natural Science Edition), 35 (2), 153–159. (in Chinese).
- Sun, F.B., 2007. Study on watershed evapotranspiration based on the Budyko hypothesis. Thesis (PhD). Tsinghua University.
- Sun, N., et al., 2007. The changes of rainfall–runoff relationship and the impacts of human activities in the Upper Chao Watershed. Progress in Geography, 26 (5), 41–47. (in Chinese).
- Szilagyi, J., 2001. Identifying cause of declining flows in the Republican River. Journal of Water Resources Planning and Management, 127 (4), 244–253. doi:10.1061/(ASCE)0733-9496(2001)127:4(244).
- Tang, Q.Y. and Zhang, C.X., 2012. Data Processing System (DPS) software with experimental design, statistical analysis and data mining developed for use in entomological research. Insect Science. doi:10.1111/j.1744-7917.2012.01519.x.
- Vogel, R.M., Wilson, I., and Daly, C., 1999. Regional regression models of annual streamflow for the United States. Journal of Irrigation and Drainage Engineering, 125 (3), 148–157. doi:10.1061/(ASCE)0733-9437(1999)125:3(148).
- Wang, G.S., Xia, J., and Chen, J., 2009. Quantification of effects of climate variations and human activities on runoff by a monthly water balance model: a case study of the Chaobai River basin in northern China. Water Resources Research, 45, W00A11. doi:10.1029/2007WR006768.
- Wang, G.X., et al., 2007. Effects of land-use changes on hydrological processes in the middle basin of the Heihe River, northwest China. Hydrological Processes, 21, 1370–1382. doi:10.1002/hyp.6308.
- Wang, L.Y., Lv, C.H., and Yao, Z.J., 2005. A spatio-temporal analysis of land use change and its driving forces in the upper reaches of the Chaobai River, North China. Progress in Geography, 24 (5), 88–96. (in Chinese).
- Wei, F.Y., 1999. Technologies of statistical diagnosis and forcasting for modern climate. Beijing: China Meteorological Press. (in Chinese).
- Wilk, J. and Hughes, D.A., 2002. Simulating the impacts of land-use and climate change on water resource availability for a large south Indian catchment. Hydrological Sciences Journal, 47, 19–30. doi:10.1080/02626660209492904.
- Wu, X.N. and Jiang, Y., 2010. The impact of climatic change on runoff in Chaohe River Basin. China Rural Water and Hydropower, 2, 5–12.
- Yamamoto, R.T.I. and Sanga, N.K., 1986. An analysis of climatic jump. Meteorological Society of Japan, 64 (2), 273–281.
- Yao, Z.J., Guan, Y.P., and Gao, Y.C., 2003. Analysis of distribution regulation of annual runoff and affection to annual runoff by human activity in the Chaobaihe River. Progress in Geography, 22 (6), 59–606.
- Ye, B.S., Yang, D., Kane, D.L., 2003. Changes in Lena River streamflow hydrology: human impacts versus natural variations. Water Resources Research, 39 (7). doi:10.1029/2003WR001991.
- Ye, X.C., et al., 2009. Impacts of climate change and human activities on runoff of Poyang Lake Catchment. Journal of Glaciology and Geocryology, 5, 835–842. (in Chinese).
- Zhang, Q., Gemmer, M., and Chen, J.Q., 2008. Climate changes and flood/drought risk in the Yangtze Delta, China, during the past millennium. Quaternary International, 176–177, 62–69. doi:10.1016/j.quaint.2006.11.004.
- Zheng, H.X., et al., 2007. Changes in stream flow regime in headwater catchments of the Yellow River basin since the 1950s. Hydrological Processes, 21 (7), 886–893. doi:10.1002/hyp.6280.
- Zheng, H.X., et al., 2009. Responses of streamflow to climate and land surface change in the headwaters of the Yellow River Basin. Water Resources Research, 45, 1–9. doi:10.1029/2007WR006665.