
Abstract
Knowledge of rainfall characteristics is important for estimating soil erosion in arid areas. We determined basic rainfall characteristics (raindrop size distribution, intensity and kinetic energy), evaluated the erosivity of rainfall events, and established a relationship between rainfall intensity I and volume-specific kinetic energy KEvol for the Central Rift Valley area of the Ethiopian highlands. We collected raindrops on dyed filter paper and calculated KEvol and erosivity values for each rainfall event. For most rainfall intensities the median volume drop diameter (D50) was higher than expected, or reported in most studies. Rainfall intensity in the region was not high, with 8% of rain events exceeding 30 mm h-1. We calculated soil erosion from storm energy and maximum 30-min intensity for soils of different erodibility under conditions of fallow (unprotected soil), steep slope (about 9%) and no cover and management practice on the surface, and determined that 3 MJ mm ha-1 h-1 is the threshold erosivity, while erosivity of >7 MJ mm ha-1 h-1 could cause substantial erosion in all soil types in the area.
Editor Z.W. Kundzewicz; Associate Editor Q. Zhang
Résumé
La connaissance des caractéristiques des précipitations est importante pour estimer l’érosion des sols dans les zones arides. Nous avons déterminé les caractéristiques de base des précipitations (distribution de la taille des gouttes de pluie, intensité et énergie cinétique), évalué l’érosivité des précipitations, et établi une relation entre l’intensité des précipitations I et l’énergie cinétique spécifique KEvol dans la zone centrale de la vallée du Rift des hauts plateaux éthiopiens. Nous avons recueilli des gouttes de pluie sur un papier filtre coloré et les valeurs de KEvol et de l’érosivité ont été calculées pour chaque événement pluvieux. Pour la plupart des intensités de pluie le diamètre médian des gouttes (D50) s’est révélé plus élevé que prévu ou signalé dans la plupart des études. L’intensité des précipitations dans la région n’était pas élevée, 8% des événements pluvieux ayant une intensité supérieure à 30 mm h-1. Nous avons calculé l’érosion des sols à partir de l’énergie des averses et de l’intensité maximale sur 30 min pour des sols en jachère d’érodibilités différentes, de pente raide (environ 9%), sans couverture et non travaillés, et nous avons déterminé que le seuil d’érosivité était de 3 MJ mm ha-1 h-1 et qu’une érosivité supérieure à 7 MJ mm ha-1 h-1 pouvait provoquer une érosion importante de tous les types de sols.
1 INTRODUCTION
Rainfall erosivity, which quantifies the ability of rainfall energy to detach and transport soil from a plot of land, is one of the six major factors in the Universal Soil Loss Equation (Wischmeier and Smith Citation1958) and the Revised Universal Soil Loss Equation (Renard et al. Citation1997) used for estimation of soil erosion. Soil erosion rates are dependent on the detaching power of raindrops that hit the soil surface, called the splash effect, and the volume of rain that makes up the runoff (Van Dijk et al. Citation2002, Lu et al. Citation2008). Wischmeier and Smith (Citation1958, Citation1978) proposed the basic expression of erosivity based on the kinetic energy of the rain and its intensity.
The kinetic energy of a given rainfall event represents the total energy that is available for detachment of the soil through rain splash (Renard et al. Citation1997, Fornis et al. Citation2004). It is widely recognized as the potential of rain to detach soil particles (Salles et al. Citation2002). The rain kinetic energy is obtained from the combined effects of the fall velocity (Vt) and drop size distribution (DSD) of raindrops (Kinnell Citation1981). Methods developed to collect DSD information from natural rain showers to determine the kinetic energy include the flour pellet technique (Laws and Parsons Citation1943) and the use of electromechanical distrometers (Joss and Waldvogel Citation1967), cameras (Kinnell Citation1980, McIsaac Citation1990) and optical pluviospectrometers (Illingworth and Stevens Citation1987, Salles and Poesen Citation1999).
The understanding of rainfall characteristics such as DSD, intensity and kinetic energy is important for the prediction of soil erosion. However, not all of these rainfall characteristics are common among measured metrological parameters, so researchers have empirically linked more easily available measurements, such as rain intensity, to rain kinetic energy. Even though such relationships are important for obtaining the rarely available kinetic energy from the intensity, substantial differences exist among their reported shapes and coefficients.
In this regard, several studies of rain kinetic energy and its basic parameters, such as DSD and Vt, and its relationship with intensity, have been conducted in different countries of the world, many of them reviewed by Van Dijk et al. (Citation2002). These studies include a few that were done in African countries, such as Zimbabwe (Kinnell Citation1981), South Africa (Hudson Citation1965) and Nigeria (Kowal and Kassam Citation1976, Aina et al. Citation1977, Lal Citation1998). However, to our knowledge, the only study conducted in Ethiopia is by Nyssen et al. (Citation2005), who recommended that their resultant equation be used in the Ethiopian highlands. The relationship they established differed somewhat from the outcome of other studies, which apparently underestimated the observed kinetic energy and were not recommended to be applied to Ethiopia. These differences between the equations are partly caused by variations in measurement method, sample size, range and bias, but the main cause of variability is the differences in the rainfall generating mechanisms (Van Dijk et al. Citation2002). Orographic rain is the dominant type in Ethiopia, especially in the study area (the Central Rift Valley, CRV), where strong winds cause heavy rainfall on the windward side of the hills and mountains, while the leeward side is dry and arid. There is also a high incidence of convective rain in the region, which is characterized by short duration and high intensity, caused by strong heating of the land surface and evaporation. Because of these factors, a relationship determined in a temperate zone, where the nature of rain is different from the tropics or mountainous areas may, not work properly in a region like Ethiopia.
Since there is no single recommended equation to estimate the kinetic energy of rain from intensity that applies equally to all parts of the world, to understand the erosivity of rainstorms, there was a need to conduct a study in the CRV highlands of Ethiopia where such rainfall information is not available. Erosion is the most serious environmental problem in the region and needs urgent attention (Meshesha et al. Citation2012), but the nature of erosivity, which is the major driving factor, and its basic parameters, such as kinetic energy, intensity and DSD are poorly understood. However, such information can significantly contribute to soil erosion predictions and land degradation assessments in the region. Moreover, the extent of other regression models that have already been developed in other countries, including one established in northern Ethiopia, need to be evaluated for their applicability to the region.
Therefore, this study had the following objectives: (a) to establish a relationship between rainfall intensity and kinetic energy for the CRV highlands, (b) to understand the basic rainfall characteristics in terms of intensity, DSD and kinetic energy in the region, and (c) to evaluate erosivity potential of storm events from their basic parameters.
2 MATERIALS AND METHODS
2.1 Site description
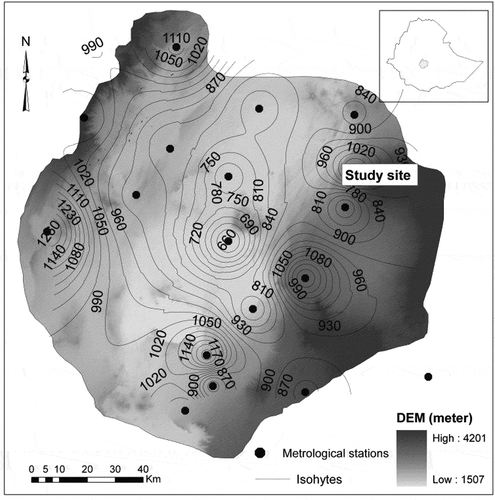
The study was conducted in the Central Rift Valley (CRV) of Ethiopia, which is located approximately between 38°05′–39°25′E and 7°06′–8°27′N (). Rainfall data collection and parameterization was specifically conducted in the highland section of the valley (near Asela town), which is located about 175 km south of Ethiopia’s capital city, Addis Ababa.
Fig. 1 Map of the study area with elevation and rainfall distribution.
The climate in the valley varies significantly along an altitudinal gradient, but is generally characterized as wet during the summer, with annual rainfall ranging between <500 mm year-1 in the lowlands and >1100 mm year-1 in the highlands, about 70–90% of the rainfall occurring from June to September, and as semi-arid (dry, cold, and windy) during the winter. Data provided by the national meteorological service show that the temperature is relatively constant throughout the year, with mean annual minimum and maximum temperatures of 13.8°C and 27.7°C, respectively.
The two dominant major soil types in the CRV are “tropepts” (found in the central portion) and “udalfs”, which are largely found in the eastern and western parts of the valley (Jansen et al. Citation2007). Tropepts soils have typical characteristics of moderately dark A horizons with modest content of organic matter. These soils are commonly found in tropical regions which have moderate to high rainfall. Udalfs soils are normally found in humid climate and are often formed under a forest cover. According to the FAO (Citation1965) system of soil classification, there are seven major soils types that are predominantly found in the CRV, including vertisols (19.2%), cambisols (17.9%), fluvisols (16.2%), regosols (15.8%), lithosols (9.5%), andosols (7.1%) and acrisols (6.1%).
2.2 Determination of the spread factor relationship
Prior to fieldwork, we performed a laboratory experiment to establish the spread factor relationship between the water drop diameter in air and the stain diameter on filter paper, by using needles of different sizes, filter paper and vacuum pump oil. The relationship is highly dependent on the physical properties of the fluid (oil), the drying conditions, the impact velocity of the droplet and the type of paper used (Wiesner Citation1895). We used two thicknesses of filter paper during the experiment, namely Whatman nos 1 and 3. First, both types of paper were dyed with methylene blue and dried in natural air at room temperature. Then, 14 needles of different sizes were mounted at a specific height (1.5 m) from the surface and water was allowed to drip from them onto both the viscous oil and sheets of filter paper. The resulting stains on the papers and the diameters of the drops on the oil were measured using a Vernier caliper and the results compared.
2.3 Raindrop size, depth and intensity measurements
A calibrated tipping bucket raingauge was levelled and properly installed on the ground to measure the intensity and depth of each rainfall event. However, the total depth measurements from the bucket were sometimes inaccurate, in particular during intense rainfall events, so a cylindrical raingauge was installed nearby (see also Section 3.1 below). For consistency in the calculation of kinetic energy, the instantaneous (specific time) intensity of each rainfall event was read from the tipping bucket, while its depth was taken from the cylindrical raingauge.
Sampling and measurement of the rain DSD were conducted in August, which is the main rainy season in the country. For the DSD sampling fieldwork, Whatman no. 1 filter paper treated with a trace of powdered dye was used to determine the drop sizes of natural rain. We exposed about 370 sheets of filter paper to rain until the stains started to overlap and used a stopwatch to measure the exposure time (from 1 to 10 s), and the stains that the drops left were photographed immediately. The stain diameter is a function of the diameter of the original raindrop. The exposure time, filter paper number and time of day were simultaneously recorded during each DSD sampling. We could collect DSD data only for events that occurred during the day, while we measured the rainfall intensity and depth during both day and night time.
2.4 Data analysis
The counting and measurement of the stain diameters from the filter paper were done using ImageJ 1.46r software (Abramoff et al. Citation2004), and conversion to drop diameter was performed using an adjusted scale. The rate and absolute kinetic energy of each rainfall event were calculated from the general equation of mass times velocity squared, by using Microsoft Excel, from the basic parameters of exposure time, sampling area, drop diameter, drop velocity and intensity. The degree of fit between variables was evaluated though regression and calculation of the Pearson correlation coefficient r. The rainfall erosivity factor R for each event was calculated from the product of the storm energy and maximum 30-min rainfall intensity, which is widely taken as a best rainfall parameter to characterize R.
3 RESULTS AND DISCUSSION
3.1 Rainfall measurements: tipping bucket vs cylinder raingauges
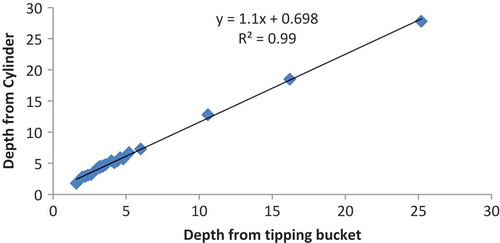
The tipping bucket raingauge was properly calibrated and installed on the ground to measure timely rainfall intensity and depth. It tips whenever the bucket stores 0.2 mm of rainfall. However, there are inaccuracies associated with tipping bucket technology, such as the time required for the bucket to tip (about 0.5 s). During a high-intensity storm this can cause a significant error in water collection and, thus, the total depth of the event might be underestimated (Habib et al. Citation2001, Ciach Citation2003). The other limitation of the gauge is that the amount of precipitation required to tip the bucket sometimes makes it difficult to define the start and end times of light rainfall events. To compensate for these limitations, an additional cylindrical raingauge was installed nearby. Rain was caught by a funnel, and then directed into a cylindrical plastic collector. Measurements were conducted immediately after each rainfall event by pouring the catch into a gadget that measured the rain depth.
In the measured rainfall depths, a variation range of 0.65–2.4 mm was obtained between the tipping bucket and cylindrical raingauges; higher variations were observed for relatively higher intensities. Therefore, using a tipping bucket raingauge to measure rainfall depth may not be advisable in a tropical region where rainfall events are characteristically short and of high intensity (>20 mm h-1); or, if the tipping bucket is to be used to measure rainfall depth for high-intensity events, the equation shown in should be used to obtain a more accurate value, otherwise the actual depth might be underestimated. This is especially important for measuring kinetic energy, because even a small variation in total depth can have a notable effect on the calculated absolute energy value.
Fig. 2 Relationship between the tipping bucket and cylindrical raingauge for the measurement of depth.
Despite its limitations, the tipping bucket raingauge has the major advantage of providing continuous and timely information about the rain intensity (light, medium, or heavy). Moreover, once it is installed it can operate by itself for a long time without being affected by temperature, which can affect the evaporation rate, or requiring close monitoring; thus, it saves time and energy as compared to the normal cylindrical gauge.
3.2 Daily rainfall pattern
Various researchers use different definitions for rainfall events and durations. Taking the character of tropical rainfall into consideration, it has been considered that one event should have a duration of at least 15 min and be separated from other events by at least 30 min (Nyssen et al. Citation2005). Accordingly, in the CRV, the minimum rainfall duration recorded by the tipping bucket raingauge was 19 min and the maximum was 6.5 h. During the study season, the tipping bucket raingauge recorded 29 rain events, of which 24 were considered in this study, whereas the rest that were excluded had very light intensity or less than 15 min duration. These events are classified by their start time and are summarized in .
Table 1 Classification of rain events based on their time of start in the day.
The largest fraction of the rain events occurred in the afternoon or morning, accounting for 38% and 33% of the events, respectively, while the fewest were in the evening (13%). Afternoon rainfall had the shortest average duration, with a higher average depth, and provided the largest proportion of total rainfall. This indicates that afternoon rainfall is brief but with a high intensity; hence, most of the soil erosion phenomena in the region could be related to afternoon rains. This daily rain pattern with a dominance of afternoon rains is due to the influence of convective rains in the region, which is caused by strong heating of the Earth’s surface in the morning (Krauer Citation1988).
3.3 Rainfall intensity
The rainfall events recorded by the tipping bucket raingauge showed varying characteristics. Generally, the rainfall intensity in the region was not very high, except in the afternoon, as 70% of the total events had intensity less than 8 mm h-1, 8% between 8 and 15 mm h-1, 13% between 15 and 30 mm h-1, and 8% greater than 30 mm h-1 (). These results are similar to the proportions of intensity classes reported in Nyssen et al. (Citation2005). Because August is the main month of the rainy season, both in the study area and in the entire country, the intensity and other characteristics of the rainfall in other months of the rainy season are not expected to be different from what was observed and is reported here.
Fig. 3 Average instant intensity obtained from the tipping bucket vs normal intensity of each rainfall event.
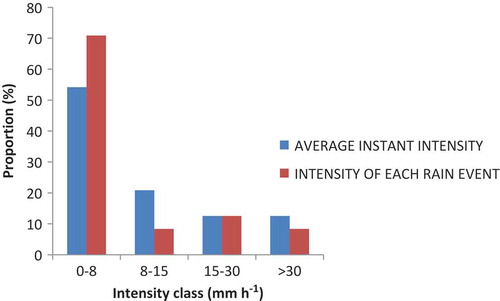
One drop per minute in the tipping bucket raingauge corresponds to 12 mm h-1 intensity. The average instant intensity was calculated from tipping bucket data. It was then compared with the normal intensity of the same event as calculated from its total depth and duration. The trend of the proportional coverage of the intensity class was the same for both values, but in most cases the average instant intensity was slightly higher than the normal rain intensity. For the calculation of kinetic energy content, the instant intensity was read from the tipping bucket raingauge and the total depth was obtained from the cylindrical raingauge.
There were distinct variations in the degree of intensity among events, especially between morning and afternoon rainfall (). Morning rainfall (events 1 and 2) had low intensity and longer duration, while afternoon rainfall (events 3 and 4) was of short duration and high intensity (). These characteristics hold true for most of the recorded events and are in agreement with the results of Nyssen et al. (Citation2005) for northern Ethiopia (Hagere Selam area). The maximum intensities of different time intervals were calculated for 13 selected events using the continuous rainfall data obtained from the tipping bucket raingauge ().
Fig. 4 Typical morning and afternoon rainfall characteristics, where events 1 and 2 are morning and 3 and 4 are afternoon rainfall events; I = intensity, V = rainfall depth, and T = time/duration.
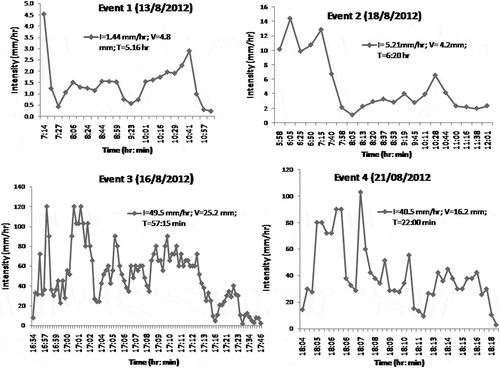
Table 2 Maximum intensities of different time intervals.
The daytime rainfall events from which the DSD samples were obtained were used in the analysis of the maximum intensity at different time intervals. For all events, the maximum intensities for 5- and 10-min intervals were less than the threshold values of 76 and 36 mm h-1, respectively, set by Greer (Citation1971). However, for the 30-min case, a few events were found with values greater than the threshold set for the interval (25 mm h-1). This has significant implications for soil erosion predictions that take into consideration storm energy and the maximum 30-min rainfall intensity. According to Greer (Citation1971), an event with rainfall intensity greater than the threshold value can be considered an extreme event that can cause immense erosion. Nyssen et al. (Citation2005) reported that for almost all intervals the maximum intensities were greater than the threshold values.
3.4 Established spread factor relationship
Wiesner (Citation1895) was among the first to use absorbent paper dusted with a water-soluble dye to analyse the distribution of drop sizes in natural rainfall, and several other researchers have used this technique (e.g. Atlas Citation1953, Kelkar Citation1959, Hall Citation1970, Brandt Citation1988, Van Dijk et al. Citation2002) to collect DSD samples. However, almost all have used different types and sizes of filter paper, so their relationship equations between stain size and drop diameter are different. Moreover, the relationship equations for different types of filter paper are rarely available in published works, although the stain sizes of identical drops on different types of papers can differ significantly. Thus proper calibration must be done to estimate the original drop size. We therefore established the relationships between stain size and drop diameter for the filter paper types that we preferred for our purpose, namely Whatman nos 1 and 3, the latter having twice the thickness of the former ().
Fig. 5 Relationship between stain size and drop diameter for two types of filter paper (dried in open air).
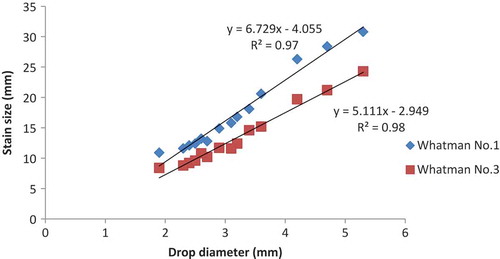
The spread factor relationships can be expressed as linear, polynomial, logarithmic, or power functions. In our case, a linear equation provided the best fit. Generally, drops made relatively larger stains on the Whatman no. 1 paper.
3.5 Rain DSD and intensity
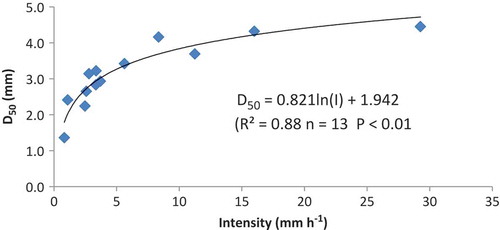
Understanding the characteristics of the DSD and drop velocity is essential for the estimation of the kinetic energy and erosivity potential of rain. However, it is always the most difficult factor to be determined in the field and analysed. Calibration curves () or adjusted scales were used to convert all filter paper stain diameters to their drop diameters. In this way, a total of 11 107 drop samples collected on 370 sheets of filter paper were converted and analysed. The DSD is best expressed by the median volume drop diameter D50, the value at which 50% of the rain drops have a greater diameter and 50% are less. Generally, a rain event with a higher D50 value is more intense and causes more erosion than one with a lower value. For the selected events, the measured drops were classified and analysed according to their size and D50 values were determined for corresponding intensity of each event ().
Table 3 Median volume drop diameter (D50) and KEvol of each rain intensity.
At most rain intensities, the value of D50 in the CRV area is somewhat larger than that observed in other countries, for instance, in Australia (Van Dijk et al. Citation2002), Hawaii (Blanchard Citation1953), Spain (Sempere-Torres et al. Citation1992), Belgium (Salles et al. Citation2002), Taiwan (Lu et al. Citation2008) and the Philippines (Fornis et al. Citation2004); instead it is very close to the value Nyssen et al. (Citation2005) reported for the northern part of Ethiopia. In other words, rain in the CRV region falls in relatively larger-sized drops and thus can cause more splash erosion than in the other listed countries for the same intensity rainfall events. The larger raindrops, which carry high kinetic energy and erosive power, might contribute significantly to the reportedly serious soil erosion problem in the area.
A good fit in the relationship between the rainfall intensity and D50 was found (). It can be seen that D50 increases with increasing rainfall intensity.
Fig. 6 Rain intensity (I) vs median volume drop diameter (D50).
3.6 Rainfall kinetic energy
The rainfall kinetic energy can be expressed in two forms: kinetic energy as a function of time (KEt, J m-2 h-1) and kinetic energy as a function of volume (KEvol, J m-2 mm-1) (Kinnell Citation1981). Usually the kinetic energy of rain is expressed as a function of volume, that is, the amount of energy per unit volume, because manual methods (e.g. filter paper and flour pellets) have been widely used to derive the kinetic energy from DSDs and thus the exposure or sampling time is not precisely known (especially to a precision of microseconds), making it difficult to determine KEt accurately (Salles et al. Citation2002). Moreover, rainfall depth data are available at most metrological stations and so it is relatively simple to calculate the total kinetic energy from the product of the total rainfall depth and rate of kinetic energy (KEvol). Therefore, the kinetic energy rate is widely represented in the form of KEvol rather than KEt (Wischmeier and Smith Citation1978, Kinnell Citation1981, Salles et al. Citation2002, Fornis et al. Citation2004, Nyssen et al. Citation2005).
The value of KEt is estimated from DSD information using the following equation, which is derived from the basic concept of kinetic energy, i.e. half of the product of mass and velocity squared:
Because they are related through the rainfall intensity, KEvol can be derived from KEt (Salles et al. Citation2002) by using the following equation:
The drop fall velocity was estimated from equation (3) of Gunn and Kinzer (Citation1949), which was established based on experimental data and is reasonably applicable to natural rainfall regardless of geographical location:
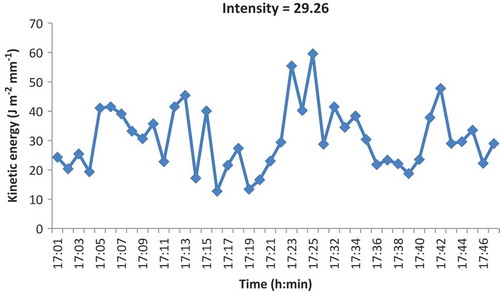
Fig. 7 Kinetic energy (KEvol) variations through time within storm.
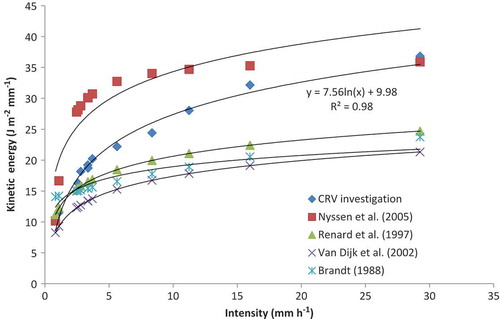
A regression between KEvol and intensity can be done on a linear or a logarithmic basis, as indicated in different studies. The best-fit equation for our study area () was found to be logarithmic rather than linear, as follows:
Fig. 8 Our observation of intensity vs kinetic energy compared to equations from other studies.
3.7 Factors that contribute to variation in the relationship between intensity and kinetic energy
There are certain factors that are responsible for variations in the relationships found in different studies that need to be addressed. Van Dijk et al. (Citation2002) noted that differences in measurement techniques and procedures are one reason for variations in the established relationships. Various authors have used different methods to collect DSD samples and measure kinetic energy; each has its own drawbacks and sources of errors, which might have contributed to some of the differences between the studies. Hall (Citation1970) indicated that calibration of the filter paper method is not straightforward and, hence, results from measurements using that technique may be affected by small droplets through the splashing of large drops. In contrast, measurements from a distrometer, a popular DSD sensor, can be seriously affected by wind speed and direction (Kinnell Citation1973, Illingworth and Stevens Citation1987), which can affect the striking velocity of raindrops (Kinnell Citation1976, Rowland Citation1976) and the drop size before hitting the surface. For example, among those studies we compared with our observations, Nyssen et al. (Citation2005) used blotting paper, Brandt (Citation1988) and Van Dijk et al. (Citation2002) used filter paper; and others used sensors, flour pellets, photographic methods, or radar to determine the DSD.
The second major cause for the variations is factors related to limited or biased samples. Some of the studies considered only limited observations that focused on high intensities, such as the study in Zimbabwe (Hudson Citation1971), which was limited to intensities greater than 19 mm h-1. Other studies were based on smaller numbers of observations and samples, for example, when filter paper and flour pellet techniques are used, the number of observations of individual storms as well as in aggregate is often low (Van Dijk et al. Citation2002). Moreover, a limited sample range and sampling strategy may also influence the results if measurements are not made uniformly throughout a storm; concentrating observations and measurements at the beginning and end of a storm can affect the results because of DSD variation within a storm. In our observations, all levels of intensities (0.83–29.26 mm h-1) were considered in the study, with sample sizes between 18 and 42 sheets of filter paper (565–1398 drops) per event. Moreover, to minimize such errors, samples were taken consistently throughout the storm and larger numbers of samples were taken during times of high intensity than for regular and low-intensity events.
The third major and highly responsible cause of differences is the nature of the rainfall character and type of storm. In addition to the errors introduced during measurement and sampling, some of the observed differences in the relationship were caused by variations in rainfall characteristics. Rosewell (Citation1986) used the same electromechanical distrometer to measure rainfall kinetic energy at two locations in eastern Australia and obtained two statistically different relationships. Similarly, McIsaac (Citation1990) used the same high-speed camera at various locations to measure kinetic energy and reported notable differences between locations. Therefore, the rainfall generating mechanism (stratiform, conventional, or orographic) is also a major contributing factor to the variations; for example, rainfall in semi-arid and tropical areas includes large thunderstorms that cause larger drop sizes and kinetic energy than that in temperate zone areas where frontal rainfall types are dominant. In the CRV area, and in Ethiopia as a whole, convectional and orographic are the principal rainfall types. Convectional rainfall is better known for its intensity and short duration than is stratiform rainfall. Orographic rainfall, which is very common in mountainous areas like the Ethiopian highlands, is also recognized by its intense character. Both rainfall types have high intensity with large raindrop sizes and, hence, result in stronger kinetic energy than reported at other places.
In general, there is no a single KE vs I equation that can be recommended for all areas. Van Dijk et al. (Citation2002) compiled 17 worldwide studies and derived their own relationship by combining them with their own measurements, which could be applicable in Australia. Hence, investigations are still ongoing through different methods, and our result, which is the second in the country’s history, will make its own contribution; in particular, it could be applicable to the CRV area and other Ethiopian highlands. Despite a small variation in the KEvol prediction at lower intensities, most of our findings such as the minimum, maximum, and average values of the intensity, D50, and KEvol are closer to the findings of Nyssen et al. (Citation2005) than to studies in other countries. This might be attributed to similarity in types of rainfall and methods used to collect DSD samples and calculate the kinetic energy.
4 EROSIVITY POTENTIAL OF EVENTS
The rainfall erosivity factor R evaluates the ability of rain to erode unprotected soils (Renard et al. Citation1997). The best rainfall parameter to characterize R in the tropics is expressed by the product of the storm energy KE and the maximum 30-min rainfall intensity I30 (Wischmeier and Smith Citation1978) as follows:
Table 4 Erosivity analyses for recorded rainfall events (EI30), in which R is the rainfall erosivity, KE is rainfall kinetic energy, and I30 is the maximum 30-min rainfall intensity of the event.
As can be seen, R varies for different events according to the maximum intensity within 30 min and kinetic energy of the storm. Event 5 is an extreme event with a maximum erosivity value of 72.9 MJ mm ha-1 h-1 and for which the maximum 30-min intensity and total kinetic energy were the highest. Such events are rare, but they can cause tremendous erosion. The event occurred for a duration of less than one hour but had the highest erosivity because it was so intensive and had large drop sizes.
4.1 Rain erosivity vs soil erodibility
The soil erodibility factor K refers to the resistance of soil to erosion while the erosivity indicates the aggressiveness of rainfall to cause erosion. It is thus the interaction of the two that determines the unit for soil erosion (t ha-1). The experimental plot that was used to determine the value of K for different soils was 22.1 m long, had a slope of 9%, and was in a continuously tilled fallow condition (without cover or management), with upslope and downslope tillage of the land (Wischmeier and Smith Citation1958, Citation1978). The variation of K for different soils comes from the basic properties of soils, such as texture, permeability, and the percentage of organic matter, silt and sand. Generally, K represents the rate of soil loss per unit of the rainfall erosivity index (MJ mm ha-1 h-1) in a given plot of land and has a unit of t ha h MJ-1 mm-1 ha-1 (Wischmeier and Smith Citation1978).
The dominant soil types of the CRV area were taken, and the corresponding soil loss amounts generated by the measured rainfall erosivity R of the events were calculated (). It should be noted that the erosion in the particular soils is under conditions of fallow (unprotected soil), steep slope (about 9%), and no cover or management of the surface. Hence, if such conditions are altered in an actual environment, the soil loss amount of a particular soil type might also change.
Fig. 9 Soil erosion vs soil erosivity for different soil types and K values.
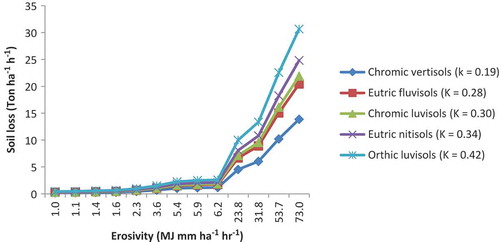
As the results indicate, the threshold erosivity amount of the dominant soil types under the given conditions is about 3 MJ mm ha-1 h-1 while erosivity above 7 MJ mm ha-1 h-1 could produce substantial erosion on all soil types. But under different (better) environmental conditions the threshold value might be higher. In general, our result showed that events with erosivity values greater than 7 MJ mm ha-1 h-1 can produce considerable erosion in all soil types; hence, improving cover and management practices is a key to reducing soil loss.
5 CONCLUSIONS
Our study was conducted in the CRV area of Ethiopia, where characteristic rainfall data are scarce and water erosion is a serious problem. The filter paper technique and a tipping bucket raingauge were used to characterize rainfall intensity, drop size distribution (DSD), and kinetic energy.
For nearly all rainfall intensities, the values of the corresponding median volume drop diameter, D50, and the rate of kinetic energy, KEvol, were higher than those reported in other countries and were close to the results of the only other study conducted in Ethiopia. We attribute this result to the nature of the region’s rain, which is dominated by convectional events that occur in the afternoon and are characterized by high intensity and short duration. The larger D50 in the region might play a role in the erosion problem through a strong splashing effect when large drops hit the soil surface. We calculated the amount of soil erosion from the storm energy and the maximum 30-min intensity for different soil types with different values of the soil erodibility factor K, and determined a threshold value of about 3 MJ mm ha-1 h-1. We found out that values above 7 MJ mm ha-1 h-1 could cause significant erosion on all soil types. The soil loss was calculated under conditions of fallow (unprotected soil), steep slope (about 9%) and no cover and managements practice on the surface. Hence, under actual environment if such conditions are altered the soil loss amount on the particular soil types will be also changed accordingly. We established a relationship between rainfall intensity and kinetic energy that is applicable in the CRV area and other Ethiopian highlands.
This study is the second in the country to attempt to determine erosivity from rain drop size and intensity; hence, the established relationships will contribute significantly to upcoming related research in the area. Because rainfall intensity data can be obtained easily from metrological stations but information related to kinetic energy is rarely available, such established equations can help in the calculation of storm kinetic energy simply from the intensity data of rainfall events. However, since small sample sizes and the manual collection of rain drops are the main limitations of our research that might have an impact on the accuracy of our results, additional study using modern sensors and increased sample sizes is essential and recommended.
REFERENCES
- Abramoff, M.D., Magalhaes, P.J., and Ram, S.J., 2004. Image processing with Image J. Biophotonics International, 11, 36–42.
- Aina, P.O., Lal, R., and Taylor, G.S., 1977. Soil and crop management in relation to soil erosion in the rainforest of Western Nigeria. Ankeny, IA: Soil Conservation Society of America, 75–82.
- Atlas, D., 1953. Optical extinction by rainfall. Journal of Metrology, 10, 486–488.
- Blanchard, D.C., 1953. Raindrop size distribution in Hawaiian rains. Journal of Meteorology, 10, 457–473. doi:10.1175/1520-0469(1953)010<0457:RSDIHR>2.0.CO;2.
- Brandt, C.J., 1988. The transformation of rainfall energy by a tropical rain forest canopy in relation to soil erosion. Journal of Biogeography, 15, 41–48. doi:10.2307/2845044.
- Ciach, G.J., 2003. Local random errors in tipping-bucket rain gauge measurements. Journal of Atmospheric and Oceanic Technology, 20, 752–759. doi:10.1175/1520-0426(2003)20<752:LREITB>2.0.CO;2.
- FAO (Food and Agriculture Organisation), 1965. Survey of the Awash River basin. Vol. II. Rome: FAO.
- Fornis, R.L., Vermeulen, H.R., and Nieuwenhuis, J.D., 2004. Kinetic energy–rainfall intensity relationship for Central Cebu, Philippines for soil erosion studies. Journal of Hydrology, 300, 20–32.
- Greer, J., 1971. Effect of excessive-rate rainstorms on erosion. Journal of Soil Water Conservation, 5, 196–197.
- Gunn, R. and Kinzer, G.D., 1949. The terminal velocity of fall for water droplets in stagnant air. Journal of Meteorology, 6, 243–248. doi:10.1175/1520-0469(1949)006<0243:TTVOFF>2.0.CO;2.
- Habib, E., Krajewski, W., and Kruger, A., 2001. Sampling errors of tipping-bucket rain gauge measurements. Journal of Hydrological Engineering, 6 (2), 159–166.
- Hall, M.J., 1970. Use of the stain method in determining the drop-size distributions of coarse liquid sprays. Transactions of the ASAE, 13, 33–37. doi:10.13031/2013.38528.
- Hudson, N., 1965. The influence of rainfall mechanics on soil erosion. Thesis (MSc). Cape Town.
- Hudson, N., 1971. Soil conservation. Great Britain: Billing and Sons Ltd, 320.
- Illingworth, A.J. and Stevens, C.J., 1987. An optical disdrometer for the measurements of raindrop size spectra in windy conditions. Journal of Atmospheric and Oceanic Technology, 4, 411–421.
- Jansen, H., et al., 2007. Land and water resource assessment in the Ethiopia Central Rift Valley. Alterra-rapport 1587. Wageningen: Alterra.
- Joss, J. and Waldvogel, A., 1967. Ein spektrograph fur niederschlagstropfen mit automatischer Auswertung. Pure and Applied Geophysics PAGEOPH, 68, 240–246. doi:10.1007/BF00874898.
- Kelkar, V.N., 1959. Size distribution of raindrops-Part II. Indian Journal of Meteorology and Geophysics, 4, 323–330.
- Kinnell, P., 1981. Rainfall intensity kinetic-energy relationships for soil loss prediction. Soil Science Society of America Journal, 45 (1), 153–155. doi:10.2136/sssaj1981.03615995004500010033x.
- Kinnell, P.I.A., 1973. The problem of assessing the erosive power of rainfall from meteorological observations. Soil Science Society of America Journal, 37, 617–621. doi:10.2136/sssaj1973.03615995003700040039x.
- Kinnell, P.I.A., 1976. Some observations on the Joss-Waldvogel rainfall disdrometer. Journal of Applied Meteorology, 15, 499–502. doi:10.1175/1520-0450(1976)015<0499:SOOTJW>2.0.CO;2.
- Kinnell, P.I.A., 1980. Rainfall intensity- kinetic energy relation ships for soil loss prediction. Soil Science Society of America Proceedings, 45, 153–155.
- Kowal, J.M. and Kassam, A.H., 1976. Energy and instruments intensity of rainstorms at Samary, northern Nigeria. Tropical Agriculture, 53, 185–198.
- Krauer, J., 1988. Rainfall, erosivity and isoerodent map of Ethiopia. Soil Conservation Research Project. Berne: University of Berne, Research Report 15. p. 132.
- Lal, R., 1998. Drop size distribution and energy load of rainstorms at Ibadan, Western Nigeria. Soil and Tillage Research, 48, 103–114. doi:10.1016/S0167-1987(98)00109-3.
- Laws, J.O. and Parsons, D.A., 1943. The relation of raindrop size to intensity. Transactions, American Geophysical Union, 24, 452–460. doi:10.1029/TR024i002p00452.
- Lu, J.Y., et al., 2008. Number and volume raindrop size distributions in Taiwan. Hydrological Process, 22, 2178–2158.
- McIsaac, G.F., 1990. Apparent and atmospheric influneces on raindrop sizes and rainfall kinetic energy. Journal of Soil and Water Conservation, 45, 663–666.
- Meshesha, D.T., et al., 2012. Dynamics and hotspots of soil erosion and management scenarios of the Central Rift Valley of Ethiopia. International Journal of Sediment Research, 27, 84–99. doi:10.1016/S1001-6279(12)60018-3.
- Nyssen, J., et al., 2005. Rainfall erosivity and variability in the Northern Ethiopian Highlands. Journal of Hydrology, 311, 172–187. doi:10.1016/j.jhydrol.2004.12.016.
- Renard, K.G., et al., 1997. Predicting soil erosion by water: a guide to conservation planning with the Revised Universal Soil Loss Equation (RUSLE). Agriculture Handbook 703. Washington, DC: United States Department of Agriculture, p. 404.
- Rosewell, C.J., 1986. Rainfall kinetic energy in eastern Australia. Journal of Climate and Applied Meteorology, 25, 1695–1701.
- Rowland, J.R., 1976. Comparision of two different raindrop disdrometers. Preprints, In: 17th Radar Meteorology Conference, 26–29 October, Seattle, WA. American Meteorological Society Publ. no. A78-17004 04-47, pp. 398–404.
- Salles, C. and Poesen, J., 1999. Performance of an optical spectro pluviometer in measuring basic rain erosivity characteristics. Journal of Hydrology, 218, 142–156. doi:10.1016/S0022-1694(99)00031-1.
- Salles, C., Poesen, J., and Sempere-Torres, D., 2002. Kinetic energy of rain and its functional relationship with intensity. Journal of Hydrology, 257, 256–270.
- Sempere-Torres, D., et al., 1992. Quantification of soil detachment by raindrop impact: performance of classical formulae of kinetic energy in Mediterranean storms. In: Proceedings of the Oslo Symposium, August, Oslo. IAHS Publ. no. 210.
- Van Dijk, A., Bruijnzeel, L., and Rosewell, C., 2002. Rainfall intensity—kinetic energy relationships: a critical literature appraisal. Journal of Hydrology, 261, 1–23. doi:10.1016/S0022-1694(02)00020-3.
- Wiesner, J., 1895. Beiträge zur Kenntnis des tropischen Regens.” (Contributions to the knowledge of the tropical rain). Sitz. Ber. Math. Nat. Akad. Wiss. Kl. Wien, 104, 1397–1434.
- Wischmeier, W. and Smith, D., 1958. Rainfall energy and its relationship to soil loss. Transaction AGU, 39, 285–291. doi:10.1029/TR039i002p00285.
- Wischmeier, W. and Smith, D., 1978. Predicting rainfall erosion losses, agricultural handbook 537. Washington, DC: Science and Education Administration, USDA.