
Abstract
Water harvesting and artificial recharge have been a traditional solution to water scarcity problems in the arid and semi-arid Middle East for thousands of years. These techniques are increasingly being encouraged, and recently there has been renewed interest to find improved methods for water harvesting and artificial recharge in many arid countries. In this study, water balance calculations and groundwater modelling were utilized to investigate the performance and hydrological function of an improved water harvesting technique, referred to as the floodwater spreading system, in arid Iran. The recharge amount in the floodwater spreading system studied varied from a few hundred thousand cubic metres per month during drought periods to about 4.5 × 10⁶ m3 per month during rainy periods. However, the gain through artificial recharge was diminished by excessive groundwater abstraction by numerous newly drilled pumping wells. Hence, the groundwater declined in spite of the artificial recharge. However, this research showed that, with balanced pumping, the floodwater spreading system could be an efficient way to increase groundwater resources in arid and semi-arid areas. Further research is needed to optimize the floodwater harvesting system to improve its management in view of the uncertain frequency and magnitude of inflow.
Editor D. Koutsoyiannis; Associate editor S. Faye
Résumé
La récupération de l’eau et la recharge artificielle ont été la réponse traditionnelle aux problèmes de pénurie d’eau dans les zones arides et semi-arides du Moyen-Orient depuis des milliers d’années. Ces techniques sont de plus en plus encouragées, et récemment il ya eu un regain d’intérêt pour trouver de meilleures méthodes pour la récupération de l’eau et la recharge artificielle dans de nombreux pays arides. Dans cette étude, des calculs de bilan hydrique et la modélisation des eaux souterraines ont été utilisés pour étudier la performance et la fonction hydrologique d’une technique améliorée de récupération d’eau, le système d’épandage des eaux de crue dans l’Iran aride. Le volume de la recharge dans le système d’épandage des crues étudié varie de quelques centaines de milliers de mètres cubes par mois pendant les périodes de sécheresse à environ 4,5 ×10⁶ m3 par mois durant les périodes pluvieuses. Le gain acquis grâce à la recharge artificielle a, cependant, été diminué par le pompage excessif des eaux souterraines par de nombreux puits nouvellement forés. Ainsi, la nappe a baissé en dépit de la recharge artificielle. Cependant, cette étude a montré que, avec un pompage équilibré, le système d’épandage des crues pourrait être un moyen efficace d’augmenter les ressources en eaux souterraines dans les zones arides et semi-arides. Des recherches complémentaires sont nécessaires pour optimiser le système de récupération des crues pour améliorer la gestion face aux incertitudes sur la fréquence et l’ampleur des flux entrants.
1 INTRODUCTION
Groundwater depletion in arid and semi-arid areas is of increasing concern. Especially in the arid Middle East, short-term, high intensity rainfall with resulting flash flood runoff often constitutes most of the potential water input to agriculture and water supply. In contrast, severe drought and over-grazing of rangelands has caused huge and destructive floods over the last few decades. Less water infiltration into the soil results in poor vegetation cover and more water lost from these vulnerable ecosystems. At the same time, increasing water demand due to increasing population has intensified the water shortage problems and put further stress especially on groundwater resources, which require proper management in order to harvest the flash flood phenomenon (Mehrvarz and Kalantari-Oskouei Citation2007), the main source of freshwater in the arid regions.
A flash flood can be optimally harvested and stored in the ground through artificial recharge and water harvesting (WH) techniques. Water harvesting has traditionally been practiced in arid and semi-arid regions (Bruins et al. Citation1986, Lavee et al. Citation1997, Li and Gong Citation2002, Prinz and Singh Citation2003, Nasri et al. Citation2004, Barghouth and Al-Sa`ed Citation2009). Extensive rainwater harvesting and artificial recharge have been used for at least 4000 years in the Middle East and the Mediterranean region (Stiefel et al. Citation2009). The main objective of WH techniques is to artificially recharge groundwater (Keller et al. Citation2000, Kumar et al. Citation2006, Stiefel et al. Citation2009, Oblinger et al. Citation2010) and to increase crop production and yield by increasing groundwater availability for farming (Glendenning and Vervoort Citation2010) and spate irrigation (Mehari et al. Citation2005, NWP Citation2007, Kowsar Citation2008). Since around 1950, there has been an increasing interest in WH techniques (Critchley et al. Citation1991, Bouwer Citation1996, Prinz and Wolfer Citation1999, Tahmasebi Citation2009). Water harvesting has become an increasingly important issue, with a renewed interest in research and implementation of ancient WH systems used for runoff farming, e.g. in the Negev Desert (Evenari et al. Citation1971). This issue was addressed by the extensive review of Boers and Benasher (Citation1982), who revealed an awareness of the increasing need for WH and recognition of its potential. Despite the long and successful history of these systems, little is still known about their function and effect on hydrological processes in dry areas (Ouessar et al. Citation2009).
The WH systems can be classified into micro- and macro-catchment methods (Araus Citation2004). A local solution is passive floodwater collection that collects and distributes the floodwater over land areas for artificial recharge to the groundwater. Floodwater harvesting is known as macro-catchment WH (Prinz and Singh Citation2003), in which runon from upland areas is collected and redistributed over a smaller area to artificially recharge the groundwater (Barksdale and Debuchananne Citation1946, Mehrvarz and Kalantari-Oskouei Citation2007), providing adequate water supply for crop growth (Mehdizadeh et al. Citation1978, Critchley et al. Citation1991, Raes et al. Citation2008, Wisser et al. Citation2010) and flood mitigation (Arzani Citation2010). Floodwater harvesting can be used to minimize water loss in areas with flash floods and to augment water supplies in watershed systems without surface reservoirs (Sekar and Randhir Citation2007). Without large surface reservoirs there will be smaller evaporation losses. Thus, techniques are needed to increase the infiltration surface and residence time of surface water so that the maximum amount of water can infiltrate and augment the groundwater storage (Bhattacharya Citation2010). Therefore, more research is needed on floodwater harvesting and its properties to determine its potential to maximize the recharge (Naderi et al. Citation2000).
Floodwater harvesting and artificial recharge by water spreading have been practiced at 36 multipurpose floodwater spreading (FWS) sites in Iran since 1983. These sites represent an inexpensive method for flood mitigation and artificial recharge of aquifers that results in a large economic return for a relatively small investment (Li and Gong Citation2002, Ghayoumian et al. Citation2005). Due to scarce water resources in the Gareh-Bygone Plain (GBP) in arid south Iran, an improved method of FWS was established between 1983 and 1987 which included 1400 ha (increased to 2000 ha in 1996) to improve the groundwater quantity. Groundwater is the main source of freshwater in the GBP and inhabitants exploit groundwater by pumping from wells for drinking and irrigation purposes. Accordingly, the number of legal and illegal pumping wells in the area has increased to over 120, about 10 times the number in 1983 (Kowsar Citation2005). Despite the artificial recharge by FWS, over-exploitation of groundwater has led to a groundwater table drop in the area of about 8 m (in some areas more than 12 m) during the last 10 years (Hashemi et al. Citation2012). In addition, salt water intrusion into the aquifer from the Shur River of Jahrom, located at the western border of the GBP, and soil salinization caused by irrigation with saline water have further resulted in deterioration of crop production. This has caused a mass city-ward migration of semi-nomadic people (Kowsar Citation2008). At present, the average groundwater depth in farmland areas of the GBP is about 25 m below ground surface, which is close to the bedrock.
In view of the above, the objective of the present study was to evaluate the performance and hydrological function of the FWS system in the GBP. In view of the potential of the FWS system, a particular motivation was to arrive at an assessment of sustainable pumping rates of groundwater. This was achieved by using data observed over a 14-year period, together with extensive hydrogeological modelling and water balances.
2 MATERIALS AND METHODS
2.1 Experimental area
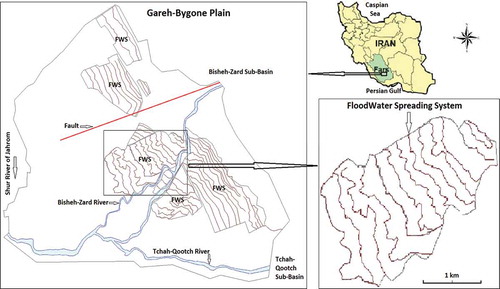
The GBP is an alluvial plain covering an area of 6000 ha located in Fars province, 190 km southeast of Shiraz city (). The plain extends between latitudes 28°34′–28°41′N and longitudes 53°52′–54°00′E, at an altitude of 1140 m a.s.l. The landscape is gently sloping on a red clay bedrock of the Agha-Jari formation over which the alluvium has been deposited. The thickness of the alluvium ranges from zero by the foothills to 43 m at the centre of the plain. Fine sand and gravel form the upper 12 m of thick alluvium. Smaller lenses consist of medium to coarse sand, gravel and stone up to 40 cm in diameter (Kowsar and Pakparvar Citation2004). The average thickness of the aquifer is about 30 m and soil texture is mainly sandy loam.
Fig. 1 Location of study area and floodwater spreading system in Iran. The figure shows constructed embankments following the topography.
There are four villages (Bisheh-Zard, Rahim-Abad, Tchah-Dowlat and Ahmad-Abad) with about 395 households and a total population of 2173 persons in the GBP (Ahmadvand and Karami Citation2009). Due to the FWS project, the area of irrigated farmland has increased eight-fold since 1983 to 1193 ha (Kowsar Citation2008). The region is rural and before the FWS project the residents practised traditional animal husbandry, but subsequently converted to agriculture. At present, over 83% of the households are dependent primarily on agriculture (Ahmadvand and Karami Citation2009).
The major natural vegetation cover is a mixture of trees, shrubs and grass (grass cover in late winter and early spring only). There are also about 100 ha of planted Eucalyptus (mainly Eucaliptus camaldulensis) and Acacia forest. The forest was established at the same time as the FWS system to reduce wind erosion and stabilize the soil surface.
2.2 Hydrological characteristics
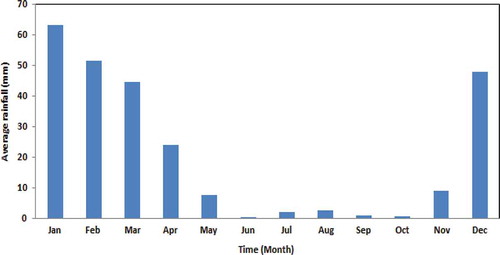
The climate of the study area is dry and hot with a mean annual rainfall of 255 mm year-1 and 2860 mm year-1 class-A pan potential evaporation. The rainfall pattern is influenced by the Mediterranean synoptic system moving from west to east across the country. Most of the rain falls in late autumn and particularly in winter (Raziei et al. Citation2005). Typically, rain falls after long dry periods as sudden storms with heavy rainfall resulting in flash floods. December–March is the rainy period and June–October is the dry period (), which coincides with the cultivation stages for most crops in the region making agriculture difficult in the area.
Fig. 2 Average monthly rainfall for Baba-Arab raingauge station from 1972 to 2007.
There are two ephemeral rivers in the study area, namely the Bisheh-Zard and the Tchah-Qootch, which discharge from two upper inter-mountain watersheds (Bisheh-Zard and Tchah-Qootch sub-basins) of area 192 and 171 km2, respectively (). These rivers join in the lower southeastern part of the GBP. The two ephemeral rivers are the main source of incoming surface water to the GBP. It is estimated that, on average, about 30% of the floodwater from both rivers is diverted to the FWS system to artificially recharge the groundwater. The remaining water is discharged into the saline Shur River of Jahrom, an effluent perennial stream that flows along the western border of the GBP. Before the FWS system was established, all flash floods were diverted into the Shur River. Consequently, the water was contaminated with salt and, hence, was unsuitable for downstream irrigation purposes. Flood duration usually varies between 2 and 40 h. It should be noted that the Tchah-Qootch River is located at the southern border of the GBP and, due to the hydraulic gradient of the plain, the natural recharge of this river does not contribute to aquifer recharge. However, water that is diverted to the FWS system by means of a diversion dam and conveyance channel is taken into account in this study.
The other source of water for the GBP is water that recharges to the aquifer via a fault across the unconfined aquifer along a northeast to southwest direction. This fault passes through the upper sub-basin (Bisheh-Zard), splits the GBP (), and creates a hydraulic groundwater connection between the upstream and the GBP (Hashemi et al. Citation2012). Based on modelling results, the northern part of GBP is greatly influenced by water constantly discharged through a fault that lies transverse to the area. This is the main natural source of incoming water to the GBP. In contrast, in the south and southwestern part of the GBP, the groundwater discharges to lower lying aquifers. Generally, the groundwater flow direction in the study area is from north to south/southwest, with average hydraulic conductivity of less than 1 m d-1 (Hashemi et al. Citation2012, Citation2013). The hydraulic properties of the aquifer were determined from pumping test analysis (Hashemi Citation2009). Transmissivity (T), specific yield (Sy), and specific storage (Ss) for the GBP are about 0.29 m2 min-1, 0.078 and 0.002, respectively.
2.2.1 Floodwater spreading system
To find appropriate regions for establishing a FWS system, factors such as geomorphology, geology, aquifer type and thickness, hydrology and geohydrology, floodwater quality, pedology, surface use, climatology, vegetation cover, socio-economic issues and environmental impacts of the system should be studied. In principle, FWS systems serve as sedimentation basins and infiltration ponds for the artificial recharge of groundwater and also as experimental plots for improvement, moving-sand stabilization, and reforestation (Kowsar Citation1992). The present FWS system is composed of several inter-connected basins with small slopes (<2%). Floodwater is diverted from the ephemeral river by a conveyance channel to the FWS system by means of a diversion dam (, and and ). A conveyance channel with 0.5% slope reduces the kinetic energy of the floodwater. The length of the conveyance channels varies between a few metres to a few kilometres depending on the distance between the ephemeral river and the FWS system. Floodwater enters the first levelled channel (conveyor-spreader channel, ) and then overflows uniformly into the first basin. Water flows to the next downstream basin depending on the slope at approximately 0.2–0.25 m/s and is retained behind the high (about 1.5 m) downstream embankment. When the water depth exceeds 0.2–0.25 m, excess water flows through several water gateways installed in the embankment (). Consequently, the water enters the next levelled channel (spreader channel, ) of depth 0.4 m and width 4 m. Overtopping water from this channel then spreads uniformly over the next basin. This process is repeated until almost clear water enters the last basins designed as infiltration ponds. It has been estimated that up to about 80% of diverted floodwater can recharge the aquifer (Kowsar Citation2008). From the last basin excess water is returned to the river or a downstream FWS system () by means of an outflow channel.
Fig. 3 Schematic representation of a three-basin floodwater spreading system. The length of each basin and consequently the entire system depends on the surface slope (steeper slope means smaller length and smaller slope means larger length).
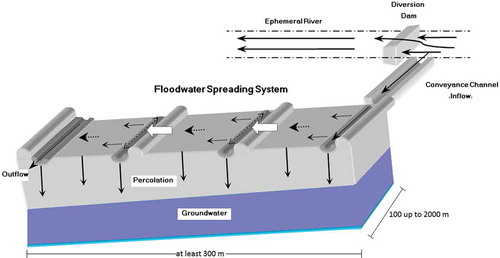
Fig. 4 Hydraulic components of the floodwater spreading system: (a) diversion dam, (b) conveyance channel, (c) spreader/conveyor spreader channel, and (d) water gateway.
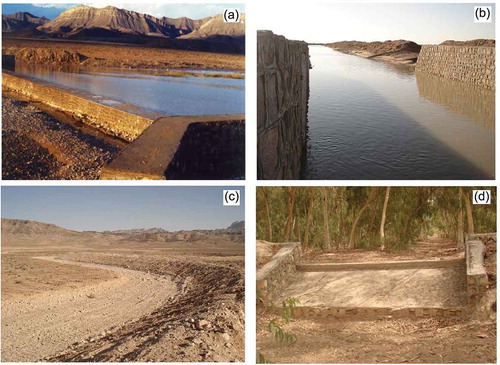
In general, the FWS system consists of different hydraulic elements such as diversion dams, conveyance channels, conveyor-spreader channels, spreader channels, water gateways, and outflow channel. shows some of these different parts of the FWS system in the GBP. It can be seen that all hydraulic parts constitute a low-cost passive technology that may give high returns in terms of increased groundwater supply (Kimrey Citation1989). But, as in the case of all floodwater harvesting, breaches may occur in the early stages of operation before consolidation has fully taken place (Critchley et al. Citation1991). Hence, continuous maintenance is required to have a fully functional system. When the embankments have consolidated and are allowed to develop vegetation, direct damage, e.g. due to splash erosion by raindrop impact, and breach occurrence will reduce. In any case, damage to the embankment is inevitable and occurs from time to time, so repairs are necessary at any stage but especially during the first year of operation. Also, in general, the system needs to be inspected after any significant flood ().
2.3 Data collection
To extend data records for the newly established Gareh-Bygone raingauge we used rainfall data from neighbouring raingauges located in the same basin (). The nearest raingauge (Baba-Arab, 16 km from the study area) with the highest correlation with Gareh-Bygone was selected as representative of precipitation in the GBP and upper sub-basin, in order to calculate monthly water balances for the period 1993–2007. gives a summary and descriptive statistics of the available monthly rainfall data in the area.
Table 1 Descriptive statistics of available raingauge station data close to the Gareh-Bygone Plain.
The paucity of reliable inflow records to the system necessitated the use of data from neighbouring hydrometric stations to estimate mean monthly inflow. Neighbouring station discharge was also used to infill gaps of missing data. In total, eight gauging stations () were used to estimate inflow, utilizing multiple linear regression.
Table 2 Descriptive statistics of available discharge station data close to the Gareh-Bygone Plain.
Groundwater level (GWL) in observation wells has been monitored by Fasa District Water Organization since 1993. In general, the GWL at the lowest point of the plain varied from 1130.6 to 1124.7 m a.s.l., while, at the highest point it varied from 1158.7 to 1160.3 m a.s.l. between 1993 and 2007. The ground surface elevation difference between these two points is only 13 m. These observations accompanied by modelling results (Hashemi et al. Citation2012) show the influence of the fault close to the observation well located at the highest point of the plain. However, it should be mentioned that there are many pumping wells located around the lowest observation well that greatly influence the GWL in this zone regardless of artificial recharge. Besides gathering well pumping discharge data from the Fasa District Water Organization, much time was spent on measuring the discharge rate in each pumping well using a water discharge gauge and determining the exact spatial distribution of the pumping wells. The collected data (average discharge rate for each well) were used for transient model simulations. Based on measured discharge data in all pumping wells over different time periods, together with crop pattern and irrigation periods for the study area, an average water abstraction for the existing pumping wells was estimated using unsteady-state GWL modelling, as outlined below.
2.4 Groundwater modelling
A three-dimensional (3D) finite difference approach for GWL was employed using MODFLOW-2000 (Harbaugh et al. Citation2000). Moreover, the automated parameter estimation (PEST; Doherty et al. Citation2004) module for MODFLOW was used to optimize parameters for best agreement between simulated and observed GWL. In order to estimate recharge, a 3D conceptual model was built to represent the GBP. Geological, hydrometeorological and observed hydraulic head data for the period 1993–2007 were used to build the model domain. The study area was discretized into a 250 m × 250 m grid, taking into account the distance between pumping wells. Also, based on the alluvial fan properties and existing borehole records, and in order to simplify the modelling process, the model domain was discretized vertically as a single-layer, unconfined aquifer.
Three different types of boundary conditions were defined for the study area, namely (a) no-flow boundary, (b) general head boundary, and (c) changing-head or time variant specified-head boundary. A no-flow boundary was assigned to the northern part of the model area at the Gar Mountain range. Based on observed GWL close to the northwestern border of GBP, the border was used as a general head boundary. According to the topography and bedrock map of the GBP, the general trend for groundwater flow is from north to southwest. Accordingly, a time-variant specified-head or changing-head boundary was defined along the southern and southwestern borders of the GBP ().
The four existing observation wells were used to build the conceptual model for the 14-year observation period. Subsequently, the model was calibrated over the study period based on observed monthly GWL in the four observation wells. Due to the limited number of observation wells and the risk of over-calibration, the model was verified with data from two more recent observation wells for one more steady-state condition in 2008 (Hashemi et al. Citation2012, Citation2013). Groundwater flow was simulated and calibrated based on monthly observed data during both steady-state and transient periods for the period 1993–2007. Also, in all modelling steps (steady/unsteady conditions) the confidence limit of the estimated parameters was checked. It should be mentioned that confidence limits could only be obtained if the covariance matrix has been calculated. Therefore, in case of any over- or under- parameterization, the confidence interval is not produced (Doherty et al. Citation2004).
In the steady-state simulation, the model was calibrated for 10 different time periods to achieve the best estimation of horizontal hydraulic conductivity (Kh) and boundary conditions. To estimate the hydraulic conductivity, time steps corresponding to the steady-state flow were used for model calibration. For this purpose, 10 different steady-state conditions during the entire observation period were selected when the absolute difference in water level in all observation wells and between two successive months was at a minimum or less than 0.3 m. Also, observations showed that during the selected steady-state periods, the discharge through the pumping wells was at a minimum and no recharge occurred through either the river channel or the FWS system. Then, the average estimated Kh for steady-state conditions was transferred to the transient model to estimate storativity (S), and recharge rate (RCH) using an inverse modelling approach.
Due to unconfined aquifer characteristics, the transient model was constructed and calibrated against observation well data in order to estimate Sy for three different periods. However, since the drawdown of groundwater level in an unconfined aquifer depends on Sy (Al-Kharabsheh Citation2000), and to decrease the number of unknown parameters, the model was calibrated for no recharge (dry period) but with active pumping wells. The average estimated Sy was then transferred to the next transient model step to estimate recharge. In the unsteady state model, the RCH was estimated in the different time intervals for the 10 steady-state periods. The recharge was estimated by the model based on available flood records, reported by the Fars Research Centre for Agriculture and Natural Resources. It should be noted that due to missing observation well data in 2000 and the beginning of 2001, no simulation was performed for this period. Considering the high infiltration rate of unconsolidated alluvium formation in the area, a travel time of one month was assumed as a recharge parameter. This assumption was corroborated by Kowsar (Citation2008), who estimated that the infiltration rate of the FWS system at Ab-Barik Bam in southeast Iran exceeds 10 m d-1.
To compute the groundwater flow budget, e.g. groundwater inflow and outflow, the Layer-Property Flow (LPF; Harbaugh et al. Citation2000) package was used to specify properties controlling flow in, out and between cells. For the cells that are (or may become) unconfined and to control groundwater inflow and outflow through boundary conditions, e.g. general head and time-variant specified head boundary, the conductance terms were computed at each iteration because the conductance depends upon saturated thickness. Saturated thickness in the in/outflow boundaries of the model was assigned in each calibration period based on the observed groundwater level data beyond the boundary condition (general head boundary) and also manually changed (time-variant specified head boundary) during the calibration processes to achieve the best agreement between observed and simulated values. Hence, the groundwater inflows and outflows were computed in each stress period.
2.5 Water balances
The recharge of the FWS system was estimated using a water balance approach. The methodology described here includes a combination of statistical and conceptual modelling to estimate inflow, outflow and recharged water to groundwater from monthly water balances over a 14-year period between 1 January 1993 and 31 December 2007. shows the major components of the water balance for the study area. The main sources of surface water input to the system are precipitation (P) over the study area and surface runon coming from upper sub-basins onto the plain by flash floods. Both these components are affected by evapotranspiration (ET) from the soil/vegetation cover before recharging the groundwater. Some of the surface runon that crosses the plain, infiltrates and consequently may form increased groundwater storage (∆s) through the river channel (natural recharge) and through the FWS system. In comparison with the FWS system, the river channel is a minor portion of the plain representing 10% of the total recharge area. However, the infiltration rate and percolation velocities under the river channel seem to be higher compared with the artificial recharge area. Quantifying the recharge contribution in such a complex system is crucial but difficult to estimate. Therefore, based on the estimated hydraulic conductivity and recharge rate from the model, only 10% of total estimated recharge was assumed to be natural recharge from the river bed and bank in this study. The remaining surface runoff leaves the area. The net infiltration is termed groundwater recharge (Alencoão and Pacheco Citation2006). The other input source of water into the system is groundwater inflow mainly from the fault and adjacent aquifer at the upper part of the GBP. Also, the groundwater drains to the downstream adjacent aquifer in the south/southwest. Water is lost via water abstraction directly from groundwater storage for irrigation and subsequent evapotranspiration. It should be noted that water abstraction from pumping wells for irrigation purposes is taken into account. Recharge from irrigation was assumed to be about 10% of used irrigation water, the remaining 90% was assumed to be lost through evapotranspiration.
Fig. 5 Schematic of water balance for the study area. Note that groundwater extracted by pumping is included in the ET/extraction term.
In principle, a form of the water balance equation for an unconfined aquifer based on surface inflow and outflow, precipitation, groundwater inflow and outflow, and evapotranspiration over a period of time, can be written as:
To solve equation (1), observed precipitation (P) and runoff data from the stations described above were used. Missing data and uncertainties in measurements were dealt with using statistical techniques and groundwater modelling. As a result, water balances were estimated for a period of 14 years (1993–2007). Furthermore, inflow and outflow to the groundwater storage were calculated to define monthly groundwater storage changes. During flood events of short duration actual evaporation may be negligible. In addition, since the modelling is based on a 14-year period, soil moisture was assumed to be the same at the beginning and at the end of the period. Thus, taking into account the total recharge (R) from the surface water:
3 RESULTS AND DISCUSSION
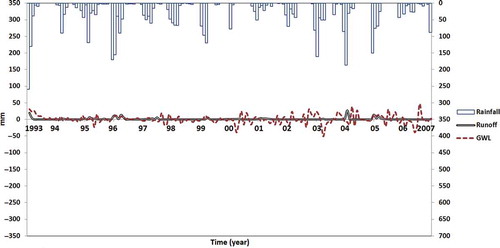
shows the variation of measured monthly rainfall, runoff and GWL in an observation well in the upper part of the GBP not influenced by FWS or pumping; as seen in the figure, the GWL is almost constant with no general trend. However, some fluctuation can be noted due to surface runoff recharge and maybe direct rainfall recharge.
Fig. 6 Total monthly rainfall (P, mm), runoff (mm) and groundwater level (GWL, mm) in the upper GBP for the period 1993–2007 (the average GWL change for an observation well, located in the upper part of the GBP, in successive months was multiplied by measured specific yield to be expressed in mm).
As a comparison, shows the variation in measured monthly rainfall, inflows to the FWS system and average GWL (based on hydraulic head at the observation wells) for the investigation period. In general, 1993–1996 and 2003–2005 were wet periods, with mean rainfall of 353 and 297 mm/year, respectively. The period 1997–2002 was a drought period, with a mean annual rainfall of 207 mm.
Fig. 7 Total monthly rainfall (P, mm), diverted runoff to the floodwater harvesting system (Qin-surf, mm) and groundwater level (GWL, mm) change for the period 1993–2007 (the average GWL change for all observation wells in successive months was multiplied by measured specific yield to be expressed in mm).
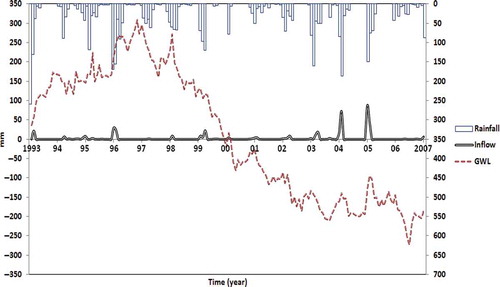
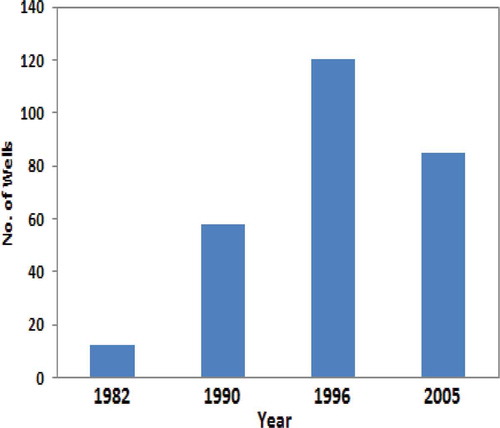
shows that the water level response to the runoff and significant rainfall is very quick and GWL fluctuations are highly correlated with flood events within a month. This has reinforced our assumption about the travel time within a month when designing the conceptual model. According to , the GWL increased in the period 1993–1997 as a result of the FWS system. From 1997, however, a large reduction in GWL was recorded; from about 2003 this stabilized. The significant drawdown shows good correlation with the increase in pumping wells in the area. shows that the total number of pumping wells drilled in the area peaked around the end of the 1990s (Ghahari and Pakparvar Citation2007). Consequently, the reduction in GWL was a combined effect of less rainfall and increased pumping by farmers to supply increasing areas of farmland with irrigation water. Thus, in the period 2003–2007 the GWL stabilized either: (a) due to a balance between the number of pumping wells (decreasing after 1996; ) and the artificial recharge to the groundwater by the FWS system; or (b) because the GWL reached a level close to the bedrock and consequently appeared to have dried out (personal communication with farmers). More investigation needs to be carried out in order to determine the saturated thickness of the aquifer.
Fig. 8 Total number of drilled new pumping wells in the Gareh-Bygone Plain.
Wheat and corn are dominant crops in the study area. The cultivation period for wheat starts in late autumn (November–December), which coincides with the dry period and thus farmers have to pump groundwater for irrigation. Traditional surface irrigation is the preferred method among the farmers. However, this tends to induce waterlogging and large losses by evaporation. Also, watermelon is a popular crop that is planted in late winter (January–February) and harvested in summer. This crop requires much water at the beginning of the summer, which coincides with the dry period in the GBP. Consequently, the crop patterns and irrigation period, together with irrigation technique and increasing farmland area, are significant factors that intensified groundwater decline especially during the drought period between 1997 and 2002.
3.1 Recharge
Groundwater modelling was employed to estimate groundwater recharge of the GBP for the period 1993–2007. For this purpose the groundwater model was run for both the steady and unsteady states to determine groundwater flow and aquifer hydraulic parameters (Kh, Sy and RCH). The estimated Kh value from steady-state simulation varied between 0.07 and 0.10 m d-1 with an average value of 0.09 m d-1. Average estimated Sy was about 0.05, which is close to measured Sy from pumping tests in the study area (Hashemi Citation2009). shows the residual between simulated and observed GWL at the boreholes, and the agreement between observed and simulated time series in one of the selected wells for estimating monthly RCH.
Fig. 9 Scatter plot of observed vs simulated monthly GWL for all boreholes and time series of observed and simulated GWL in one of the selected observation wells between 1993 and 2007 (no simulation was done for 2000 and beginning of 2001 due to missing observations).
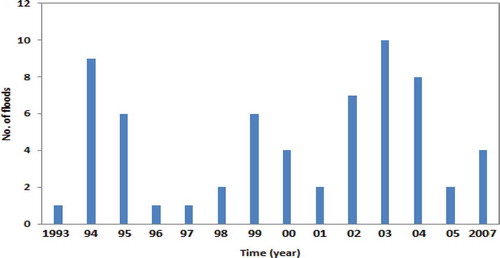
shows observed monthly rainfall, inflow of floodwater to the FWS system, and estimated recharge for the study period. In general, frequent floods resulted in larger recharge as compared to periods with the same flood magnitude but fewer events. For instance, in 1994 the rainfall and magnitude of inflow were less than in other years during the first wet period (1993–1997), but the large number of flood events () in this year resulted in about 3.0 × 10⁶ m3 of recharged water. The same tendency was observed in 1995 with six flood events. Also, during the drought period (1997–2002), more water recharged in 1999 (9.0 × 10⁵ m3) than in other years, due to the large number of flood events this year ( and ).
Fig. 10 Monthly rainfall (P, Mm3), inflow to the FWS system (Qin-surf, Mm3), and recharge (R, Mm3) between 1993 and 2007.
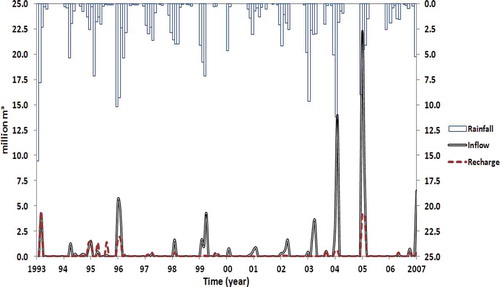
Fig. 11 Number of flood events (defined as delimited by a dry period between two flash floods) in each year during the study period.
shows that during 1995 several events indicate recharge larger than the inflow to the system. This may be due to (a) the influence of direct rainfall recharge on the storage due to heavy rainfall events, (b) the effect of flood recharge that occurred at the end of the previous month, or (c) more recharge having occurred through the river bed (natural recharge). In any case, more research is needed to quantify the contribution of each recharge zone (natural and artificial recharge) in the study area. As was mentioned above, due to the high infiltration rate in the alluvium fan, water transport time through the unsaturated zone was assumed to be one month. Therefore, recharge greater than inflow to the system may be due to flooding events that occurred in the previous month. The figure also shows that the difference between inflow and recharged water is at a minimum during the years between 1993 and 1998, while this difference is at a maximum during the last few years. It appears that the system was more efficient during the first 15 years of operation (the system was established in 1983). During the last wet period (2003–2007) sediment deposition and clogging of the system, combined with destructive floods that partly damaged the system, appear to have been the main cause of efficiency loss. However, even with lower capacity the system still worked well with respect to the amount of recharged water (e.g. 2005 in ).
The estimated average pumping rate from the aquifer was about 2.5 × 10⁶ m3 year-1 during the last wet period (2003–2007), which appears to be a maximum discharge rate, since the GWL is at minimum and close to the bedrock. In any case, extraction should be balanced by the sustainable artificial recharge rate in order not to deplete the groundwater.
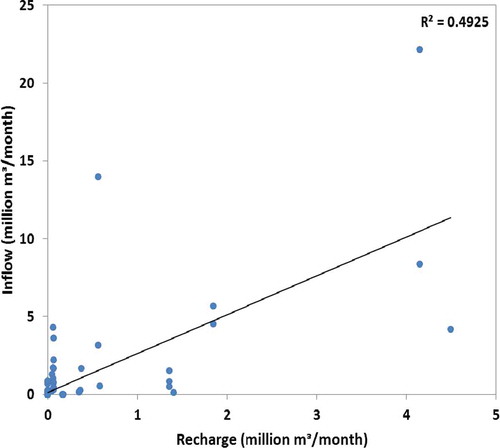
The large variation between inflow to the system and recharge shown in indicates that the system is not easily operated and that the recharge rate does not depend on the amount of diverted flood volume in a linear relationship. Instead, infiltration mechanisms probably depend on factors such as seasonal fluctuation of soil cover and duration of flood.
Fig. 12 Relationship between inflow volume to the system and recharge volume.
Based on the water balance approach and equation (3), the average Qin-gw and Qout-gw during both wet and drought periods is almost constant and equal to 5.7 × 10⁶ and 3.0 × 10⁶ m3 year-1, respectively. Water lost via ET/extraction from the pumping wells in wet and drought periods is 5.5 × 10⁶ and 3.1 × 10⁶ m3 year-1, respectively. However, average ET/extraction from storage during wet periods is larger than during drought periods, although the average recharged water volume is also much larger than during the drought period (3.0 × 10⁶ as compared to 4.7 × 10⁵ m3 year-1). Thus, it is clear that the FWS has a large influence on the groundwater balance. Based on the number of pumping wells and extraction, it appears that more water is lost through evapotranspiration during wet periods as opposed to the drought period.
As a result, and in order to reach a sustainable pumping rate in the studied area, there must be a balance between pumping and recharge to the groundwater storage. However, the results show that in the dry period the water lost through ET/extraction is less than in the wet period, but still with a declining groundwater level. It is thus recommended that the extraction should be decreased in order to recover and balance the aquifer in the future.
4 CONCLUSIONS
The study showed that artificial recharge by a FWS system is an efficient way to increase groundwater resources in arid areas. Compared to artificial recharge by injection into boreholes, FWS is a less expensive alternative suitable for less developed countries (Tuinhof and Piet-Heederik Citation2002). The observations of groundwater level in the GBP, however, also showed that artificial recharge needs to be balanced by relevant management of groundwater in order to not create unsustainable irrigation farming. For this purpose, it is important to be able to quantify a sustainable level of pumping. In line with this we used available records of rainfall, discharge, and groundwater observations together with statistical techniques and groundwater modelling to quantify recharge rates over a 14-year period. The estimated recharge varied between about several hundred thousand to 4.5 × 10⁶ m3 month-1 for the rainy season. These amounts represent a valuable groundwater resource for the local farming community in terms of increased agricultural output.
The results show that there is a large variation in achieved recharge irrespective of inflow volume to the FWS system. Further studies are needed to investigate mechanisms for this large variation and the infiltration mechanisms inside the floodwater spreading area. Also, modelling studies are needed to optimize the recharge subject to flood frequency and magnitude as well as management of the FWS system.
In view of increasing water scarcity, especially in the Middle East, alternative water management techniques such as rainwater harvesting and FWS systems need to be investigated and further exploited. The scarcity of data in many of these regions poses special problems. However, studies like the one presented here can be used as representative of the present climatic and physiographical setting.
Acknowledgements
The authors are grateful to the Centre for Agriculture and Natural Resources, Fars Province, Shiraz, for providing runoff and rainfall data.
Additional information
Funding
Related Research Data
REFERENCES
- Ahmadvand, M. and Karami, E., 2009. A social impact assessment of the floodwater spreading project on the Gareh-Bygone plain in Iran: a causal comparative approach. Environmental Impact Assessment Review, 29 (2), 126–136. doi:10.1016/j.eiar.2008.08.001.
- Alencoão, A.P. and Pacheco, F.A.L., 2006. Infiltration in the Corgo River basin (northern Portugal): coupling water balances with rainfall–runoff regressions on a monthly basis. Hydrological Sciences Journal, 51 (6), 989–1005. doi:10.1623/hysj.51.6.989.
- Al-Kharabsheh, A., 2000. Ground-water modelling and long-term management of the Azraq basin as an example of arid area conditions (Jordan). Journal of Arid Environments, 44 (2), 143–153. doi:10.1006/jare.1999.0580.
- Araus, J.L., 2004. The problems of sustainable water use in the Mediterranean and research requirements for agriculture. Annals of Applied Biology, 144 (3), 259–272. doi:10.1111/j.1744-7348.2004.tb00342.x.
- Arzani, N., 2010. Water harvesting and urban centers in Dryland Alluvial Megafans: environmental issues and examples from central Iran. International Journal of Environmental Science and Development, 1 (5), 5.
- Barghouth, J. and Al-Sa`ed, R.M., 2009. Sustainability of ancient water supply facilities in Jerusalem. Sustainability, 1 (4), 1106–1119. doi:10.3390/su1041106.
- Barksdale, H.C. and Debuchananne, G.D., 1946. Artificial recharge of productive ground-water aquifers in New Jersey. Economic Geology and the Bulletin of the Society of Economic Geologists, 41 (7), 726–737. doi:10.2113/gsecongeo.41.7.726.
- Bhattacharya, A.K., 2010. Artificial ground water recharge with a special reference to India. International Journal of Research and Reviews in Applied Sciences, 4 (2), 214–221.
- Boers, T.M. and Benasher, J., 1982. A review of rainwater harvesting. Agricultural Water Management, 5 (2), 145–158. doi:10.1016/0378-3774(82)90003-8.
- Bouwer, H., 1996. Issues in artificial recharge. Water Science and Technology, 33 (10–11), 381–390. doi:10.1016/0273-1223(96)00441-6.
- Bruins, H.J., Evenari, M., and Nessler, U., 1986. Rainwater-harvesting agriculture for food production in arid zones: the challenge of the African famine. Applied Geography, 6 (1), 13–32. doi:10.1016/0143-6228(86)90026-3.
- Critchley, W., Siegert, K., and Chapman, C., 1991. Water harvesting: a manual for the design and construction of water harvesting schemes for plant production. Rome: Food and Agriculture Organization of the United Nations. AGL/MISC/17/91.
- Doherty, J., Brebber, L., and Whyte, P., 2004. PEST manual. 5th ed. Brisbane: Watermark Numerical Computing.
- Evenari, M., Shanan, L., and Tadmor, N.H., 1971, The Negev: the challenge of a desert. 1st ed. Cambridge, MA: Harvard University Press.
- Ghahari, G.R. and Pakparvar, M., 2007. Effect of floodwater spreading and consumption on groundwater resources in Gareh Bygone Plain. Iranian Journal of Range and Desert Research, 14 (3)(28), 368–390.
- Ghayoumian, J., et al., 2005. Integrating GIS and DSS for identification of suitable areas for artificial recharge, case study Meimeh Basin, Isfahan, Iran. Environmental Geology, 47 (4), 493–500. doi:10.1007/s00254-004-1169-y.
- Glendenning, C.J. and Vervoort, R.W., 2010. Hydrological impacts of rainwater harvesting (RWH) in a case study catchment: the Arvari River, Rajasthan, India. Part 1: field-scale impacts. Agricultural Water Management, 98 (2), 331–342. doi:10.1016/j.agwat.2010.09.003.
- Harbaugh, A.W., et al., 2000. MODFLOW-2000, the US Geological Survey modular ground-water model—user guide to modularization concepts and the ground-water flow process. US Geological Survey Open-File Report 00-92.
- Hashemi, H., 2009. The quantitative evaluation of recharge amount and the effects of floodwater spreading on the groundwater resources of Fasa Gareh-Baygon plain, Fars province, by MODFLOW. Monograph (MSc). Shiraz University.
- Hashemi, H., et al., 2013. Natural vs. artificial groundwater recharge, quantification through inverse modeling. Hydrology and Earth System Sciences, 17, 637–650. doi:10.5194/hess-17-637-2013.
- Hashemi, H., Berndtsson, R., and Kompani-Zare, M., 2012. Steady-state unconfined aquifer simulation of the Gareh-Bygone plain, Iran. The Open Hydrology Journal, 6, 58–67. doi:10.2174/1874378101206010058.
- Keller, A., Sakthivadivel, R., and Seckler, D., 2000. Water scarcity and the role of storage in development. Colombo, Sri Lanka: International Water Management Institute, IWMI Research Report 39.
- Kimrey, J.O., 1989. Artificial recharge of groundwater and its role in water management. Desalination, 72 (1–2), 135–147. doi:10.1016/0011-9164(89)80031-1.
- Kowsar, S.A., 1992. Desertification control through floodwater spreading in Iran. Unasylva (English ed), 43 (168), 27–30.
- Kowsar, S.A., 2005. Abkhandari (Aquifer management): a green path to the sustainable development of marginal Drylands. Journal of Mountain Science, 2 (3), 233–243. doi:10.1007/BF02973197.
- Kowsar, S.A., 2008. Desertification control through floodwater harvesting: the current state of know-how. In: C. Lee and T. Schaaf, eds. The future of drylands: international scientific conference on desertification and drylands research, 19–21 June 2006 Tunis. Dordrecht: Springer, 229–241. doi:10.1007/978-1-4020-6970-3_27.
- Kowsar, S.A. and Pakparvar, M., 2004. Assessment methodology for establishing an aquitopia, Islamic Republic of Iran. In: T. Schaaf (series ed.) C. Lee (volume ed.) Sustainable management of marginal drylands (SUMAMAD). Proc. 2nd Int. Workshop. Shiraz, I.R. Iran. 29 Nov.–2 Dec. 2003. UNESCO-MAB Dryland Series no. 3, 40–55.
- Kumar, M.D., et al., 2006. Rainwater harvesting in India: some critical issues for basin planning and research. Land Use and Water Research, 6 (1), 1–17.
- Lavee, H., Poesen, J., and Yair, A., 1997. Evidence of high efficiency water-harvesting by ancient farmers in the Negev Desert, Israel. Journal of Arid Environments, 35 (2), 341–348. doi:10.1006/jare.1996.0170.
- Li, X.-Y. and Gong, J.-D., 2002. Compacted microcatchments with local earth materials for rainwater harvesting in the semiarid region of China. Journal of Hydrology, 257 (1–4), 134–144. doi:10.1016/S0022-1694(01)00550-9.
- Mehari, A., Schultz, B., and Depeweg, H., 2005. Where indigenous water management practices overcome failures of structures: the Wadi Laba spate irrigation system in Eritrea. Irrigation and Drainage, 54 (1), 1–14. doi:10.1002/ird.151.
- Mehdizadeh, P., et al., 1978. Water harvesting for afforestation: I. Efficiency and life span of Asphalt cover. Soil Science Society of America Journal, 42 (4), 644–649. doi:10.2136/sssaj1978.03615995004200040022x.
- Mehrvarz, K. and Kalantari-Oskouei, A., 2007. Investigation of Quaternary deposits suitable for floodwater spreading. International congress of river basin management. Turkey: Antalya. 572–582.
- Naderi, A., Kowsar, S., and Sarafraz, A., 2000. Reclamation of a sandy desert through floodwater spreading. I. Sediment-induced changes in selected soil chemical and physical properties. Journal of Agricultural Science and Technology, 2, 9–20.
- Nasri, S., et al., 2004. Hydrological processes in macrocatchment water harvesting in the arid region of Tunisia: the traditional system of tabias. Hydrological Sciences Journal, 49 (2), 261–272. doi:10.1623/hysj.49.2.261.34838.
- Oblinger, J.A., et al., 2010. A pragmatic method for estimating seepage losses for small reservoirs with application in rural India. Journal of Hydrology, 385 (1–4), 230–237. doi:10.1016/j.jhydrol.2010.02.023.
- Ouessar, M., et al., 2009. Modelling water-harvesting systems in the arid south of Tunisia using SWAT. Hydrology and Earth System Sciences, 13 (10), 2003–2021. doi:10.5194/hess-13-2003-2009.
- Prinz, D. and Singh, A.K., 2003. Technological potential for improvements of water harvesting. Cape Town: World Commission on Dams.
- Prinz, D. and Wolfer, S., 1999. Traditional techniques of water management to cover future irrigation water demand. Zeitschrift fur Bewasserungswirtschaft, 34 (1), 41–60.
- Raes, D., et al., 2008. Modeling the effect of floodwater spreading systems on the soil-water balance and crop production in the Gareh Bygone Plain of Southern Iran. In: C. Lee and T. Schaaf, eds. The future of drylands: international scientific conference on desertification and drylands research, 19–21 June 2006 Tunis. Dordrecht: Springer, 229–241. doi:10.1007/978-1-4020-6970-3_27.
- Raziei, T., Arasteh, P.D., and Saghfian, B., 2005. Annual rainfall trend in arid and semi-arid regions of Iran. ICID 21st European regional conference. Frankfurt (Oder) and Slubice – Germany and Poland.
- Sekar, I. and Randhir, T.O., 2007. Spatial assessment of conjunctive water harvesting potential in watershed systems. Journal of Hydrology, 334 (1–2), 39–52. doi:10.1016/j.jhydrol.2006.09.024.
- Stiefel, J.M., et al., 2009. Effects of rainwater-harvesting-induced artificial recharge on the groundwater of wells in Rajasthan, India. Hydrogeology Journal, 17 (8), 2061–2073. doi:10.1007/s10040-009-0491-6.
- Tahmasebi, A., 2009. Indigenous knowledge for water management in Iran’s dry land—Siraf. International Journal of Environmental Studies, 66 (3), 317–325. doi:10.1080/00207230902722481.
- NWP (The Netherlands Water Partnership). 2007. Smart water harvesting solutions (Examples of innovative, low-cost technologies for rain, fog, runoff water and groundwater).
- Tuinhof, A. and Piet-Heederik, J., 2002. Management of aquifer recharge and subsurface storage: making better use of our largest reservoir. Wageningen: Netherland National Comittee.
- Wisser, D., et al., 2010. The significance of local water resources captured in small reservoirs for crop production—a global-scale analysis. Journal of Hydrology, 384 (3–4), 264–275. doi:10.1016/j.jhydrol.2009.07.032.