
Abstract
Land-use changes have been significant these last decades in West Africa, particularly in the Sahel region; in this area, climatic and demographic factors have led to a rise in cropped areas in recent decades causing strong changes in the water cycle and in river regimes. This study compares the rainfall–runoff relationships for two periods (1991–1994 and 2004–2011) in two small and similar neighbouring Sahelian catchments (approx 0.1 km2 each). This allows identification of the different hydrological consequences of land-use/land-cover change, particularly the fallow shortening and the consequent degradation of topsoil. The main land surface change is a 75% increase in crusted soil area. Runoff increased by more than 20% on average between the two periods while flood duration decreased by 50% on average. However, runoff values remained largely constant in the lower part of the northern basin due to a strong increase in in-channel infiltration.
Editor D. Koutsoyiannis; Associate editor T. Wagener
Résumé
Les changements d’usage des sols ont été significatifs au cours des dernières décennies en Afrique de l’Ouest, en particulier au Sahel ; dans cette dernière région, l’extension des cultures, liée à des facteurs climatiques et démographiques, a provoqué de profonds changements dans le cycle et le régime des eaux. Cette étude compare les relations pluie/débit pour deux périodes (1991–1994 et 2004–2011) dans deux petits bassins-versants similaires et voisins (environ 0,1 km2 chacun) du Sahel de l’Ouest du Niger. Elle met en évidence les différentes conséquences hydrologiques des changements d’occupation des sols, en particulier de la réduction des jachères et de la dégradation du sol superficiel qui en a résulté. Le principal changement de la surface des sols est un accroissement de 75% des surfaces de sol encroûtés. L’écoulement s’est accru de 20% en moyenne entre les deux périodes, tandis que la durée totale de l’écoulement à l’exutoire des bassins diminuait de 50%. Toutefois, les volumes écoulés à l’aval du bassin nord ont peu évolué du fait d’une très forte infiltration des eaux dans le lit du cours d’eau.
INTRODUCTION
It is commonly assumed that climate change as well as land-use/land-cover changes lead to modifications in the regime or the discharge of the rivers concerned. This is observed under different climatic areas, and studies deal with small or extended watersheds. Climate change has been shown to be the main explaining factor of the increase in discharge of the six largest Eurasian rivers to the Arctic Ocean (Peterson et al. Citation2002), and of the decrease in runoff of North African rivers (Mahé et al. Citation2013), while land-use changes seem to be predominant as the cause of the increase in runoff observed in Queensland, Australia (Lawrence and Sinclair Citation1989, Siriwardena et al. Citation2006), in central Mexico (Gratiot et al. Citation2010) and in West Africa (Amogu et al. Citation2010, Descroix et al. Citation2012b, Mahé et al. Citation2013). Sometimes, only overall changes in river regime are reported, e.g. in Amazonia (Costa et al. Citation2003), or in Northern Mexico (Viramontes and Descroix Citation2003).
Land use is rapidly changing throughout the Sahel (Prince et al. Citation1998, Fensholt and Rasmussen Citation2011, Huber et al. Citation2011). Vegetation cover has decreased significantly according to studies based on remote sensing of western Niger, eastern Mali and eastern Burkina Faso (Loireau Citation1998, Cappelaere et al. Citation2009, see maps in Prince et al. Citation1998 and in Fensholt and Rasmussen Citation2011). By the end of the 20th century, natural vegetation had already almost disappeared in extensive areas, and was replaced with crops and fallow (Leblanc et al. Citation2008, Descroix et al. Citation2009, Hiernaux et al. Citation2009a).
The traditional cropping system in this part of the Sahel consists of an alternation of crops (3–4 years) and fallow (10–15 years). Due to the demographic pressure (population growth has been around 3.5% per year for 20 years), this extensive system has become degraded and, currently, 4–5 years of crops are followed by only 2 or 3 years of fallow, which is insufficient to maintain soil fertility (Leblanc et al. Citation2008, Descroix et al. Citation2009, Hiernaux et al. Citation2009a). Furthermore, within the croplands, crop areas have been increasing, while fallow lands have been decreasing since at least the 1950s. Crops and fallow covered 20% of the total space in 1950 and close to 80% in 2000, the remaining space being unproductive lateritic plateaux (d’Herbès and Valentin Citation1997, Raynaut Citation2001, Guengant and Banoin Citation2003, Hiernaux et al. Citation2009b, Mahé et al. Citation2011, Ruelland et al. Citation2011). Soil crusting linked to the shortening of fallow periods has caused a new stage of soil erosion and an increase in runoff within the region, leading to consequent downstream sedimentation (Amogu Citation2009, Descroix et al. Citation2012a, Le Breton Citation2012, Mamadou Citation2012). Gullies and alluvial fans have covered increasing areas in recent decades (Massuel et al. Citation2006, Leblanc et al. Citation2008, Le Breton Citation2012).
A significant increase in runoff coefficient (Kr) is attributable to soil surface features developed on the hillslopes: crusted soils, erosion crusts, biological crusts, etc. (Casenave and Valentin Citation1989). The observed soil crusting (Casenave and Valentin Citation1992, d’Herbès and Valentin Citation1997) is reported to have led to a decrease in infiltration (Vandervaere et al. Citation1997), which in turn increased runoff and soil erosion (Descroix et al. Citation2009, Citation2012a). Detached material is deposited downstream and creates sandy deposits which have become new infiltration areas (Esteves and Lapetite Citation2003, Leblanc et al. Citation2008, Descroix et al. Citation2009), causing transmission losses and a reduction of discharge.
Land-use/land-cover evolution in the last decades is observed to be different, depending on the region, according to different authors. Some authors have concluded that there is a ‘re-greening’ of this region (Rasmussen et al. Citation2001, Anyamba and Tucker Citation2005), and others observed a decrease in albedo (Govaerts et al. Citation2008). In contrast, Hein and De Ridder (Citation2006) used the RUE concept (Rain Use Efficiency) to make satellite information more consistent with the numerous studies that highlighted a severe reduction in vegetation cover over the Sahel (Ada and Rockström Citation1993, Loireau Citation1998, Chinen Citation1999, Leblanc et al. Citation2008, Le Breton Citation2012, amongst others). This observation corroborates the findings of previous studies by Hountondji et al. (Citation2004) in Niger. In western Niger, total herbaceous yield was shown to be increasing despite the land clearing, because of the increase in crop area (Hiernaux et al. Citation2009a). Their measurements effectively showed that the biomass yield for millet fields (1200 kg year-1 on average) is significantly higher than that of fallow and rangelands (850 kg year-1). Finally, by comparing two maps proposed by Fensholt and Rasmussen (Citation2011) for two periods, 1982–2007 and 1996–2007, it appears that the NDVI index was increasing during the 1982–1996 period in a recuperation phase after the Great Drought. For the 1996–2007 period, NDVI did not increase in the central Sahel area but decreased in western Niger and eastern Burkina Faso.
The influence of land cover changes on the hydrological regime have been already demonstrated, from the point scale (Casenave and Valentin Citation1989, Vandervaere et al. Citation1997, amongst others), to the hillslope (Peugeot et al. Citation1997, Esteves and Lapetite Citation2003) and the basin scale (Albergel Citation1987, Amani and Nguetora Citation2002, Mahé et al. Citation2003, Amogu Citation2009, Descroix et al. Citation2009, Citation2012b, Amogu et al. Citation2010). There is a general agreement that increasing soil crusting widely compensates for the decrease in rainfall and has led to increasing runoff coefficients, increase in runoff volumes and flood irregularity in some parts of the region. In the area of Niamey (Niger), this has led to a rise in the water table (Leduc et al. Citation2001, Leblanc et al. Citation2008, Favreau et al. Citation2009). The soil surface features (mainly soil crusting) have been shown to favour runoff and severe water erosion in a small catchment in northern Burkina Faso (Karambiri et al. Citation2003).
The aim of this paper is to compare the land-use changes and the evolution of hydrological processes (particularly in runoff production) during the last two decades in two small Sahelian catchments.
MATERIALS AND METHOD
Study area
The Sahelian environment mainly consists of three distinct units: shrub bush (referred to as tiger bush because of its banded pattern), fallow savannah and pearl millet crops (D’Herbès and Valentin Citation1997). Soil water balance is controlled more by surface conditions than by deep soil conditions (Collinet and Valentin Citation1979, Chevallier and Valentin Citation1984, D’Herbès and Valentin Citation1997). Soil crusts develop even in very sandy soils and minimize infiltration (Vandervaere et al. Citation1997, Descroix et al. Citation2009, Citation2012a). The dry season lasts from October to May and the mean annual rainfall is about 560 mm in Niamey, Niger, in the central part of the Sahel. The region is dominated by a complex geological formation of Miocene loamy sandstone deposits, called the Continental Terminal. These cover the Precambrian crystalline basement complex, part of the pan-African shield (D’Herbes and Valentin Citation1997).
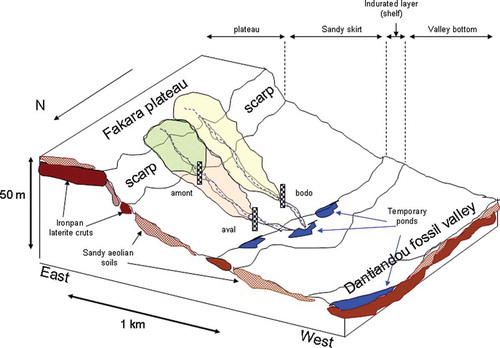
The landscape of the Banizoumbou-Tondi-Kiboro area, located 70 km east of Niamey, in the western part of the Iullemeden sedimentary basin (), is dominated by a dissected plateau (Fakara plateau, ) to the east, with soils formed of 25 cm of gravelly loam over cemented ironstone or gravel. Westwards, the fossil valley of Dantiandou kori (the local Hausa name for wadi and river) ( and ), receives streams from its basin without providing surface water to the fossil Dallol Bosso valley, another fossilized river valley originating in the Aïr mountains () and ancient left-bank tributary of the Niger River. The Dantiandou kori valley is a system starting below the relatively steep plateau escarpment, a breakaway at the edge of this plateau with slopes ranging from 4 to 8%. Close to the scarp, soils are shallow and contain ironstone gravel, but a few metres downslope, the sand deposits are almost 10 m thick (D’Herbès and Valentin Citation1997, Peugeot et al. Citation1997). These sandy aeolian deposits adjacent to the plateaux are referred to as ‘sandy skirts’ and they constitute the basement of the basins, forming a 1 km-long sandy hillslope. They are extensively cultivated with pearl millet; their topsoil consists of 10% silt and clay, and 90% sands, and they are very vulnerable to crusting (Van de Watt and Valentin Citation1992, D’Herbès and Valentin Citation1997). In the lower part of the small basins, the thickness of sandy soils decreases and iron-indurated layers outcrop, creating a shelf where very temporary ponds allow the infiltration of the equivalent water volume to that flowing in the Tondi Kiboro basin in 2009 (). Downslope, a convex toe-slope segment links the slope to the temporary stream bed of the Dantiandou kori.
Fig. 1 Location of the Tondi Kiboro experimental catchment.
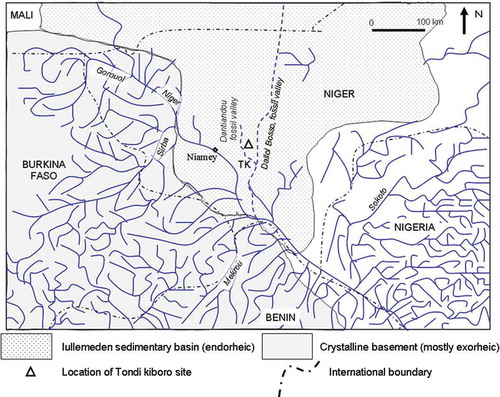
Fig. 2 Schematic diagram of the site of Tondi Kiboro basins.
The banded vegetation patches of tiger bush are very dense and include mainly Combretaceae (Combretum micrantum and Combretum glutinosum) and other species, mostly Guiera senegalensis and sparse Balanites aegyptiaca and Prosopis africana (the latter being endangered). The scarp is characterized by sparse vegetation in the upper seriously crusted part; woody vegetation is concentrated on the lower zone (mainly Combretaceae).
The vegetation cover of the skirt is mainly an alternation of crops and fallow. The fallow contains mostly the ubiquitous Guiera senegalensis; it is accompanied by Pilostigma reticulatum and Combretum glutinosum in old fallow, and by Aristida mutabilis, Cenchrus biflorus and Digitaria gayana in the grass fallow. Pearl millet (Pennisetum glaucum) is the major crop. Fallow and cropped areas include some remaining big trees, mostly the ‘gao’, Faidherbia albida, known to improve the fertility of fields by providing nitrogen (Descroix et al. Citation2012b).
A typical Sahelian process: topsoil crusting
Most of the topsoil has less than 15% silt and clay content (as measured by laser granulometer; Descroix et al. Citation2012a); however, it is very vulnerable to crusting. Effectively, coarse particles of the top layer are removed by wind and overland flow; they also can be disaggregated by raindrops with high kinetic energy, exposing a plasmic layer (Valentin and Bresson Citation1992). Finer particles are partly removed, and partly compacted at the surface, or they can fill the superficial porosity and vesicles. This process of topsoil crusting is favoured by overexploitation of soils (Valentin and Casenave Citation1992). There is a strong spatial correlation between soil crusting and the shortening of the period of fallow (Ambouta et al. Citation1996).
Hydrological measurements
Three small basins located near the village of Tondi Kiboro (southwest Niger) were equipped and monitored between 1991 and 1994 (Esteves and Lapetite Citation2003) and between 2004 and 2011 ( and ). Two of the basins are nested; the Amont catchment (upstream) is 46 800 m2; the entire basin at the Aval station (including Amont) has an area of 110 540 m2; and the third basin (Bodo) has an area of 121 800 m2. The second observation period in this last watershed is only 5 years long (2007–2011). As shown in and , rainfall during the two periods is representative of the long-term trend and they are not exceptional years.
Fig. 3 Instruments implementation in the Tondi Kiboro catchments.
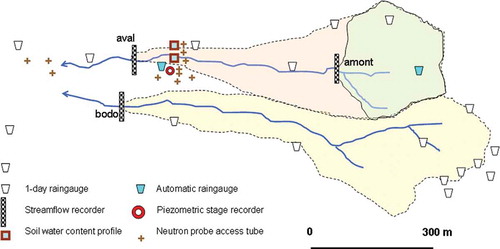
Fig. 4 Annual rainfall in years with hydrological data (mean = 486 ± 97 mm) and for the the whole period (482 ± 93 mm), showing the data to be a representative sample. Data are of the Banizoumbou meteorological station, located 3 km west of the Tondi Kiboro basins.
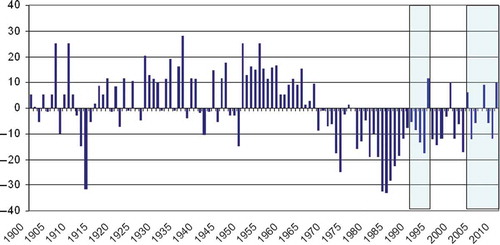
Fig. 5 Variation of rainfall at the Niamey station since 1900 as a percentage of one standard deviation (y-axis). The two measurement periods (1991–1994 and 2004–2011) are shown.
Stream gauge stations were implemented in flumes at the beginning of 1991; they were equipped with Chloe® (Elsyde, Paris, France) water-level recorders during the first period, and with Thalimedes® (OTT Messtechnik, Kempten, Germany) water-level recorders with floats during the second period.
The precision of both devices is 3 mm. Measurements were done at each level change, or twice an hour. Measurements obtained from recorders with floats were compared with those from pressure sensors by the authors in an experimental framework in the southern French Alps (Descroix and Gautier Citation2002) and their measurements were completely consistent. Uncertainties in the discharge due to the precision of the devices are the same in both cases (no change due to the change in device); uncertainties decrease when discharge increases and can reach 10% for discharges <10 L s-1 but are less than 2% for >100 L s-1. The main uncertainty concerns the rating curve and the speed measurement using a current meter; it can be estimated at around 10% due to the geometrical and stable section (the channels built in 1991 were cemented, and then no change was observed in the hydrometric section). We assume that a supplementary uncertainty exists in the first period data due to sediment transport, which is included in the water pressure measurement of the Chloe device; in the recent period (2004–2011), the measurement was given by a float, so hardly influenced by sediment concentrations <20 g L-1.
On-site daily rainfall values per event were measured by 12 gauges, mostly by the so-called ‘Malian peasant’® device (SIMPLAST, Bamako, Mali). In addition to these manual raingauges, two recording gauges recorded automatically after every 0.5 mm of rainfall (PM 3030®, Précis Mécanique, Bezons, France, connected to dataloggers Oedipe® type, Elsyde, Paris, France, during the first period, and HoBo® type, OnSet Computer Corp., Pocasset, MA, USA, during the second period). Each cumulative value of rainfall events was averaged by kriging, with the best linear unbiased estimator defined by Matheron (Citation1963), using the two series of datasets (with SURFER-8® software). These devices monitored rainfall and runoff and measured the duration of each rainfall and runoff event.
Uncertainties are low on the rainfall data, the main ones coming from the direct reading raingauges; since 80% of the rainfall falls by night in this area and the measurement is done early in the morning, evaporation is negligible. A correction can be done using the recording gauges data (not subject to evaporation) in the case of evening rainfall. However, no significant difference was noticed between the two device types for this kind of event. However, uncertainty is higher in the recording raingauges for small rainy events; as each tipping bucket is 0.5 mm, in the case of rainfalls <5 mm, uncertainty can reach 10%; but these events do not trigger runoff, thus they have a negligible impact on the rainfall/runoff relationship. Furthermore, for those events (<5 mm), we can use only the manual raingauges to limit the measurement error; however, the electronic record is used to measure rainfall intensities. Due to the small size of the catchments (800 m long on their major axis) we use a simple linear kriging. It is not necessary to introduce a variogram-based co-kriging: given that the main slope is to the west, and the main wind direction from the east, the rainfall variation between the raingauges is due more to the altitude gradient than to the distance; therefore, the difference between rainfall total amount calculated by linear kriging and by co-kriging (using a variogram) is less than 0.5%. Rainfall spatial variability is low due to the small size of the basins; for the main events triggering runoff, the coefficient of variation is rarely above 0.2, the lower values being generally observed on the downstream part of the basin.
Infiltration capacity and hydraulic conductivity were measured using disk infiltrometers (4 cm and 12.5 cm radius) at multiple suctions (Descroix et al. Citation2012a). At least 20 repetitions were carried out for each land cover type.
Soil moisture monitoring
The location of the soil water content measurements is shown in ; measurements were done in 2005 at two neighbouring sites to monitor the soil water content and its evolution simultaneously in fallow areas as well as in gullies. This was done with the objective of observing the progression of the wetting front in both soil surface types, which proved to be significantly different.
A set of devices was installed in order to monitor soil moisture in gullies and in their surrounding areas, and provided data from 2004 to 2010:
Two types of sensor were used to monitor soil water content: water content reflectometer probes (CS616®, Campbell Scientific Inc., Logan, UT, USA), and soil water tension meters (Watermark®, Irrometer Co., Riverside, CA, USA). shows the design of the station. Two field campaigns of soil gravimetric water content sampling were carried out in order to calibrate the two series of sensors at the same depths. The first campaign took place in the dry season, and the second during the rainy season, to take advantage of a larger range of water content and soil water tension values. Based on several tens of measurements for each set, the results were found to be close to the calibration provided by the manufacturers (RMSE CS616 = 0.0207; r2 = 0.65, 89 measurements; RMSE Watermark = 0.37, r2 = 0.55, 54 measurements) (Descroix et al. Citation2012a). All the sensors recorded automatically and were connected to a datalogger (Campbell CR10X®, Campbell Scientific, Leicester, UK) at a frequency of one measurement per minute averaged on a 30-min basis.
Neutron probe access tubes provided monthly soil water content information (weekly during the rainy season) at 11 locations within the Tondi Kiboro basins; four were located in gullies and the spreading sandy deposit areas and extended down to depths of 10 m, and two were installed to depths of 25 m; the seven others were located in crop and fallow areas. We used a CPN 503 DR® neutron probe (Campbell Pacific Nuclear, Martinez, CA, USA) for these measurements.
A recording piezometer (Diver® and Baro® sensors, Eijkelkamp, Giesbeek, The Netherlands) was used to monitor the water table level under the main gully (the mean depth of the water table was 46 m from the surface). The sensors’ precision is 1 mm and the frequency of measurements was 30 min. A manual measurement was done twice a month to control and calibrate the Diver. Its location was chosen to observe any recharge under the gully (see location in ).
summarizes information on the measurement programme of the implemented network.
Fig. 6 Arrangement of the soil water content monitoring devices at the soil water monitoring stations.
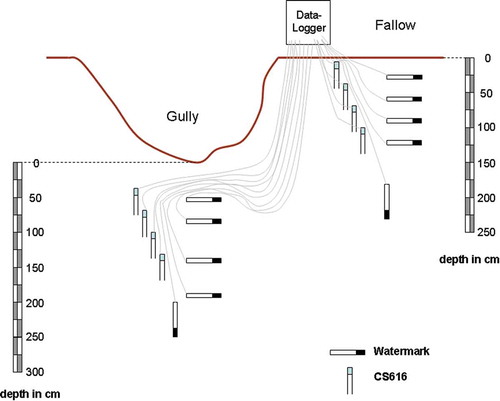
Table 1 Summary of the information on the measurement programme of the implemented network.
Land-use mapping
Land-use mapping was carried out using aerial photographs taken from an aeroplane in 1993 and from a PIXY® (IRD) drone in 2007. The PIXY is a motorized drone (http://www.drone-pixy.com/apropos/pixy.html) flying at 10–500 m and whose camera can provide photographs with a resolution of a few centimetres. The PIXY drone is equipped with a Canon 350 TI® (Canon, Tokyo, Japan) camera. Photographs were taken each year in October at the beginning of the dry season.
Some objects smaller than 10 cm can be localized. Several field campaigns were necessary to achieve the validation of the maps for both periods (Peugeot et al. Citation1997, Esteves and Lapetite Citation2003). The precision and definition of the photographs were sufficient to recognize all the vegetation formations without any doubts. The contours were determined and digitized using a GIS. Vegetation maps of the Tondi Kiboro basins () were prepared and the evolution between the two periods compared using Arc GIS®.
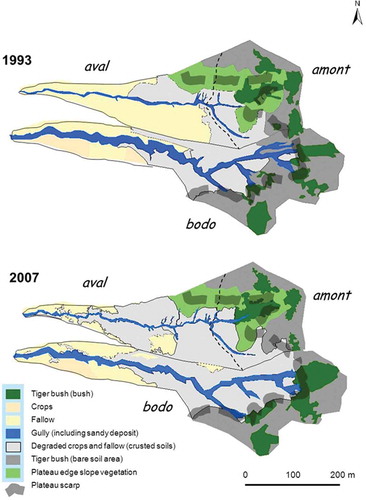
Fig. 7 Land cover and surface features in the three sub-basins in 1993 and 2007.
RESULTS
Land-use changes
As shown in the Introduction section, crops and fallow areas have increased and replaced the natural vegetation. Due to shortening of the period of fallow (see Introduction), crop yields have logically been observed to be decreasing (Hiernaux et al. Citation2009a). Crops and fallow are parts of the same cropping system; they are therefore represented together in the map, as a system. There is no need, from a hydrological point of view, to separate crops and fallow, as they have the same behaviour, even at the beginning of the rainy season, when neither has herbaceous or Graminaceae cover. The quality of the photographs and the field validation do not raise any doubts as to the validity of separating fallow and crops (areas without degraded soils) from areas of degraded soils (including those located in fallow and crop lands). In the photographs and in the field, both categories are very easy to distinguish from one another.
and show the evolution of land cover over the Tondi Kiboro catchments. There is little variation on the small upper (Amont) basin; in contrast, we observed a significant decrease in fallow area in the lower part of the northern basin (Aval). Fallow was replaced with degraded fallow, which is characterized by bare, mostly crusted soils. This degraded fallow covered 16% of the Aval basin in 1993 and 38% of the total area in 2007. Downstream from both Bodo and Aval catchments, the ‘sandy deposit’ area doubled between 1993 and 2007 (not shown in ). In the southern Bodo catchment, degraded fallow and crops covered, respectively, 22% and 33% of the total area in 1993 and 2007.
Table 2 Land cover in the three study catchments in 1993 and 2007.
In the catchments, upstream of the stream gauges, the sandy deposits are included in the ‘gully’ class (). The area of the latter did not change significantly during this period (+12% between 1993 and 2007, see ). However, the volume of stored sand in the gully significantly increased (field observations by the authors). Sandy deposits caused silting-up of all the hydrometric stations by 3–6 cm per year for 6 years (2004–2010) depending on the location and the slope of the kori channel. This represents 6–12 m3 of sediment per 100 m of river bed per year. In the only station where a comparison is possible with the first measurement period (1991–1994), the mean annual deposit between 1991 and 2009 was 1.8 cm deep.
Neither degraded fallow nor sandy deposit was observed in 1965 (a comparison was made based on CORONA® photographs). The quality of the aerial photographs of 1950 and 1975 and of the CORONA photographs from the second half of the 1960s is largely sufficient to map the sandy deposit. Two classes—degraded fallow and sandy deposit—have mostly replaced crops and fallow, which decreased strongly in spite of the increase in population.
Streamflow duration
At each station, the total duration of streamflow during a rainy season is calculated by summing the duration of individual floods. The total durations (in hours) of flows during periods 1 and 2 are given in . In the Uupper Amont (nested) basin, the total duration of streamflow did not change significantly between the two periods. However, the flow duration was significantly reduced at the outlet of the basin (Aval station), from 27 to 15 h per year, and it was even more significantly reduced at Bodo station, from 60 to 19 h, but for a shorter Period 2 (2007–2011 in this basin). In the nested basins, the difference between the duration in the Amont and the Aval stations also increased, highlighting the strong changes faced by the downstream part of the basin: effectively, floods have a shorter duration in the downstream part of the basin compared to the upper part.
Table 3 Rainfall and runoff data measurements in the three catchments during the two periods: P1: Period 1 (1991–1994) and P2: Period 2 (2004–2011). Kr: runoff coefficient; R: runoff; P: rainfall; r2 reg.: determination coefficient of the regression; N: number of events.
Runoff coefficients
also presents the rainfall, runoff (total yearly flows), mean instantaneous discharge (in L s-1), runoff depth and runoff coefficient (Kr) per sub-basin for both periods (Period 1: 1991–1994 and Period 2: 2004–2011). also includes the rainfall/runoff regression for each year, the determination coefficient (r2) of the regression and the number of events per year.
Most (85%) of the rainy events have a maximum intensity greater than 50 mm h-1. During Period 2 (2004–2011), the mean annual rainfall amount was 440 mm, of which 75% fell with an intensity >30 mm h-1, and 43% with >60 mm h-1 intensity. This is a factor explaining the observed high runoff coefficient; peak intensities >100 mm h-1 are observed five or six times per season.
Runoff coefficients did not change at the outlet of the Aval basin between Period 1 and Period 2, which included 105 and 234 rainy events, respectively. No increase in runoff coefficients at the seasonal time scale was observed. At the outlet of the upper basin (Amont station), however, the runoff coefficient was higher on average during the 2004–2011 period (Period 2; 235 rainy events) than during Period 1 (152 rainy events), increasing from 0.34 to 0.39. A similar evolution was observed in the Bodo catchment from Period 1 to Period 2 (in this case, Period 2 is 2007–2011), with the runoff coefficient increasing from 0.34 to 0.40 (for 151 and 134 rainy events, respectively). However, it is noteworthy that: (a) in the nested basins (Amont and Aval stations) the changes in runoff coefficient occurred in the upstream part of the basin, where land cover did not change significantly; and (b) the increase in runoff observed in the Amont and the Bodo catchments is not significant according to the Student t test ().
To compare the means of the two populations, the Student t test was effectively applied to the data of . The probability of a null hypothesis concerning the populations of both Period 1 (1991–1994) and Period 2 (2004–2011) is very high in all cases: rainfall, total yearly discharge and runoff depth, runoff coefficient, and duration of flow (except, in the latter, for the Bodo catchment).
The only change which appears as being significant (very low probability of null hypothesis) is the mean discharge (in L s-1), i.e. the total discharge volume divided by the total flow duration. In this case, the t test is quite convincing in two of the three basins: the probability of null hypothesis is: 0.275 for the Amont catchment, 0.001 for the Aval catchment and 0.001 for the Bodo catchment.
The change in discharge is not significant in the Amont catchment where, as shown above, land use has changed little. In the two other basins, the results indicate that the discharge has changed significantly between the periods.
also gives the equation of the rainfall/runoff relationship and its coefficient of determination (r2). At the event time scale and using the single rainfall/runoff relationship, there is a greater increase in the regression coefficient of the relationship R = aP + b (where R is runoff and P is rainfall), at the Amont station (from 0.53 in 1991–1994 to 0.69 in 2004–2011) and at the Bodo station (from 0.53 to 0.62) than at the Aval station (from 0.39 to 0.45).
These rising runoff coefficients are linked to land-use change (see above); the runoff behaviour of soils and basins are likely modified by the extension of the area of degraded, mostly crusted soils, which increased by 120% in the Aval catchment and by 50% in the Bodo catchment. Most of the degraded area is constituted of ‘ERO crust’ (Casenave and Valentin Citation1992).
Due to the small basin size and the low soil water holding capacity, the flow in the kori channels stops some minutes after the end of the rainfall, making it easy to differentiate each event from the previous one. shows the hyetograph and hydrograph of the Aval basin in 2011; gives the evolution of both rainfall and discharge for this station for the flood event of 13 September 2011, the highest flood observed in 2011. shows the rainfall/runoff relationship over the 2007–2011 period for the southern (Bodo) basin.
Fig. 8 Hydrograph and hyetograph of Bodo catchment in 2011.
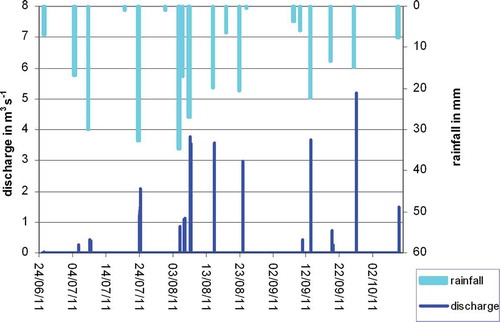
Fig. 9 Hydrograph of the flood of 13 September 2011 at the Aval station.
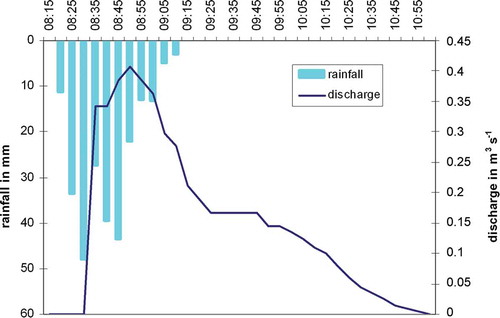
Fig. 10 Rainfall/runoff relationship in Bodo catchment (2007–2011).
Land-use change caused two main changes in the hydrological functioning of the Tondi Kiboro catchments:
an increase in discharge and runoff coefficients; and
a decrease in the total flow duration, evidently a consequence of the reduction in soil water holding capacity.
Neither of these parameters changed significantly (according to the t test). However, the mean instant discharge (total discharge divided by total time of flow) showed a meaningful change.
In the previous analysis, we only considered the rainy events that did not cause changes in connectivity. The catchments are sometimes connected to parts of the plateau that are usually endorheic, as already observed by Esteves and Lapetite (Citation2003). For some extreme events, changes in the connectivity probably appear in the upper part of the two main basins; water is able to flow past or to bypass the vegetated strips of tiger bush, which normally allow infiltration of all the running water flowing from the bare soil areas of the tiger bush. For two rainy events during Period 1 (1991–1994) and seven events in Period 2 (2004–2011), runoff coefficients >1 were observed; this is due to temporary extension of the catchment area. These changes are likely due to the degradation of tiger bush in the Fakara plateau, which increases the contributing watershed during extreme events.
Soil moisture monitoring
Wetting front values are very different from one land use to another. The evolution of the wetting front was measured by a soil moisture monitoring station to a depth of 2.5 m, and with neutron probe to 10 m depth.
gives, for each year, the maximum depth reached by the wetting front and the date of occurrence, as observed by both measurement types (soil moisture monitoring stations and neutron probe), according to whether the wetting front exceeded a depth of 2.5 m or not. Three classes of land use can be distinguished:
Class 1: characterized by a wetting front that reached >8 m depth every year during 2004–2010, this occurs in two contexts:
in the vegetated strip of tiger bush (TB Fakara plateau), due to the deep rooting system and dense vegetation,
under gullies and spreading areas, due to the sandy deposit where water is temporarily retained before infiltrating more deeply into the soil.
Class 2: comprises all the other non-degraded environments (): (a) pearl millet crops, and (b) fallow, and areas surrounding Faidherbia albida trees (‘gaos’).
Class 3: characterized by a wetting front of <1.5 m depth, it is composed of bare soils: (a) the natural bare soils of the bare component of the tiger bush, and (b) the degraded, crusted soils on fallow and cropped areas (ERO crust). The date of reaching the maximum value of soil water content does not vary in the same way: in the bare soil areas of tiger bush, maximum water content value is reached first (around 22 August on average); all the other land covers reach their maximum water content in mid September, except the spreading areas where the wetting front continues lowering until 5 October on average.
Table 4 Depth (m) reached by the wetting front each year, and the 7-year mean, per land use; the date of occurrence of the maximum depth is noted. TB: tiger bush; ERO crust is defined by Casenave and Valentin (Citation1992); SD: standard deviation (highlighted values in bold) were partially reconstructed and N is the number of neutron probe measurement sites (between 10 and 25 depths documented at each site).
DISCUSSION
When comparing the land-cover maps of 1993 and 2007 (; see also ), significant changes in land-cover distribution are noticed, particularly the 120% and 50% increase in degraded soils in the nested (Amont + Aval basin) and Bodo basins (see ), respectively; these changes led to significant modifications in surface features and soil hydrodynamic behaviour. The soil surface features and their hydrodynamic characteristics were determined by Casenave and Valentin (Citation1989), who reported runoff coefficients for each category. In the same basin, Mamadou (Citation2012) and Le Breton (Citation2012) measured the runoff coefficients cited in , at the plot scale (10 and 100 m2).
Table 5 Runoff coefficient observed in plots (average of four repetitions per class and five measurement years 2004–2008). Kr: runoff coefficient; Ks: hydraulic conductivity.
Increasing runoff has been observed throughout the Sahel; this is true locally at the small basin scale. It has been observed in Burkina Faso, by Albergel (Citation1987) and Karambiri et al. (Citation2003), at experimental sites. Recently, Mounirou (Citation2012) highlighted the role of land-use change in the increased flows of the Tougou basin (northern Burkina Faso).
Furthermore, this trend has also been reported at the large basin scale. Apart from Liénou et al. (Citation2009) in northern Cameroon, all other studies to our knowledge have reported a rise in river discharge of Sahelian rivers, as recently shown by Mahé and Paturel (Citation2009) in Mauritania and Mahé et al. (Citation2011) in Nigeria. These authors demonstrated that the whole Sahel is affected by this phenomenon as demonstrated by Amogu et al. (Citation2010) who compared the Sahelian regions, characterized by a progression of Hortonian processes and a rise in discharges (Horton Citation1933), to Sudanian areas (where annual rainfall is higher than 700 mm) mostly dominated by Hewlettian functioning (Cappus Citation1960, Hewlett Citation1961), and characterized by decreasing flows. Land-use changes, and particularly soil crusting are likely to be responsible for the increasing flood hazard in West Africa (Tarhule Citation2005, Tchakert et al. Citation2010, Sighomnou et al. Citation2013). Amogu et al. (Citation2010) showed that part of the rise in flows could be due to a widening of the watershed by expanded exorheism. Descroix et al. (Citation2012b) observed that the discharge of Sahelian rivers (the right bank tributaries of the Niger River, amongst others) are nowadays two to three times higher than during the 1960s, in spite of the persistent rainfall deficit.
The second important trend to be highlighted is the earlier occurrence of runoff and flooding in Sahelian regions. This was first reported by Amani and Nguetora (Citation2002) who showed that the flood of Sirba River occurred on average one month earlier during the 1980s than during the 1960s. Recently, Descroix et al. (Citation2012b) showed that the annual red flood of the Niger River in Niamey now occurs 40 days earlier than during the 1950s. This was also attributed to land-use change, particularly the shift from natural bush to crops and fallows, where bad agricultural practices provoke soil crusting; this was also demonstrated at the point and plot scales (Descroix et al. Citation2012a).
No change in annual rainfall amount was observed () during the two observation periods (1991–1994 and 2004–2011). Le Barbé et al. (Citation2002) showed that the West African drought began in 1968. More recently, it was shown that the mean rainfall intensity did not change significantly in recent decades (Amogu et al. Citation2010). However, a slight increase in extreme events was observed recently in the region (Descroix et al. Citation2012b, Panthou et al. Citation2012, Sighomnou et al. Citation2013).
Regularly processed neutron probe soil water content data highlighted a strong difference between:
The characteristics of millet crops, fallow and degraded areas, where only slight changes in soil water content are observed during the year, and only to a depth of 2 m ( and top).
The characteristics of the tiger bush vegetated stripes, and of the gullies and spreading areas, where a high annual soil moisture variability is observed to a depth of 10 m, as shown in (bottom).
Fig. 11 Profiles of neutron probe ratio (a surrogate for soil water content) under fallow (top) and under the gully (bottom) as an example in 2006.
and show a rapid extension of the area of degraded crops and fallows, characterized by ‘degraded (crusted)’ soils. As crusted soils have a low infiltration capacity, we attribute the increase in runoff coefficient at the small basin scale to these land-use evolutions. The Aval basin runoff coefficient did not increase as expected when considering (crusted soils have a high runoff coefficient) and (crusted soils have significantly increased between the two observation periods). This is due to the deposition of significant volumes of sand at the bottom of gullies, another consequence of land degradation; these deposits favour infiltration over runoff. We observed a 120% increase in the crusted soil area in the northern catchment (Aval + Amont).In the Aval part, 2.5 ha were converted into newly crusted soil area between 1993 and 2007. Since the mean runoff coefficient in crusted soils is 60% compared to of 10% in fallows, this represents a supplementary annual volume of 6250 m3, i.e. 50% of the total discharge, which is not measured at the outlet. As evaporation during rainy events is negligible, we could only consider that this volume has infiltrated in the gully (as confirmed by neutron probe measurements). The deep infiltrated water likely reaches the water table, contributing to the accelerated rise in its level (Descroix et al. Citation2009, Descroix et al. Citation2012a). In the same way, the total discharge measured at the outlet was completely infiltrated in the spreading area downstream of the stream gauge station ().
In the Wankama basin, (14 km north of Tondi Kiboro), Descroix et al. (Citation2012a) showed that in a 150 m long section of the kori, 20 000 m3 of water infiltrated each year in the kori channel; this constituted 53% of the total volume discharged at the upstream end of the considered reach. In the same neighbouring basin, Le Breton (Citation2012) demonstrated a great extension of the gully networks between 1950 and 2004. A similar observation was made in northern Burkina-Faso by Karambiri et al. (Citation2003). Peugeot et al. (Citation1997) showed that there was no infiltration under cropped areas of the Tondi Kiboro basin, but they regarded the gullies as significant infiltration areas. In this same basin, Esteves and Lapetite (Citation2003) noticed that between 1991 and 1994, “infiltration through the bottom of the gully between two gauging stations led to considerable runoff water transmission losses”. Gullies in the Tondi Kiboro site increased only slightly in length and width (+12% in area, see ) between the two observation periods (1993 and 2007), but they also increased in depth (see Section 3.1). Some authors proposed that gullies, sandy deposits and spreading areas were likely areas of deep infiltration and water table recharge (Leblanc et al. Citation2008, Favreau et al. Citation2009, Descroix et al. Citation2012a). The streams from the Aval and Bodo basins are collected by a small pond situated downstream which until recently had no outlet. This pond was observed to dry up a few hours after rainfall events and it can be considered that most of the streamflow measured at the Aval and Bodo streamgauges infiltrates beneath this pond (more than 12 500 m3 year-1 from the Aval catchment, and more than 18 000 m3 year-1 from the Bodo catchment (). These values are very consistent with those measured in the Wankama basin (Descroix et al. Citation2012a).
Areas of sandy deposits are likely responsible for part of the increase in water table recharge measured in this area in the two last decades (Leduc et al. Citation2001, Leblanc et al. Citation2008). The increasing role of deep infiltration under gullies and spreading areas should explain the acceleration of the rise in water table levels in these basins (Séguis et al. Citation2004, Massuel et al. Citation2006, Favreau et al. Citation2009, Descroix et al. Citation2012a). The piezometric monitoring data shows that the water level is rising at the Tondi Kiboro experimental site, from –48.2 m in January 2005 to –46.5 m in January 2013 (see location in ). It rose by 1.7 m in 8 years, or 0.21 m per year; however, this is probably mainly due to the regional water table rise and therefore the contribution of Tondi Kiboro gully is difficult to isolate.
A reduction in the soil water holding capacity in the basin was observed which is related to soil crusting. This trend was also observed by Casenave and Valentin (Citation1989), at the point and the local scale, and by Amogu et al. (Citation2010) at the regional scale. provides measured values of hydraulic conductivity, highlighting the strong reduction of soil infiltrability with crusting. This type of hydrological consequence of land degradation was previously highlighted in northern semi-arid Mexico (Descroix et al. Citation2007).
Finally, the main changes observed are an increase in runoff and a reduction in the duration of streamflow. None of these changes is significant alone; but their combination through the mean instant discharge measured during the runoff periods increased meaningfully between periods 1 and 2 in the Amont and the Bodo basins.
CONCLUSION
Some modifications have occurred in the water cycle in small Sahelian basins (from 4 to 12 ha) in the last two decades. This was determined by comparing data measured at the beginning of the 1990s (1991–1994) and data collected in the mid-2000s (2004–2011) for two small basins in southwestern Niger. The main changes that were observed are the following:
Runoff coefficients and river flows are increasing in small Sahelian catchments, as has been previously observed at the regional scale.
In the downstream part of the nested catchments, where simultaneous strong and deep infiltration has been measured under the streambed, only a small (sometimes null) increase is observed. Each year more than 42 000 m3 of water infiltrates under the spreading area shared by the two basins (mean 2004–2011), while this value was 37 000 m3 in 1991–1994 (respectively 30 500 and 33 800 m3 considering only events with Kr < 1, see ). Soil moisture monitoring confirms that gullies and spreading areas are deep infiltration zones; spreading areas have been observed to be increasing ().
A decrease in the total duration of runoff and floods, from 27 to 15 h per year in the Aval catchment, and from 60 to 19 h per year in the Bodo catchment.
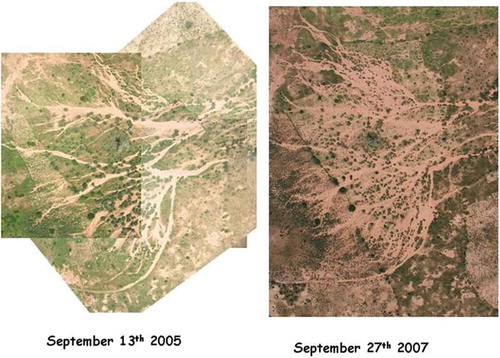
Fig. 12 Extension of the sandy deposit area located downstream from the catchments, between September 2005 and September 2007. A clear extension of sandy deposit is observed.
The combination of increasing runoff and diminishing flow duration led to a significant increase in mean instant discharge in two of the three gauged catchments.
This coupled land use and hydrologic cycle evolution is common in the Sahel, and the increase in runoff, particularly, has also been observed at the point scale (Descroix et al. Citation2012a) and the meso- and the regional scales (Descroix et al. Citation2009, Descroix et al. Citation2012b). This work described the processes at the elementary catchment scale (a few hectares).
The Aval basin has been equipped with anti-erosive devices since 2010; in the coming years, we aim to compare the evolution of runoff in the equipped and non-equipped catchments.
Funding
We warmly thank the JEAI (Jeune Equipe Associée à l’IRD) ‘SAPALOTE’ (Long Term Savannah Park) which funded and carried out the field measurements in 2010 and 2011.
This study was also partially funded by the ANR ECLIS (Contribution of livestock to the reduction of rural population vulnerability and to the promotion of their adaptability to climate and society changes in Sub-Saharan Africa) French programme and by the ANR ESCAPE-10-CEPL-005 (Environmental and Social Changes in Africa: Past, present and future) French programme. It was carried out within the framework of the AMMA project (African Monsoon Multidisciplinary Analyses). Based on a French initiative, AMMA was built by an international scientific group and is currently funded by a large number of agencies based in France, the United Kingdom, the USA and Africa. It has been the beneficiary of a major financial contribution from the European Community’s Sixth Framework Research Programme. Detailed information on scientific coordination and funding is available on the AMMA International web site http://www.amma-international.org. This research was also funded by the ECCO-PNRH French National Hydrological Research Programme.
Acknowledgements
Overall, thank you very much to the reviewers who helped us to improve significantly the quality of this manuscript.
Related Research Data
REFERENCES
- Ada, L. and Rockstrom, J., 1993. Diagnostic sur le système agraire du « Zarmaganda central » (Niger). Thesis (Mémoire de fin d’études) INAPG, Paris.
- Albergel, J., 1987. Genèse et prédétermination des crues au Burkina Faso; du m2 au km2, étude des paramètres hydrologiques et de leur évolution. Thesis (PhD) Université Paris 6, Editions de l’Orstom.
- Amani, A. and Nguetora, M., 2002. Evidence d’une modification du régime hydrologique du fleuve Niger à Niamey. In: H. Van Lannen and S. Demuth, eds. FRIEND 2002 Regional hydrology: Bridging the gap between research and practice. Wallingford: International Association of Hydrological Sciences, IAHS Publ. 274, 449–456.
- Ambouta, J.M.K., Valentin, C., and Laverdière, M.R., 1996. Jachères et croûtes d’érosion au Sahel. Sécheresse, 7, 269–275.
- Amogu, O., 2009. La dégradation des espaces sahéliens et ses conséquences sur l’alluvionnement du fleuve Niger: méthodes expérimentales et modélisation. Thesis (PhD). Université Joseph Fourier, Grenoble.
- Amogu, O., et al., 2010. Increasing river flows in the Sahel? Water, 2 (2), 170–199. doi:10.3390/w2020170.
- Anyamba, A. and Tucker, C.J., 2005. Analysis of Sahelian vegetation dynamics using NOAA-AVHRR NDVI data from 1981–2003. Journal of Arid Environments, 63 (3), 596–614. doi:10.1016/j.jaridenv.2005.03.007.
- Cappelaere, B., et al., 2009. The AMMA-CATCH experiment in the cultivated Sahelian area of south-west Niger – Investigating water cycle response to a fluctuating climate and changing environment. Journal of Hydrology, AMMA special issue, 375, 34–51. doi:10.1016/j.jhydrol.2009.06.021.
- Cappus, P., 1960. Etude des lois de l’écoulement. Application au calcul et à la prévision des débits. Bassin expérimental d’Alrance. La Houille Blanche, No. A. 521–529.
- Casenave, A. and Valentin, C., 1989. Les états de surface de la zone sahélienne. Influence sur l’infiltration. Paris: Col. Didactique. Editions Orstom.
- Casenave, A. and Valentin, C., 1992. A runoff capability classification system based on surface features criteria in semi-arid areas of West Africa. Journal of Hydrology, 130, 231–249. doi:10.1016/0022-1694(92)90112-9.
- Chevallier, P. and Valentin, C., 1984. Influence des microorganisations pelliculaires superficielles sur l’infiltrabilité d’un type de sol sahélien. Bulletin Groupe Français d’Humidimétrie Neutronique, 17, 9–22.
- Chinen, T., 1999. Recent accelerated gully erosion and its effects in dry savanna, southwest of Niger. In: N. Hori, ed. Human response to drastic changes of environments in Africa. Faculty of Economics, Ryutsu Keizai University, Hirahata, Ryugasaki, Japan, 67–102.
- Collinet, J. and Valentin, C., 1979. Analyse des différents facteurs intervenant sur l’hydrodynamique superficielle. Nouvelles perspectives. Applications agronomiques. Cahiers Orstom, Série Pédologie, 17, 283–328.
- Costa, M.-H., Botta, A., and Cardille, J.A., 2003. Effects of large-scale changes in land cover on the discharge of the Tocantins River, Southeastern Amazonia. Journal of Hydrology, 283, 206–217. doi:10.1016/S0022-1694(03)00267-1.
- D’Herbès, J.M. and Valentin, C., 1997. Land surface conditions of the Niamey region: ecological and hydrological implications. Journal of Hydrology, 188–189 (1997), 18–42. doi:10.1016/S0022-1694(96)03153-8.
- Descroix, L. and Gautier, E., 2002. Water erosion in the southern French Alps: climatic and human mechanisms. Catena, 50, 53–85. doi:10.1016/S0341-8162(02)00068-1.
- Descroix, L., et al., 2007. Investigating the spatial and temporal boundaries of Hortonian and Hewlettian runoff in Northern Mexico. Journal of Hydrology, 346, 144–158. doi:10.1016/j.jhydrol.2007.09.009.
- Descroix, L., et al., 2009. Spatio-temporal variability of hydrological regimes around the boundaries between Sahelian and Sudanian areas of West Africa: a synthesis. Journal of Hydrology, AMMA special issue, 375, 90–102.
- Descroix, L., et al., 2012a. Experimental evidence of deep infiltration under sandy flats and gullies in the Sahel. Journal of Hydrology, 424–425, 1–15. http://dx.doi.org/10.1016/j.jhydrol.2011.11.019.
- Descroix, L., et al., 2012b. Change in Sahelian Rivers hydrograph: the case of recent red floods of the Niger River in the Niamey region. Global Planetary Change, 98–99, 18–30. doi:10.1016/j.gloplacha.2012.07.009.
- Esteves, M. and Lapetite, J.M., 2003. A multi-scale approach of runoff generation in a Sahelian gully catchment: a case study in Niger. Catena, 50, 255–271. doi:10.1016/S0341-8162(02)00136-4.
- Favreau, G., et al., 2009. Land clearing, climate variability, and water resources increase in semiarid southwest Niger: a review. Water Resources Research, 45, W00A16. doi:10.1029/2007WR006785.
- Fensholt, R. and Rasmussen, K., 2011. Analysis of trends in the Sahelian ‘rain-use efficiency’ using GIMMS NDVI, RFE and GPCP rainfall data. Remote Sensing of Environment, 115, 438–451. doi:10.1016/j.rse.2010.09.014.
- Govaerts, Y. and Lattanzio, A., 2008. Estimation of surface albedo increase during the eighties Sahel drought from Meteosat observations. Global and Planetary Change, doi:10.1016/j.gloplacha.2008.04.004.
- Gratiot, N., et al., 2010. Increase in surface runoff in the central mountains of Mexico: lessons from the past and predictive scenario for the next century. Hydrology and Earth System Sciences, 14, 291–300. doi:10.5194/hess-14-291-2010.
- Guengant, J.-P. and Banoin, M., 2003. Dynamique des populations, disponibilités en terres et adaptation des régimes fonciers: le Niger. Rome: FAO and Paris: CICRED. http://www.cicred.org/Eng/Publications/pdf/MonoNiger.pdf [Accessed: 29 November 2014].
- Hein, L. and De Ridder, N., 2006. Desertification in the Sahel: a reinterpretation. Global Change Biology, 12, 751–758. doi:10.1111/j.1365-2486.2006.01135.x.
- Hewlett, J.D., 1961. Soil moisture as a source of base flow from steep mountain watershed. Asheville: North Carolina US Forest Service, Southeastern Forest Experiment Station.
- Hiernaux, P., et al., 2009a. Trends in productivity of crops, fallow and rangelands in Southwest Niger: impact of land use, management and variable rainfalls. Journal of Hydrology, AMMA special issue, 375, 65–77. doi:10.1016/j.jhydrol.2009.01.032.
- Hiernaux, P., et al., 2009b. Woody plant population dynamics in response to climate changes from 1984 to 2006 in Sahel (Gourma, Mali). Journal of Hydrology, AMMA special issue, 375, 103–113. doi:10.1016/j.jhydrol.2009.01.043.
- Horton, R.E., 1933. The role of infiltration in the hydrologic cycle. EOS. American Geophysical Union Transactions, 14, 44–460.
- Hountondji, Y.-C., Ozer, P., and Nicolas, J., 2004. Mise en évidence des zones touchées par la désertification par télédétection à basse résolution au Niger. Cybergéo: revue européenne de géographie, No. 291, 1–18.
- Huber, S., Fensholt, R., and Rasmussen, K., 2011. Water availability as the driver of vegetation dynamics in the African Sahel from 1982 to 2007. Global and Planetary Change, 76, 186–195. doi:10.1016/j.gloplacha.2011.01.006.
- Karambiri, H., et al., 2003. Importance of soil surface characteristics on water erosion in a small grazed Sahelian catchment. Hydrological Processes, 17, 1495–1507. doi:10.1002/hyp.1195.
- Lawrence, P.A. and Sinclair, D.P., 1989. Chapter 2: Catchment hydrology and soil loss. In: P.A. Lawrence and P.J. Thorburn, eds. Changes in hydrology, soil fertility and productivity of Brigalow catchments following clearing. Report RQ89002. Roma: Queensland Department of Primary Industries.
- Le Barbé, L., Lebel, T., and Tapsoba, D., 2002. Rainfall variability in West Africa during the Years 1950–90. Journal of Climate, 15 (2), 187–202. doi:10.1175/1520-0442(2002)015<0187:RVIWAD>2.0.CO;2.
- Le Breton, E., 2012. Réponse des systèmes hydrologiques et érosifs aux changements environnementaux dans le bassin du Niger moyen Degré carré de Niamey – Niger. Thesis (PhD) Université Paris 8, 230 p.
- Leblanc, M., et al., 2008. Land clearance and hydrological change in the Sahel: SW Niger. Global and Planetary Change, 61 (3–4), 135–150. doi:10.1016/j.gloplacha.2007.08.011.
- Leduc, C., Favreau, G., and Schroeter, P., 2001. Long term rise in a Sahelian water-table: the Continental Terminal in South-West Niger. Journal of Hydrology, 243, 43–54. doi:10.1016/S0022-1694(00)00403-0.
- Liénou, G., et al., 2009. Variabilité climatique et transport de matières en suspension sur le bassin de Mayo Tsanaga: Extrême-Nord Cameroun. Sécheresse, 20 (1), 139–144.
- Loireau, M.. 1998. Espaces, ressources, usages: spatialisation des interactions dynamiques entre les systèmes écologiques au Sahel nigérien. Thesis (PhD). Université Montpellier 3.
- Mahé, G. and Paturel, J.-E., 2009. 1896–2006 Sahelian annual rainfall variability and runoff increase of Sahelian rivers. Comptes Rendus Geoscience, 341, 538–546. doi:10.1016/j.crte.2009.05.002.
- Mahé, G., et al. 2003. Augmentation récente du ruissellement de surface en région soudano sahélienne et impact sur les ressources en eau. In: E. Servat, et al., eds. Hydrology of the Mediterranean and semi-arid regions. Wallingford: International Association of Hydrological Sciences, IAHS Publ. 278, 215–222.
- Mahé, G., et al., 2011. Le fleuve Niger et le changement climatique au cours des 100 dernières années / The Niger River and climate change over 100 years. In: S. Franks, et al., eds. Hydro-climatology : variability and change. Wallingford: International Association of Hydrological Sciences, IAHS Publ. 344, 131–137.
- Mahé, G., et al., 2013. The rivers of Africa: witness of climate change and human impact on the environment. Hydrological Processes, HYP-12-0792.R2. doi:10.1002/hyp.9813.
- Mamadou, I., 2012. La dynamique accélérée des koris de la région de Niamey: conséquence sur l’ensablement du fleuve Niger. Thesis (PhD). Université Paris 8.
- Massuel, S., et al., 2006. Deep infiltration through a sandy alluvial fan in semiarid Niger inferred from electrical conductivity survey, vadose zone chemistry and hydrological modelling. Catena, 67, 105–118. doi:10.1016/j.catena.2006.02.009.
- Matheron, G., 1963. Principles of geostatistics. Economic Geology, 58, 1246–1266. doi:10.2113/gsecongeo.58.8.1246.
- Mounirou, L.A., 2012. Etude du ruissellement et de l’érosion à différentes échelles spatiales sur le bassin versant de Tougou en zone sahélienne du Burkina Faso: quantification et transposition des données. Thesis (PhD) 2iE – Ouagadougou, Burkina Faso/U. Montpellier 2, France.
- Panthou, G., et al., 2012. Extreme rainfall in West Africa: a regional modeling. Water Resources Reseach, 48, W08501. doi:10.1029/2012WR012052.
- Peterson, B.J., et al., 2002, Increasing river discharge to the Arctic Ocean. Science, 13 December 2002. 298 (5601), 2171–2173. doi:10.1126/science.1077445.
- Peugeot, C., et al., 1997. Runoff generation processes: results and analysis of field data collected at the East Central Supersite of the HAPEX-Sahel experiment. Journal of Hydrology, 188–189, 179–202. doi:10.1016/S0022-1694(96)03159-9.
- Prince, S.D., Brown de Colstoun, E., and Kravitz, L., 1998. Evidence from rain-use efficiencies does not indicate extensive Sahelian desertification. Global Change Biology, 4, 359–374. doi:10.1046/j.1365-2486.1998.00158.x.
- Rasmussen, K., Bjarne, F., and Madsen, J.-E., 2001. Desertification in reverse? Observations from northern Burkina Faso. Global Environmental Change, 11, 271–282. doi:10.1016/S0959-3780(01)00005-X.
- Raynaut, C., 2001. Societies and nature in the Sahel: ecological diversity and social dynamics. Global Environmental Change, 11, 9–18. doi:10.1016/S0959-3780(00)00041-8.
- Ruelland, D., et al., 2011. Comparison of methods for LUCC monitoring over 50 years from aerial photographs and satellite images in a Sahelian catchment. International Journal of Remote Sensing, 32 (6), 1747–1777. doi:10.1080/01431161003623433.
- Séguis, L., et al., 2004. Simulated impacts of climate change and land-clearing on runoff from a small Sahelian catchment. Hydrological Processes, 18, 3401–3413. doi:10.1002/hyp.1503.
- Sighomnou, et al., 2013. La crue de 2012 à Niamey: un paroxysme du paradoxe du Sahel? Sécheresse, 24, 3–13. doi:10.1684/sec.2013.0370.
- Siriwardena, L., Finlayson, B.-L., and McMahon, T.-A., 2006. The impact of land-use change on catchment hydrology in large catchments: the Comet River, Central Queensland, Australia. Journal of Hydrology, 326, 199–214. doi:10.1016/j.jhydrol.2005.10.030.
- Tarhule, A., 2005. Damaging rainfall and flooding: the other Sahel hazards. Climatic Change, 72, 355–377. doi:10.1007/s10584-005-6792-4.
- Tschakert, P., et al., 2010. Floods in the Sahel: an analysis of anomalies, memory, and anticipatory learning. Climatic Change, 103, 471–502. doi:10.1007/s10584-009-9776-y.
- Valentin, C. and Bresson, L.M., 1992. Morphology, genesis and classification of surface crusts in loamy and sandy soils. Geoderma, 55, 225–245. doi:10.1016/0016-7061(92)90085-L.
- Valentin, C. and Casenave, A., 1992. Infiltration into sealed soils as influenced by gravel cover. Soil Science Society of America Journal, 56 (6), 1667–1673. doi:10.2136/sssaj1992.03615995005600060002x.
- Van de Watt, H.V.H. and Valentin, C., 1992. Soil crusting: the African view. In: M.E. Summer and B.A. Stewart, eds. Soil crusting, chemical and physical processes, advances in soil science. Boca Raton, FL: Lewis Publ. 301–338.
- Vandervaere, J.-P., et al., 1997. Estimating hydraulic conductivity of crusted soils using disc infiltrometers and minitensiometers. Journal of Hydrology, 188–189, 203–223. doi:10.1016/S0022-1694(96)03160-5.
- Viramontes, D. and Descroix, L., 2003. Changes in the surface water hydrologic characteristics of an endoreic basin of northern Mexico from 1970 to 1998. Hydrological Processes, 17, 1291–1306. doi:10.1002/hyp.1285.